Upgrade to Pro — share decks privately, control downloads, hide ads and more …

Distributed Tracing using Spring Cloud Sleuth a...

Sponsored · Ship Features Fearlessly Turn features on and off without deploys. Used by thousands of Ruby developers. →

Distributed Tracing using Spring Cloud Sleuth and Zipkin

Avatar for Zoltan Altfatter

Zoltan Altfatter

November 18, 2016

More Decks by Zoltan Altfatter

Other Decks in Technology

Transcript

  1. About me • Zoltan Altfatter • Software Architect @triforkams •

    Twitter: @altfatterz • Blog: http://zoltanaltfatter.com
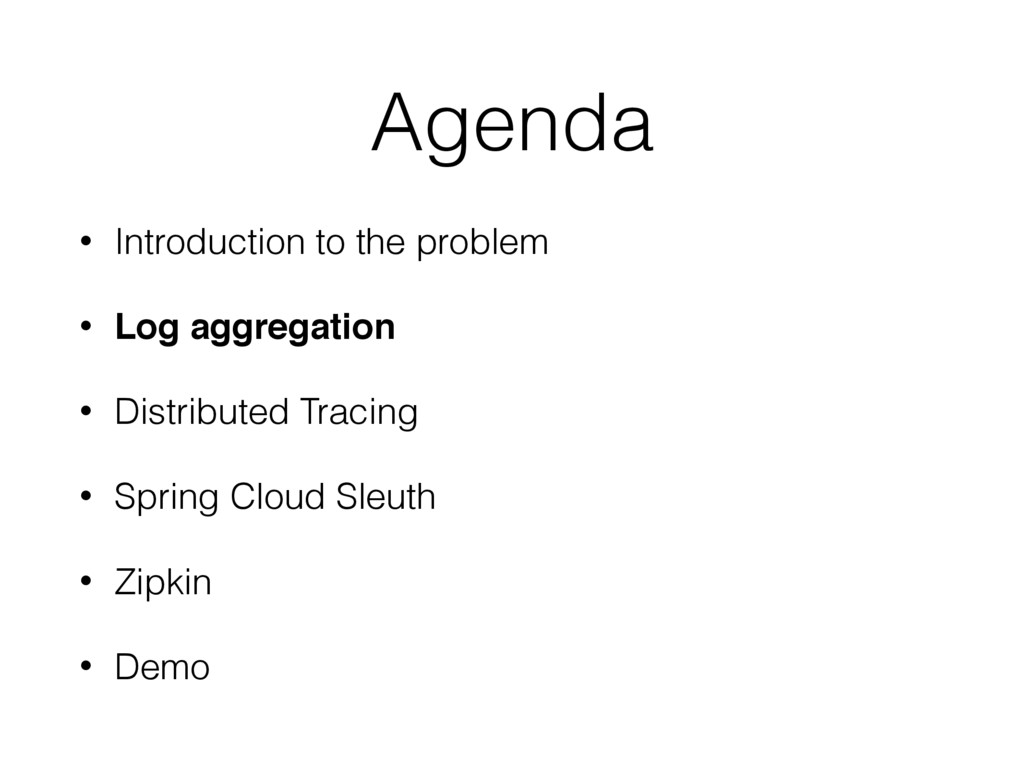
  2. Agenda • Introduction to the problem • Log aggregation •

    Distributed tracing • Spring Cloud Sleuth • Zipkin • Demo
  3. Agenda • Introduction to the problem • Log aggregation •

    Distributed Tracing • Spring Cloud Sleuth • Zipkin • Demo
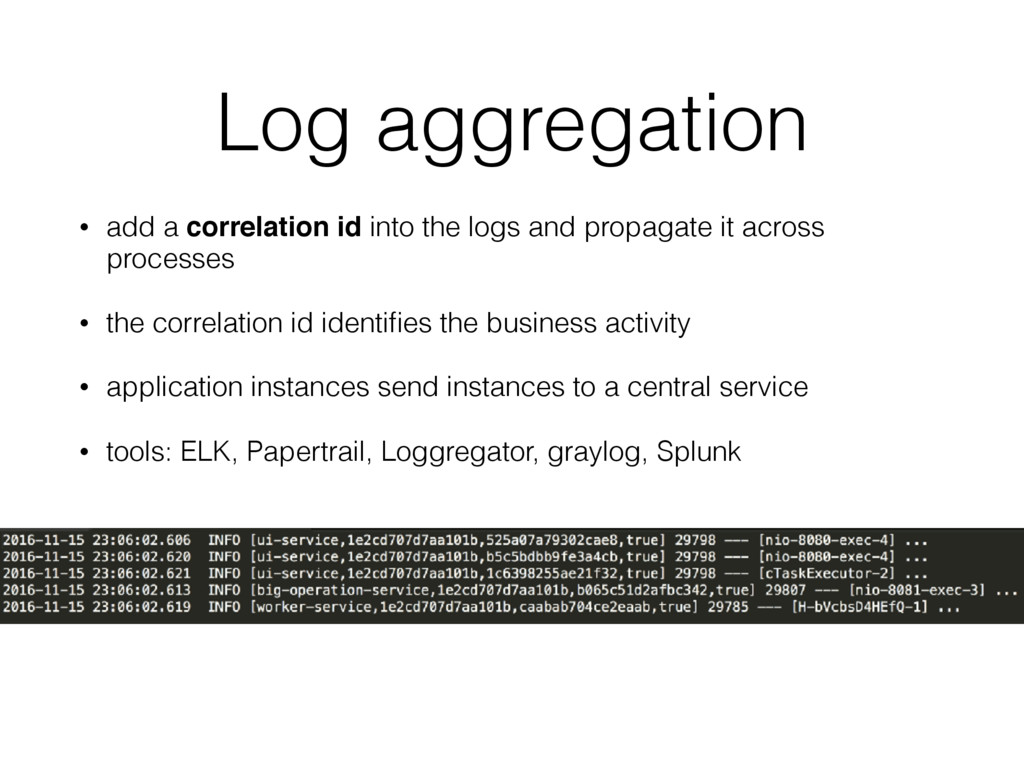
  4. Log aggregation • add a correlation id into the logs

    and propagate it across processes • the correlation id identifies the business activity • application instances send instances to a central service • tools: ELK, Papertrail, Loggregator, graylog, Splunk
  5. Agenda • Introduction to the problem • Log aggregation •

    Distributed tracing • Spring Cloud Sleuth • Zipkin • Demo
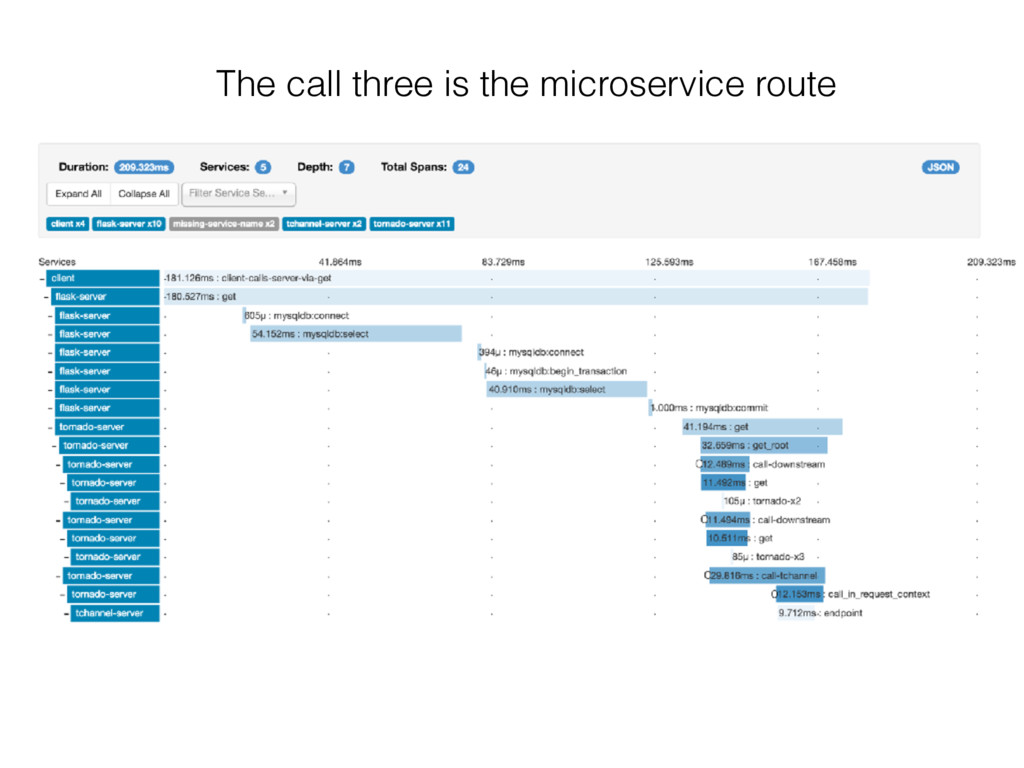
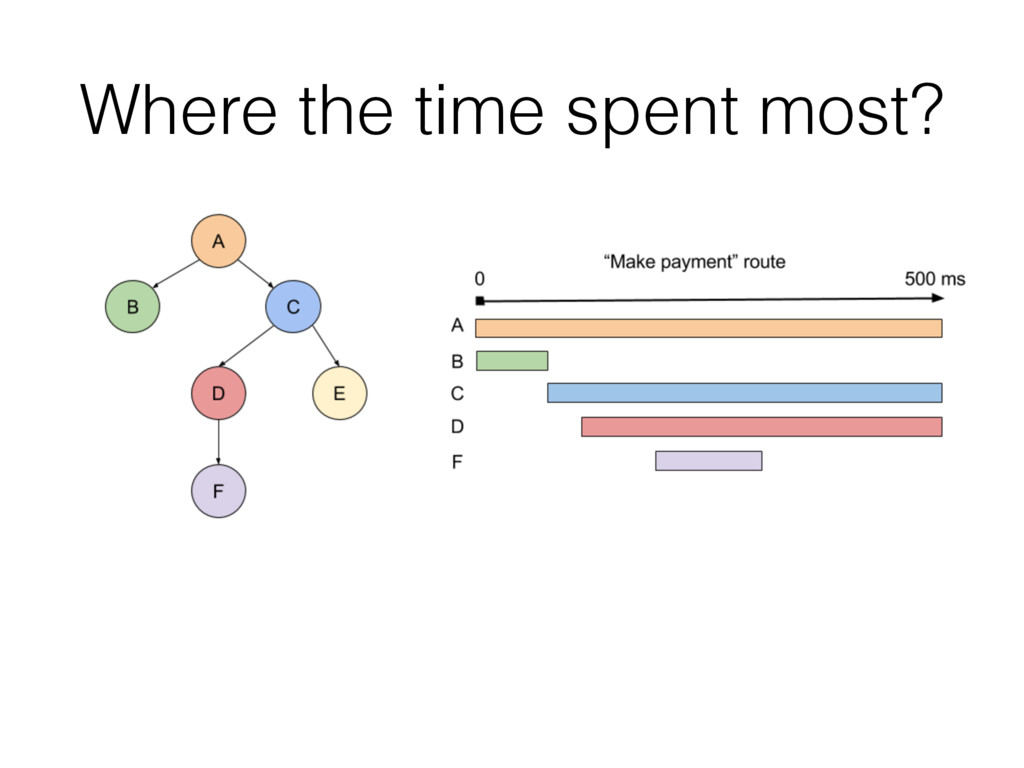
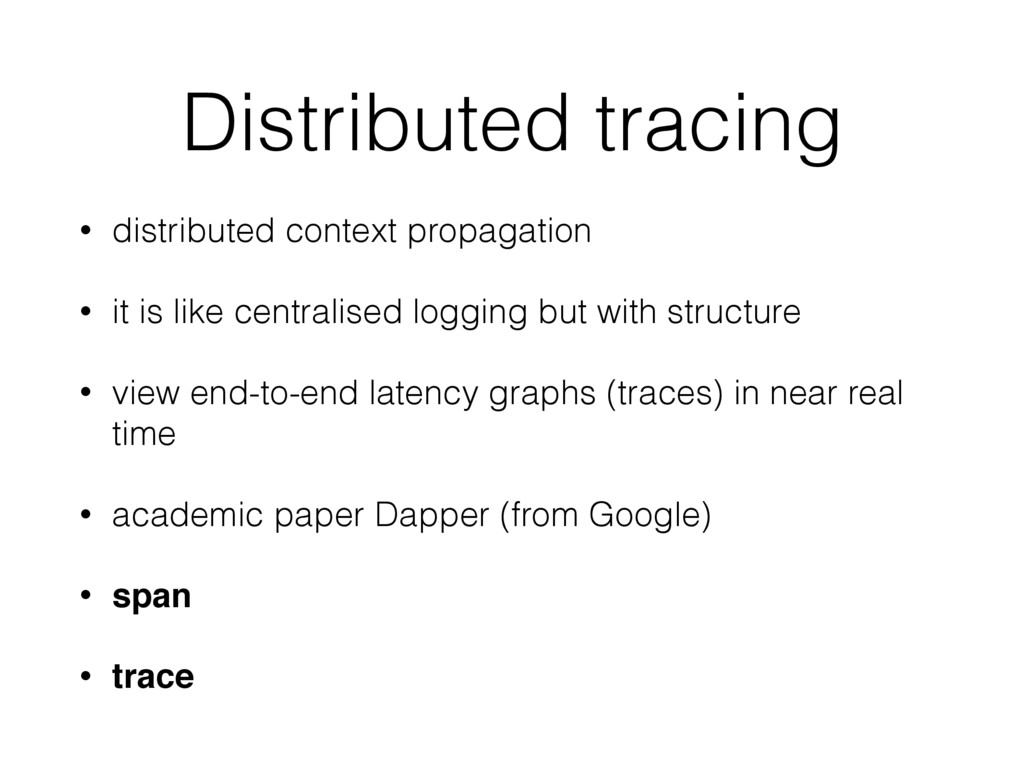
  6. Distributed tracing • distributed context propagation • it is like

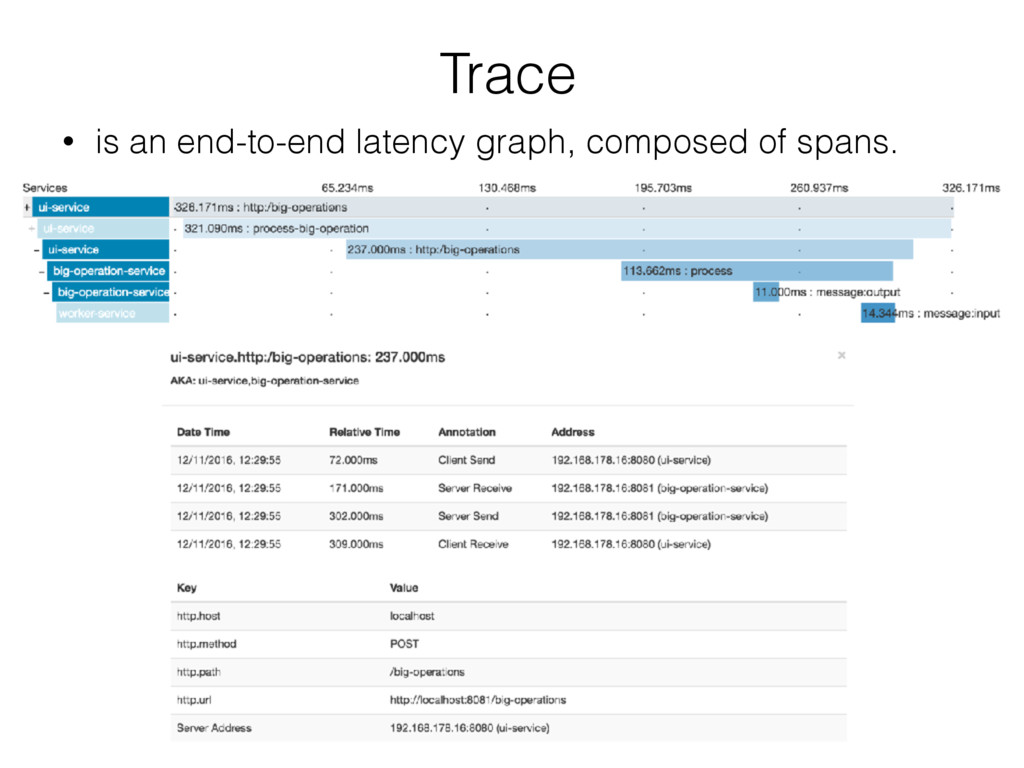
    centralised logging but with structure • view end-to-end latency graphs (traces) in near real time • academic paper Dapper (from Google) • span • trace
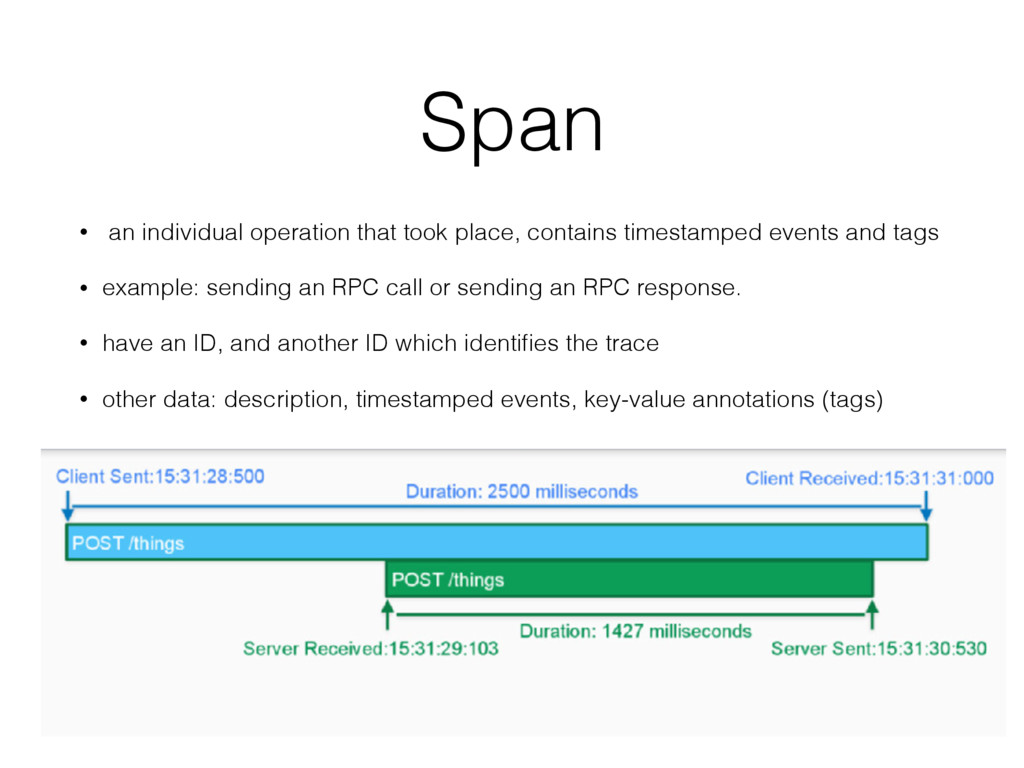
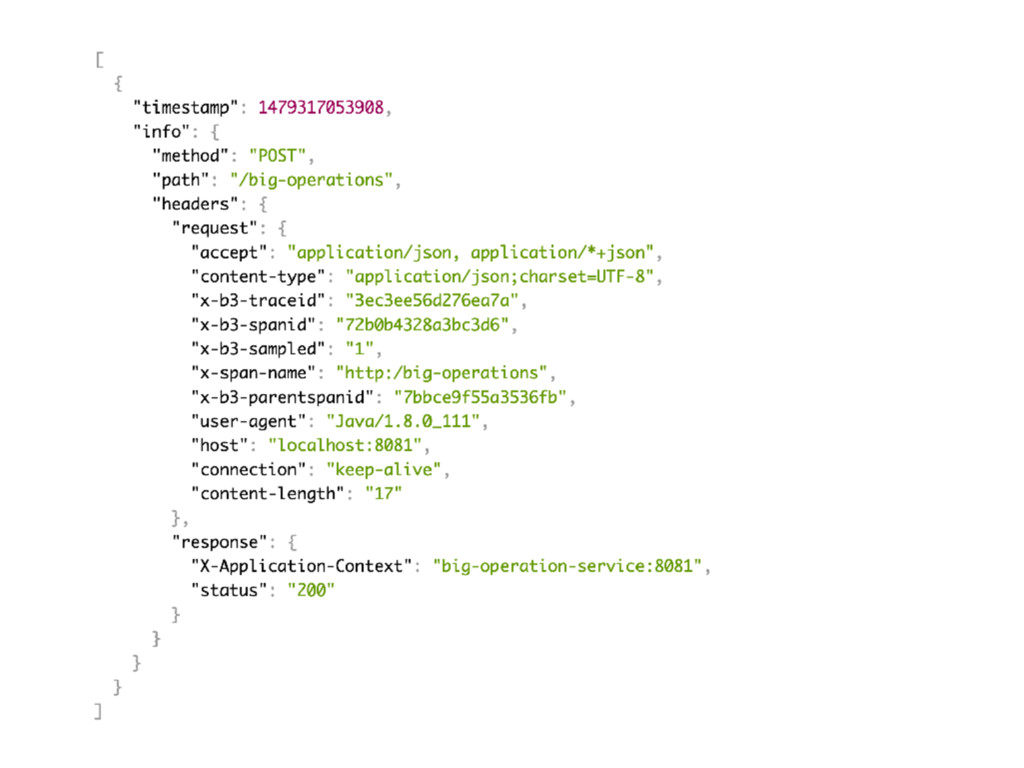
  7. Span • an individual operation that took place, contains timestamped

    events and tags • example: sending an RPC call or sending an RPC response. • have an ID, and another ID which identifies the trace • other data: description, timestamped events, key-value annotations (tags)
  8. Agenda • Introduction to the problem • Log aggregation •

    Distributed tracing • Spring Cloud Sleuth • Zipkin • Demo
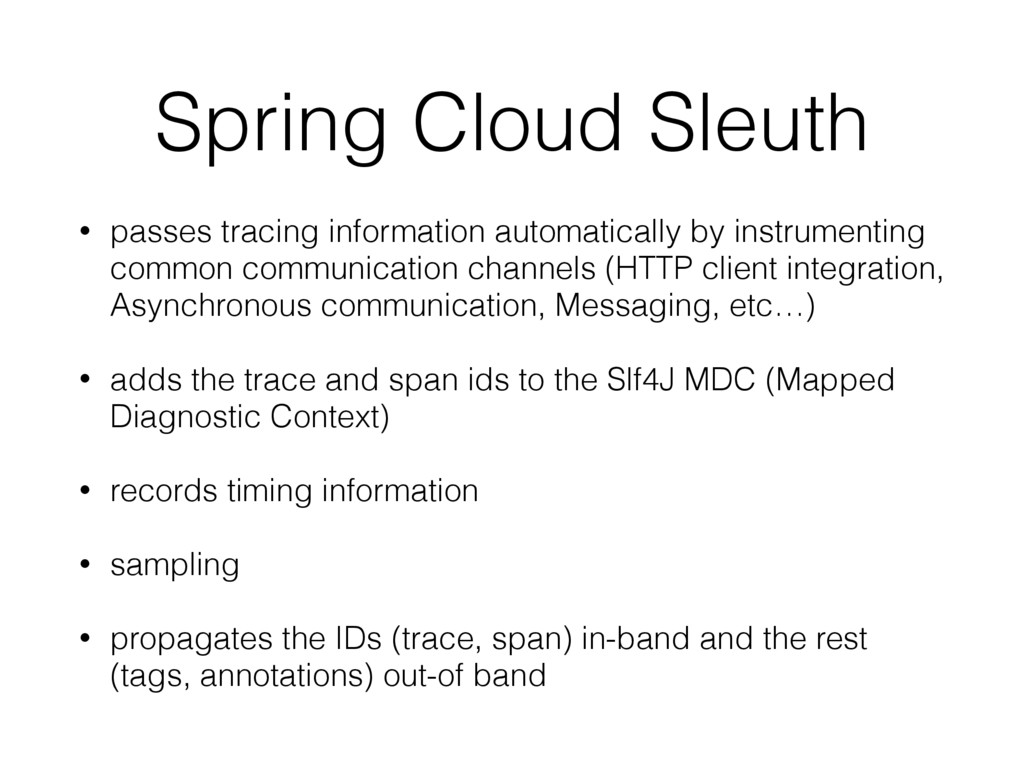
  9. Spring Cloud Sleuth • passes tracing information automatically by instrumenting

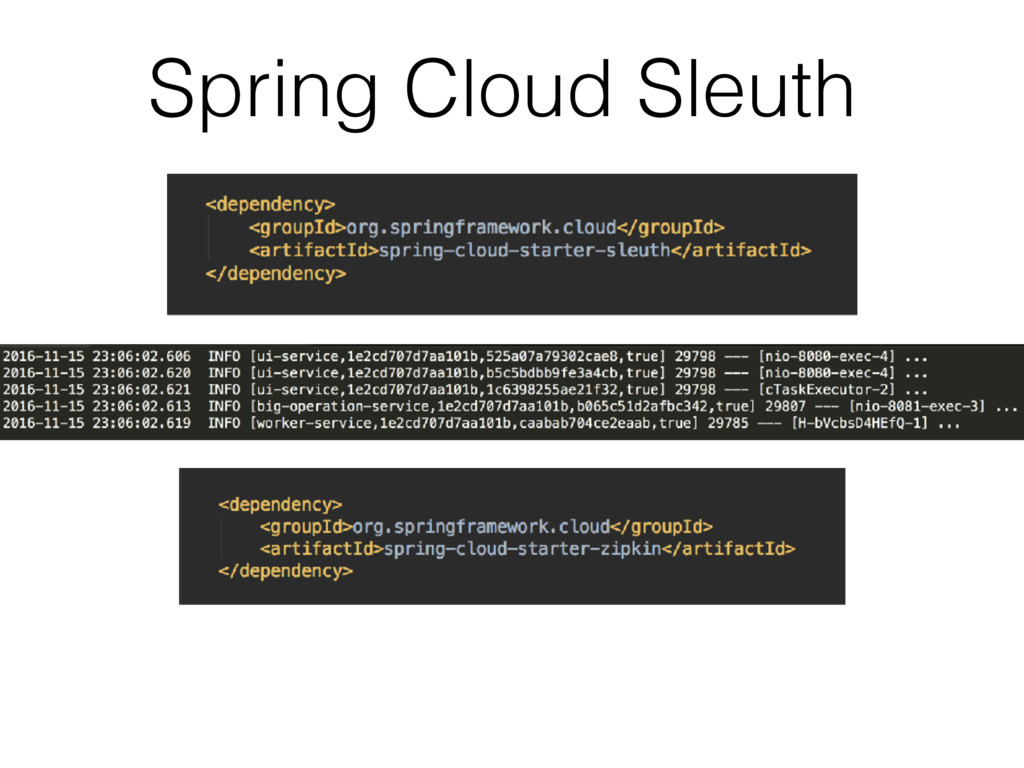
    common communication channels (HTTP client integration, Asynchronous communication, Messaging, etc…) • adds the trace and span ids to the Slf4J MDC (Mapped Diagnostic Context) • records timing information • sampling • propagates the IDs (trace, span) in-band and the rest (tags, annotations) out-of band
  10. Agenda • Introduction to the problem • Log aggregation •

    Distributed tracing • Spring Cloud Sleuth • Zipkin • Demo
  11. Zipkin • created byTwitter (open-sourced in 2012) • https://github.com/openzipkin •

    distributed tracing system • OpenZipkin is a GitHub organisation • aggregates timing data that can be used to track down latency issues. • the community is starting to standardise around Zipkin
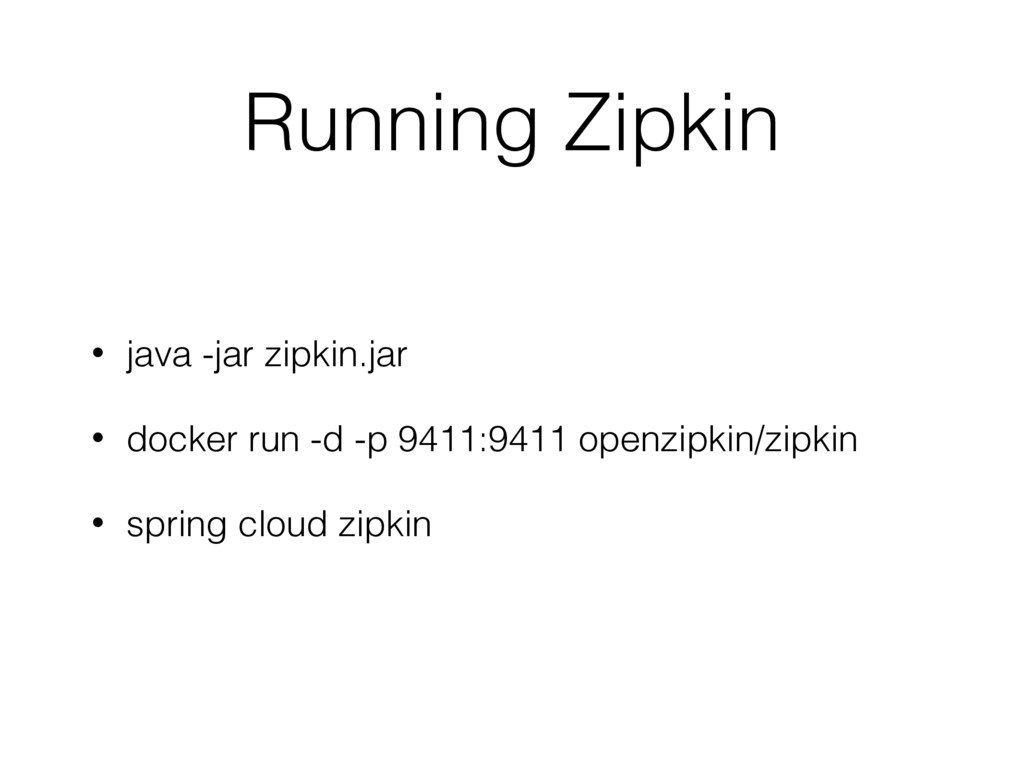
  12. Running Zipkin • java -jar zipkin.jar • docker run -d

    -p 9411:9411 openzipkin/zipkin • spring cloud zipkin
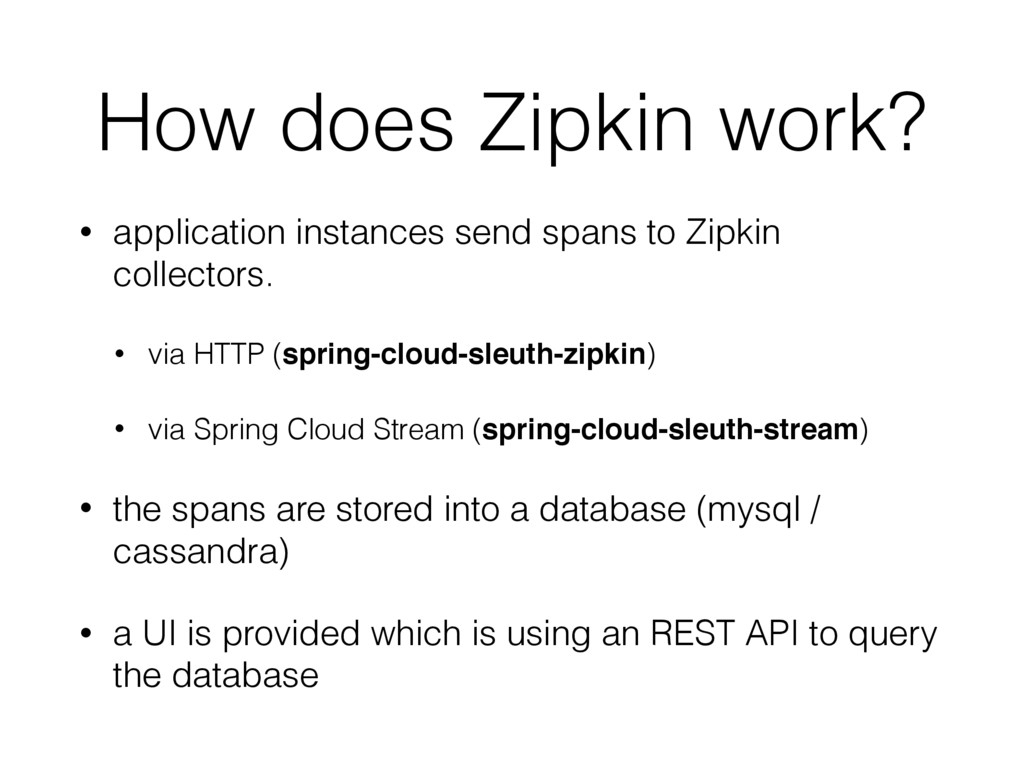
  13. How does Zipkin work? • application instances send spans to

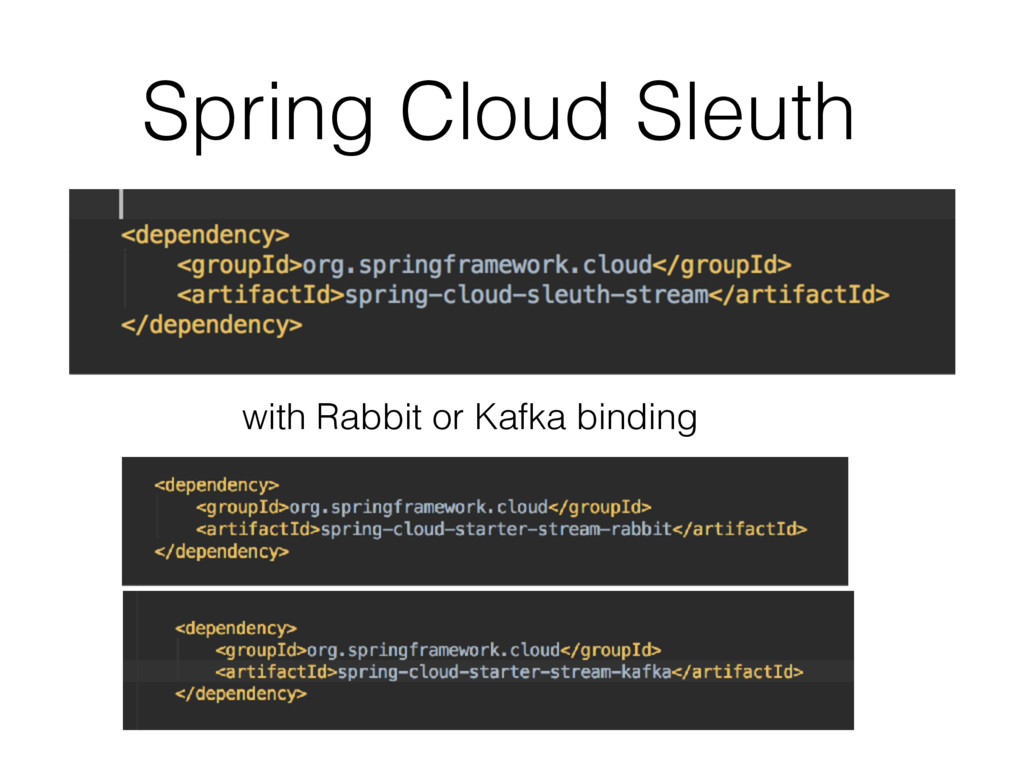
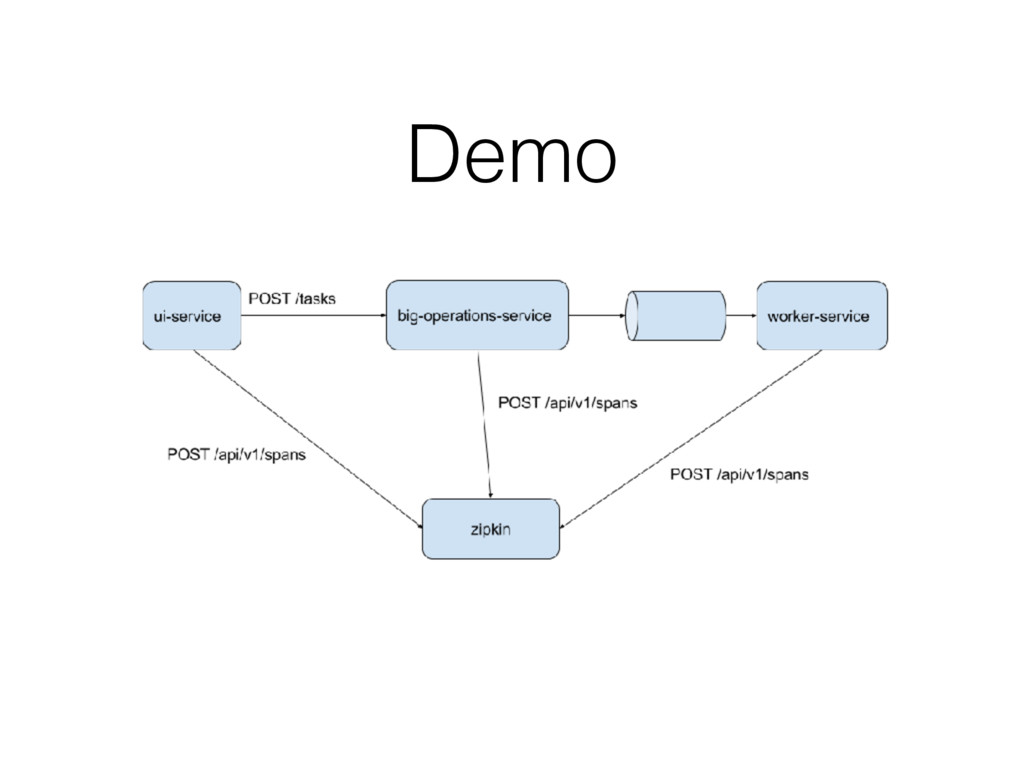
    Zipkin collectors. • via HTTP (spring-cloud-sleuth-zipkin) • via Spring Cloud Stream (spring-cloud-sleuth-stream) • the spans are stored into a database (mysql / cassandra) • a UI is provided which is using an REST API to query the database
  14. Agenda • Introduction to the problem • Log aggregation •

    Distributed tracing • Spring Cloud Sleuth • Zipkin • Demo