Upgrade to Pro — share decks privately, control downloads, hide ads and more …

Monitoring and Alerting: Knowing the Unknown

Monitoring and Alerting: Knowing the Unknown

Amanda Sopkin

November 10, 2018
Tweet

More Decks by Amanda Sopkin

Other Decks in Programming

Transcript

  1. Principles of a Solid Monitoring/Alerting System No single point of

    failure in monitoring system Alerts are clear and actionable If everything is quiet, something is wrong
  2. Set priorities “99.99% uptime for the zoombinator responses to emails”

    Minimize latency to X service from Z. Prioritize traffic on Fridays in November.
  3. Alert on symptoms, not causes Is this indicative of a

    direct impact on user work? Are there various causes possible? Could this NOT have an impact?
  4. Alert on symptoms, not causes Server load is high This

    server is down for maintenance Slow site responses
  5. Keep it simple “The zoombinator received userid 10202 and returned

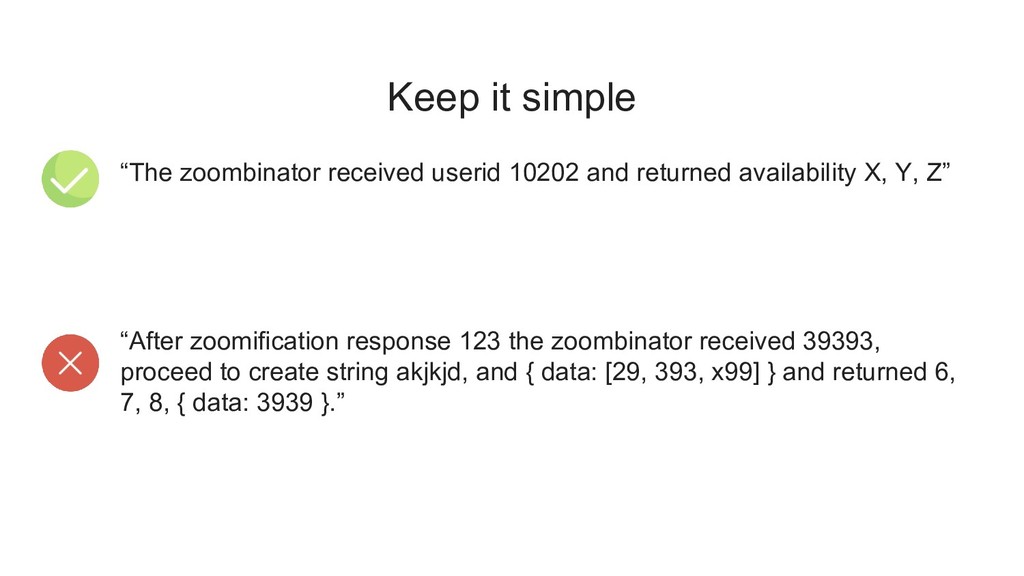
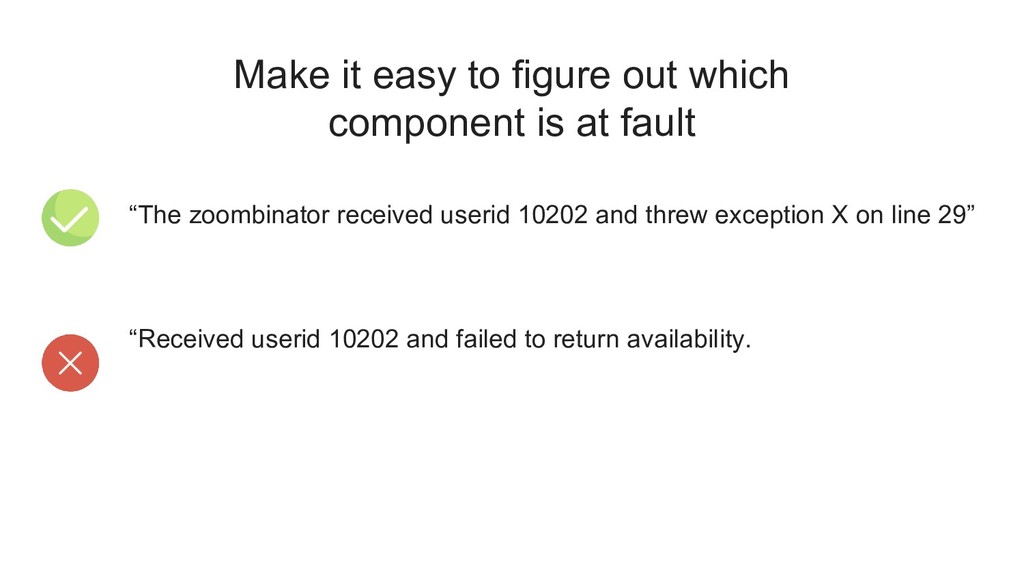
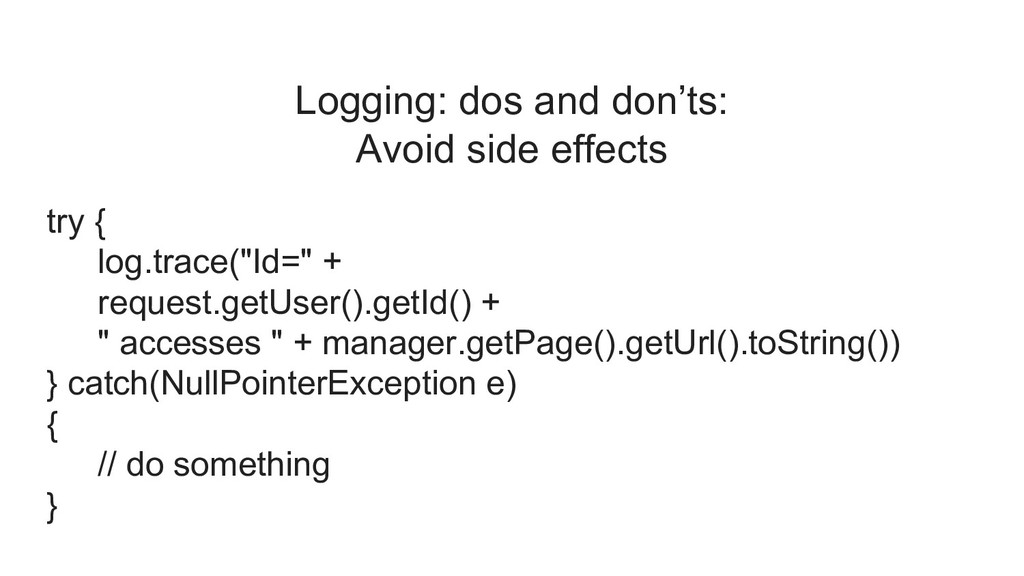
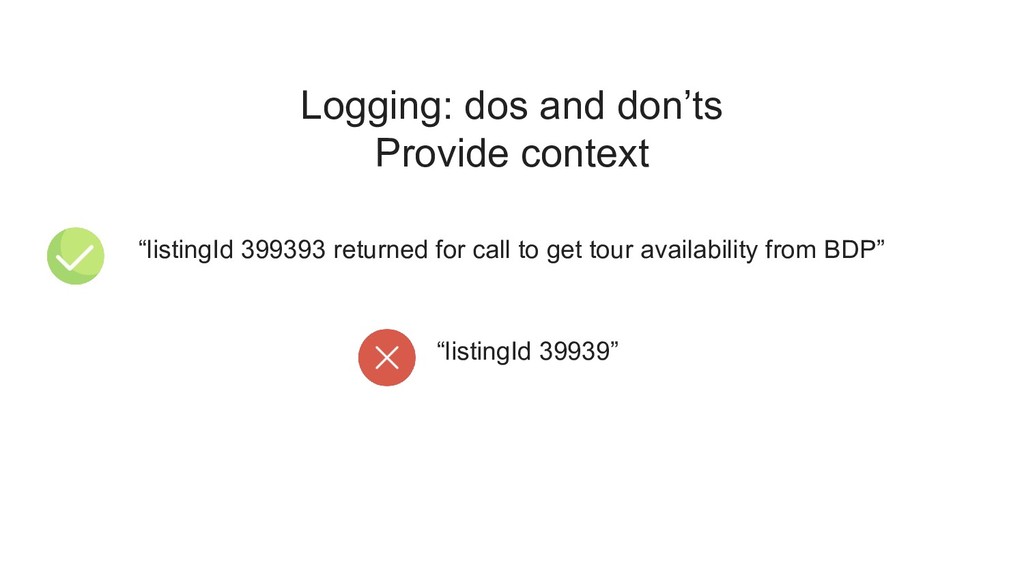
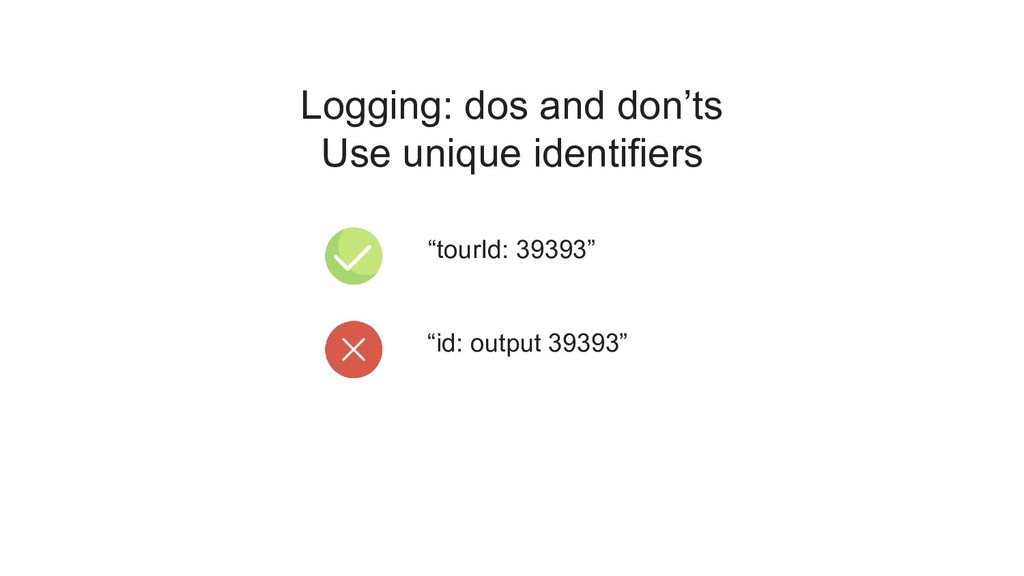
    availability X, Y, Z” “After zoomification response 123 the zoombinator received 39393, proceed to create string akjkjd, and { data: [29, 393, x99] } and returned 6, 7, 8, { data: 3939 }.”
  6. Consoles are Have no more than 5 graphs on a

    console. Have no more than 5 plots (lines) on each graph. You can get away with more if it is a stacked/area graph.
  7. Make it easy to figure out which component is at

    fault “The zoombinator received userid 10202 and threw exception X on line 29” “Received userid 10202 and failed to return availability.
  8. Create a process for addressing and resolving alerts 1. Alerts/pages

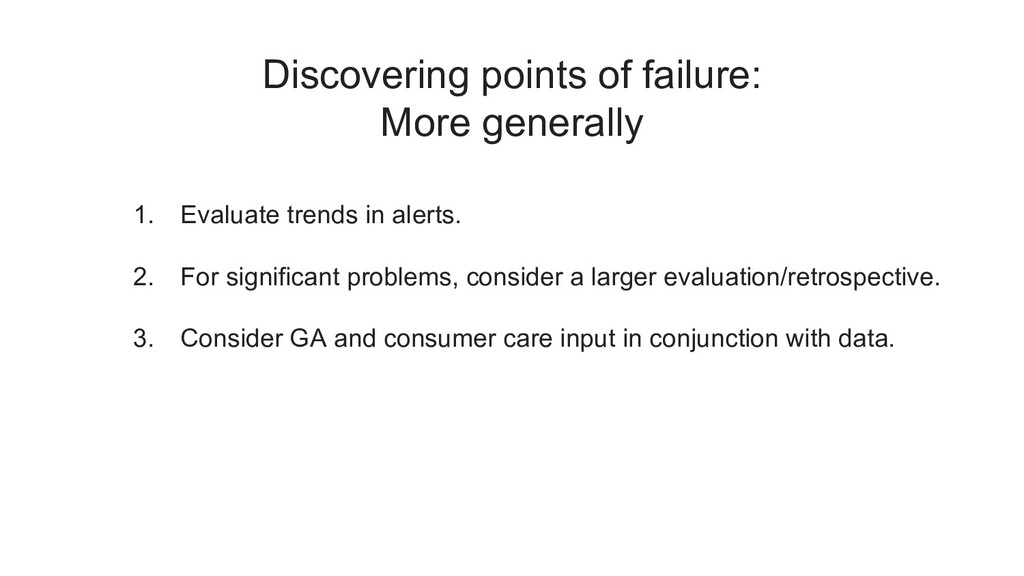
    will go to the team alias. 2. Current “team guardian” will address all alerts and provide an update to the team. 3. Alerts will be diagrammed to show their trends.
  9. Discovering points of failure Escalation procedures What will happen if

    no one responds? What is the appropriate chain? After hours vs. on the job?
  10. Discovering points of failure: Latency the 99th percentile latency is

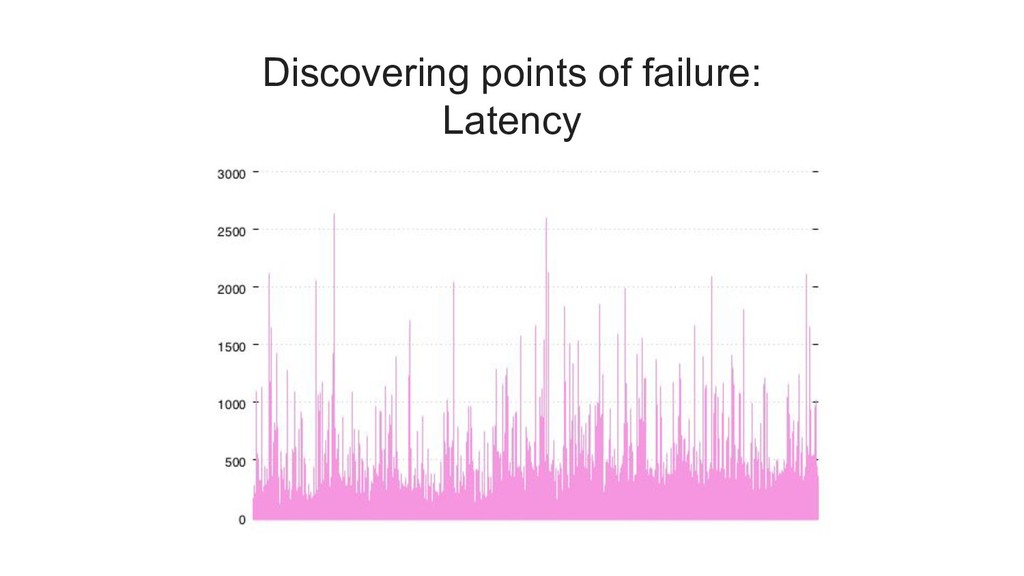
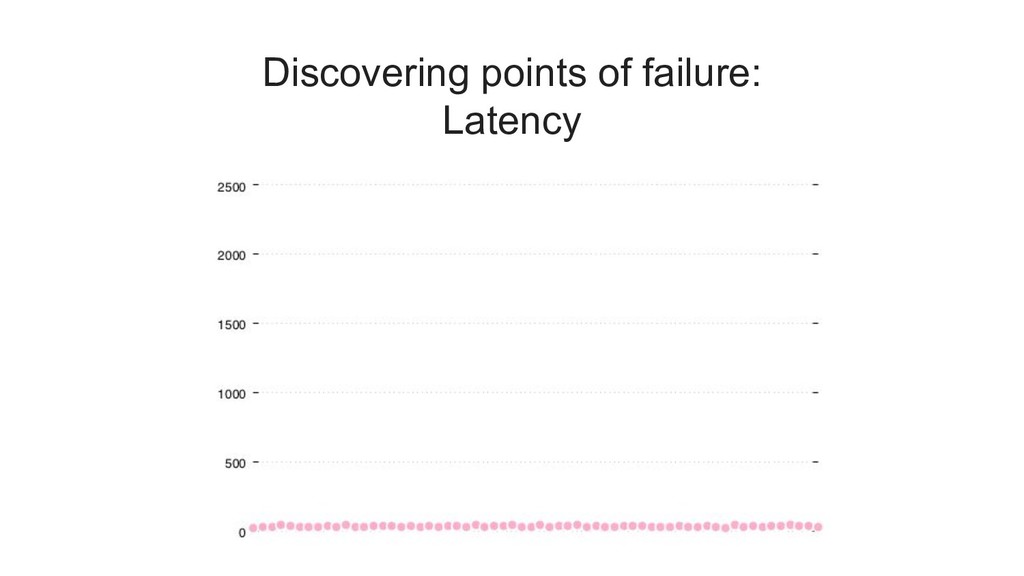
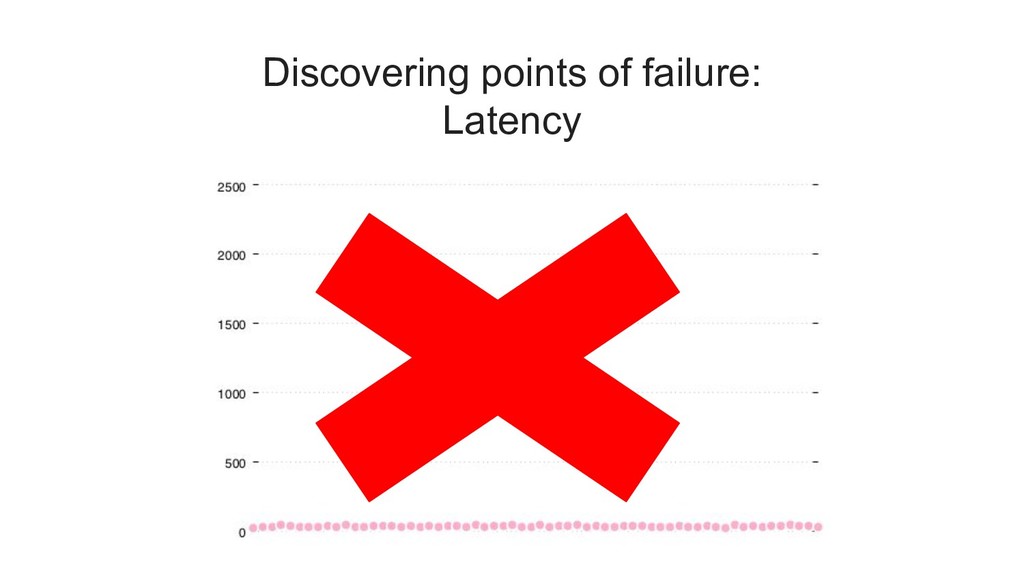
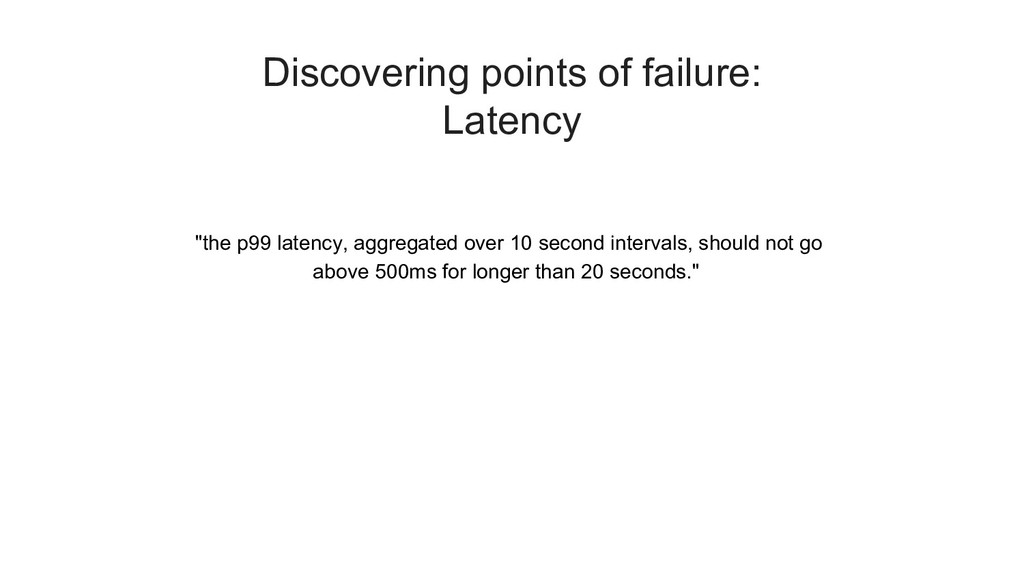
    the worst latency that was observed by 99% of all requests. it is the maximum value if you ignore the top 1%. a common notation for 99th percentile is "p99"
  11. Discovering points of failure: Latency but p99 is still ignoring

    the worst 1% of requests. if you want to see the worst latencies, you can take a look at the p100 latency, often called the maxiumum or the max
  12. Discovering points of failure: Latency you can define a cut-off

    latency of (for example) 500ms, and then measure how many requests exceeded that value. you can think of this as a "latency error budget". 1% of your (projected) traffic is the amount of "slow" requests that you can spend.
  13. Discovering points of failure: Latency "the p99 latency, aggregated over

    10 second intervals, should not go above 500ms for longer than 20 seconds."
  14. Discovering points of failure: More generally 1. Evaluate trends in

    alerts. 2. For significant problems, consider a larger evaluation/retrospective. 3. Consider GA and consumer care input in conjunction with data.
  15. Discovering points of failure: Conclusion The 4 signals: latency, error

    rates, saturation, traffic Meta-monitoring is important Don’t forget batch jobs!
  16. Framework for log levels FATAL: a “shutdown” level problem ERROR:

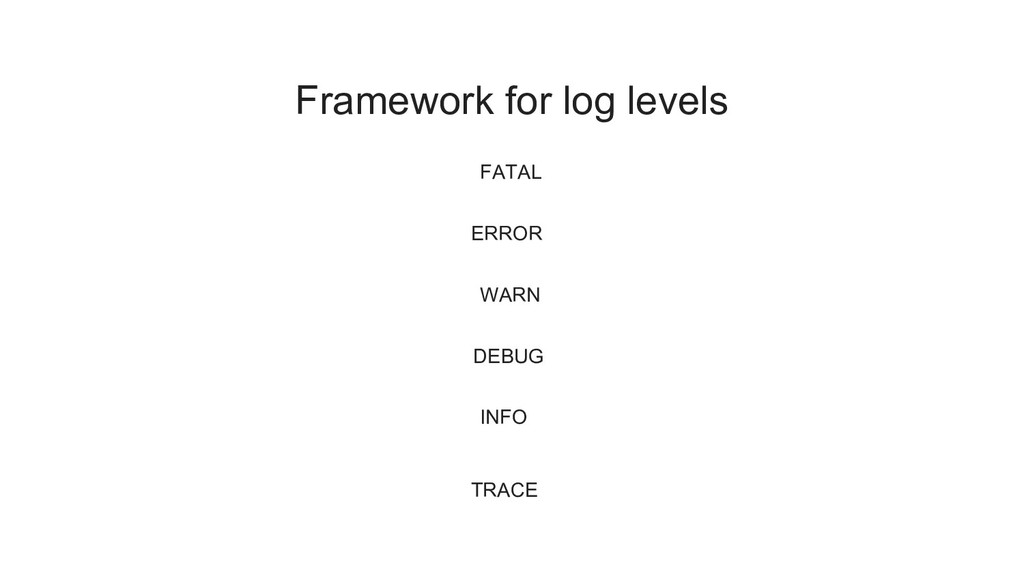
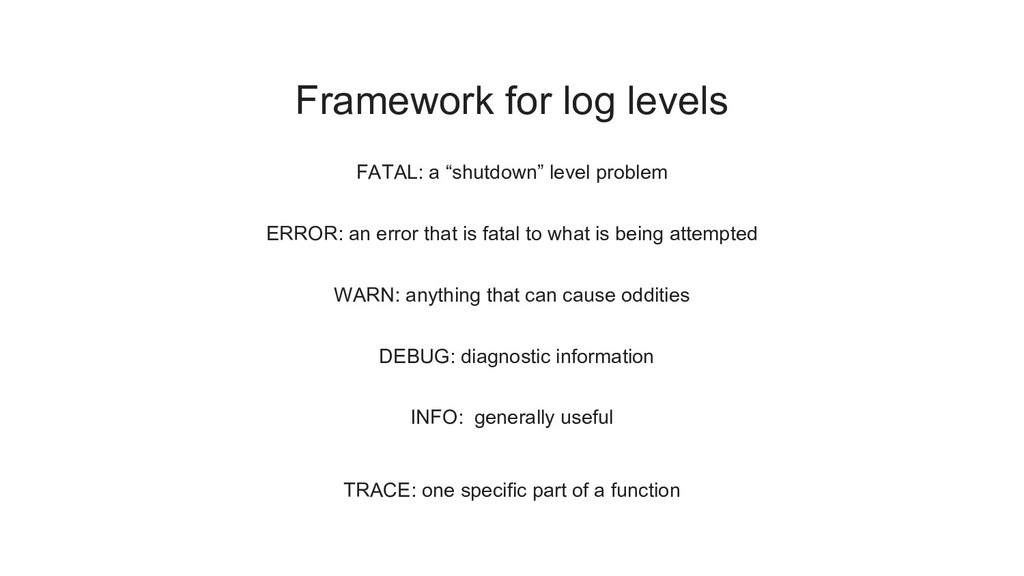
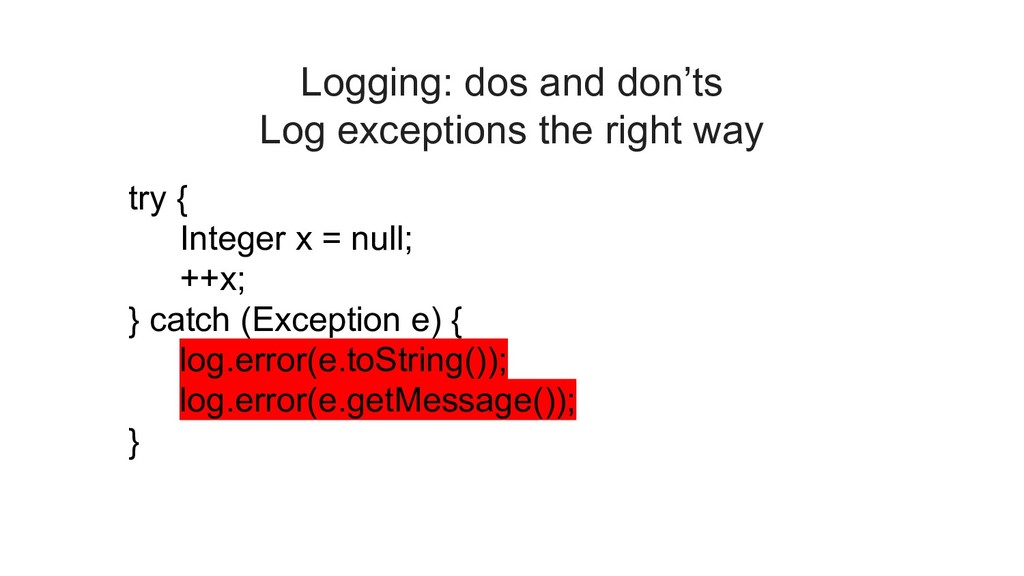
    an error that is fatal to what is being attempted WARN: anything that can cause oddities INFO: generally useful DEBUG: diagnostic information TRACE: one specific part of a function
  17. Logging: dos and don’ts: Avoid side effects try { log.trace("Id="

    + request.getUser().getId() + " accesses " + manager.getPage().getUrl().toString()) } catch(NullPointerException e) { // do something }
  18. Logging: dos and don’ts DO Be concise and descriptive “Availability

    for userid 3939 at 10-19-2018T05:07 returned successfully in AvailabilityByDay.” “Availability returned successfully”
  19. Logging: dos and don’ts DO Log method arguments and return

    values Parameters: zpid: 39393, listingId: 3939 Return value: “true” “true”
  20. Logging: dos and don’ts Consider logging ALL external input if(log.isDebugEnabled())

    { log.debug("Processing ids: {}", requestIds); } else { log.info("Processing ids size: {}", requestIds.size()); }
  21. Logging: dos and don’ts Log exceptions the right way (Java)

    try { Integer x = null; ++x; } catch (Exception e) { log.error(e); }
  22. Logging: dos and don’ts Log exceptions the right way try

    { Integer x = null; ++x; } catch (Exception e) { log.error(e.toString()); log.error(e.getMessage()); }
  23. Logging: dos and don’ts Log exceptions the right way try

    { Integer x = null; ++x; } catch (Exception e) { log.error(e); log.error(e.toString()); log.error(e.getMessage()); log.error("Error reading configuration file: " + e); }
  24. Logging: dos and don’ts Log exceptions the right way try

    { Integer x = null; ++x; } catch (Exception e) { log.error("", e); log.error("Error reading configuration file", e); }
  25. Logging: dos and don’ts Provide context “listingId 399393 returned for

    call to get tour availability from BDP” “listingId 39939”
  26. 30% 45% A note on testing 55% Code Review Integration

    Testing Unit Testing Manual Testing 5-10%
  27. 30% 45% A note on testing 55% Code Review Integration

    Testing Unit Testing Manual Testing 5-10%
  28. Things you might miss Highly segmented failures alerts by segment

    Small buckets of users consumer care “Blips” on the radar threshold alerts
  29. Things you might miss Highly segmented failures alerts by segment

    Small buckets of users consumer care “Blips” on the radar threshold alerts
  30. Why do we care? • Early signs of bigger issues

    • Potentially really bad for a small vocal number (bad for ratings) • Pie in the sky
  31. Kinds of anomalies: • Point anomalies: a single blip •

    Contextual anomalies: bad within context • Collective anomalies: these shouldn’t happen together
  32. Conclusion... Cover your bases with 4 golden signals Be proactive

    about your system Consider anomaly detection for your use case