Upgrade to Pro — share decks privately, control downloads, hide ads and more …

Profiling performance of real world applications

Profiling performance of real world applications

Profiling performance of real world applications presentation for PyAr meetup / May 2015

andresriancho

May 26, 2015
Tweet

More Decks by andresriancho

Other Decks in Programming

Transcript

  1. Memory usage profiling Tools fail to answer these questions without

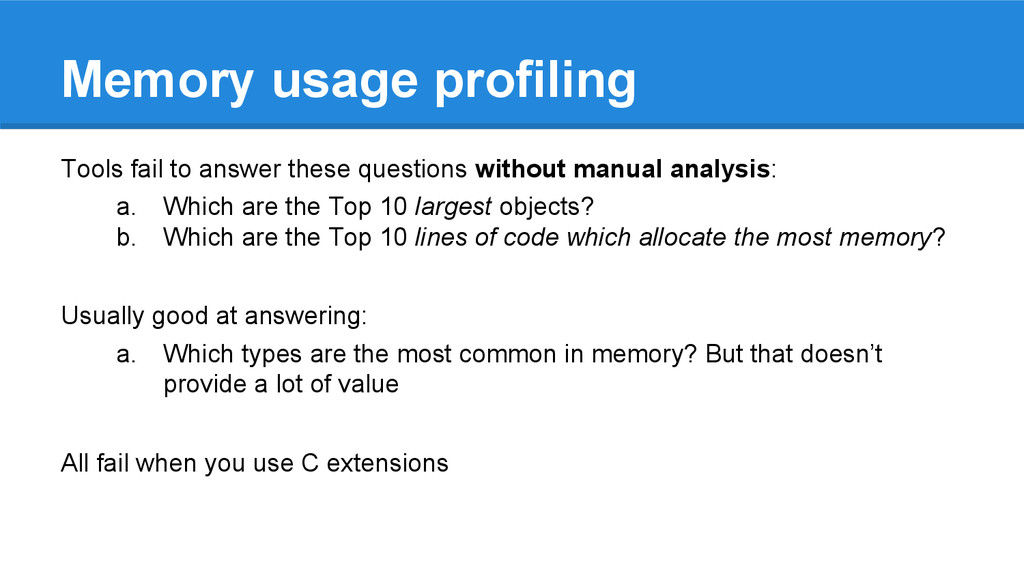
    manual analysis: a. Which are the Top 10 largest objects? b. Which are the Top 10 lines of code which allocate the most memory? Usually good at answering: a. Which types are the most common in memory? But that doesn’t provide a lot of value All fail when you use C extensions
  2. CPU usage profiling Want to answer the question: “Which are

    the Top 10 lines of code which consume most time?” • cProfile doesn’t support threads nor multiprocessing
  3. Dead-locks and key performance indicators When writing code with threads

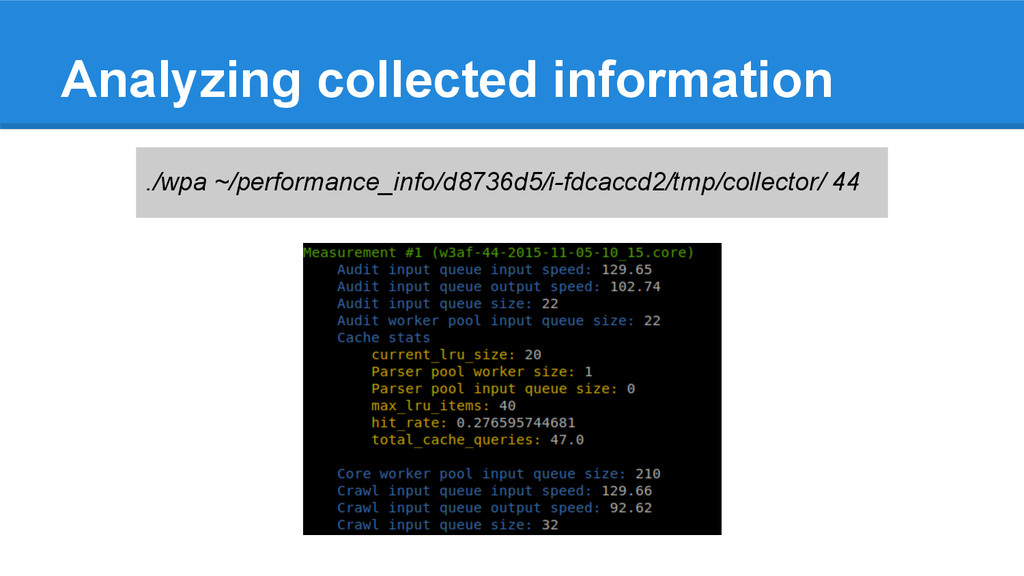
    you’ll inevitably introduce a dead-lock. Sadly, there’s no automated tool to detect dead-locks (more on this later) Each software has key performance indicators, how fast we parse X, how many Y per second are we sending to the network, what’s the size of the internal Queue holding Z, etc. Need to know!
  4. memory_profiler @profile def my_func(): a = [1] * (10 **

    6) b = [2] * (2 * 10 ** 7) del b return a
  5. memory_profiler Line # Mem usage Increment Line Contents ============================================== 3

    @profile 4 5.97 MB 0.00 MB def my_func(): 5 13.61 MB 7.64 MB a = [1] * (10 ** 6) 6 166.20 MB 152.59 MB b = [2] * (2 * 10 ** 7) 7 13.61 MB -152.59 MB del b 8 13.61 MB 0.00 MB return a
  6. Line # Mem usage Increment Line Contents ================================================ 96 20.2

    MiB 0.0 MiB @profile 97 def test(): 104 22.6 MiB 2.3 MiB body = file(OUTPUT_FILE).read() 105 22.6 MiB 0.0 MiB url = URL('http://www.clarin.com.ar/') 106 22.6 MiB 0.0 MiB headers = Headers() 107 22.6 MiB 0.0 MiB headers['content-type'] = 'text/html' 108 22.6 MiB 0.0 MiB response = HTTPResponse(200, body, headers, url, url) 110 90.4 MiB 67.8 MiB p = HTMLParser(response) 111 88.4 MiB -2.0 MiB del p memory_profiler FTW!
  7. 110 90.4 MiB 67.8 MiB p = HTMLParser(response) 111 88.4

    MiB -2.0 MiB del p 112 113 94.8 MiB 6.4 MiB p = HTMLParser(response) 114 94.0 MiB -0.8 MiB del p 115 116 98.7 MiB 4.6 MiB p = HTMLParser(response) 117 98.7 MiB 0.0 MiB del p 118 119 102.6 MiB 3.9 MiB p = HTMLParser(response) 120 102.6 MiB 0.0 MiB del p 121 122 106.5 MiB 3.9 MiB p = HTMLParser(response) 123 106.5 MiB 0.0 MiB del p memory_profiler FTW!
  8. memory_profiler Shortcomings: 1. Impossible to use in real applications, reads

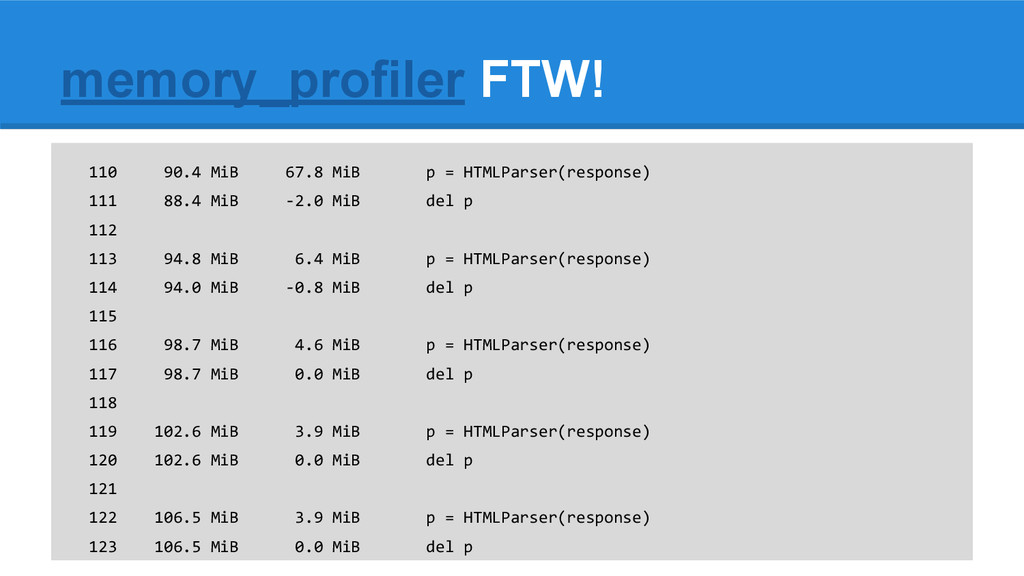
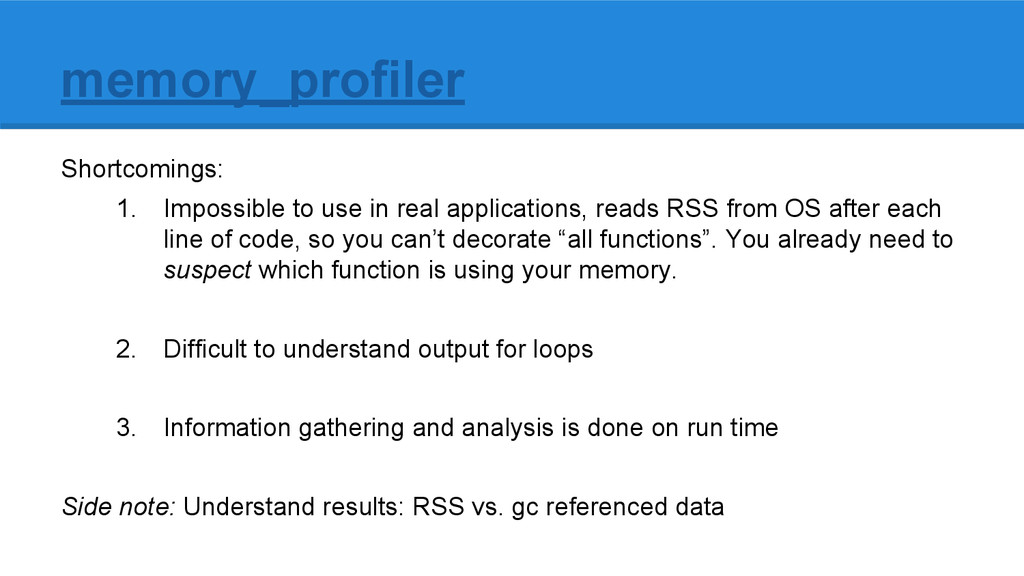
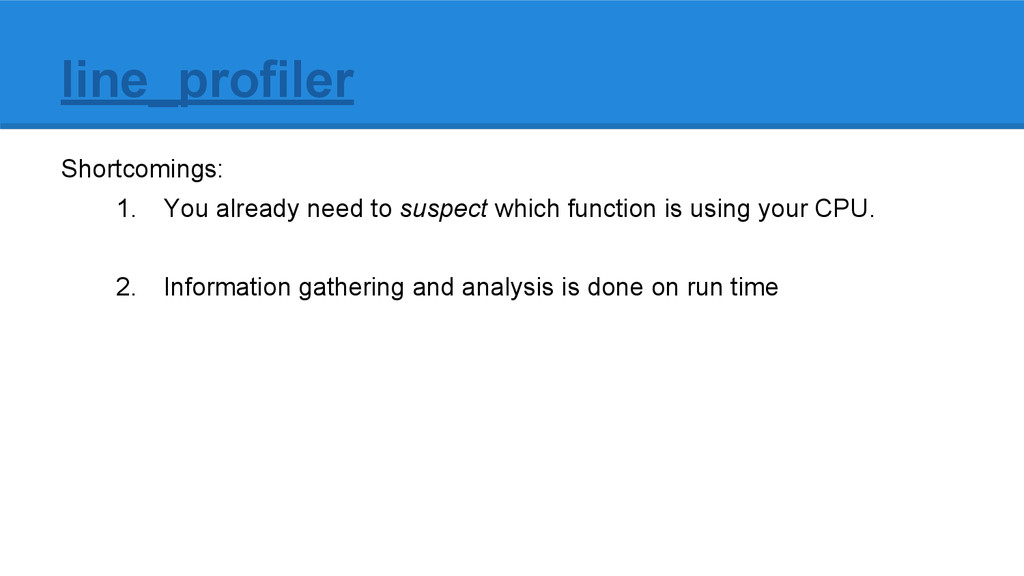
    RSS from OS after each line of code, so you can’t decorate “all functions”. You already need to suspect which function is using your memory. 2. Difficult to understand output for loops 3. Information gathering and analysis is done on run time Side note: Understand results: RSS vs. gc referenced data
  9. objgraph >>> x = [] >>> y = [x, [x],

    dict(x=x)] >>> import objgraph >>> objgraph.show_refs([y], filename='sample-graph.png') Graph written to ....dot (... nodes) Image generated as sample-graph.png
  10. objgraph Shortcomings: 1. Information gathering and analysis is done on

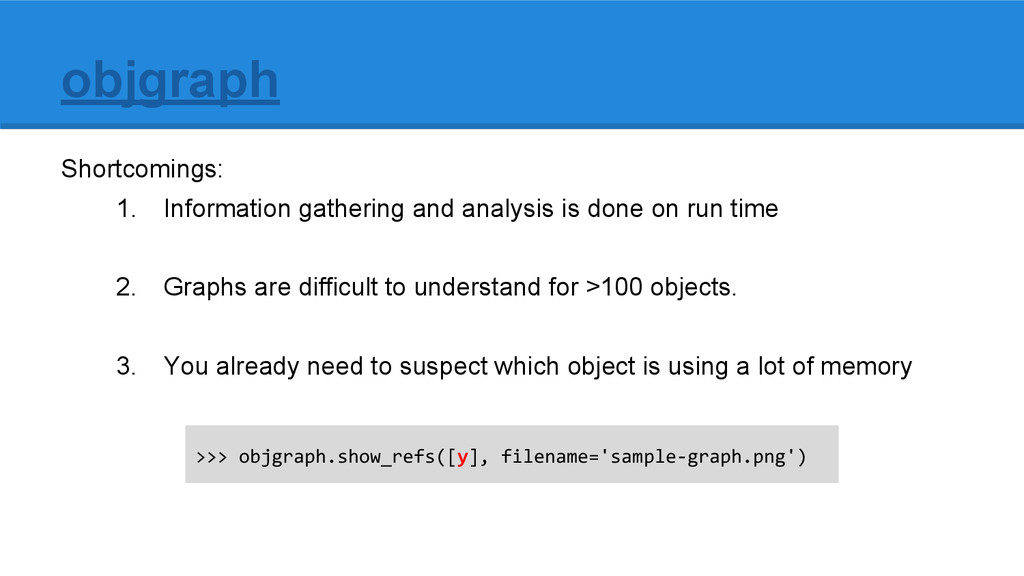
    run time 2. Graphs are difficult to understand for >100 objects. 3. You already need to suspect which object is using a lot of memory >>> objgraph.show_refs([y], filename='sample-graph.png')
  11. line_profiler Line # Hits Time Per Hit % Time Line

    Contents ============================================================== 149 @profile 150 def Proc2(IntParIO): 151 50000 82003 1.6 13.5 IntLoc = IntParIO + 10 152 50000 63162 1.3 10.4 while 1: 153 50000 69065 1.4 11.4 if Char1Glob == 'A': 154 50000 66354 1.3 10.9 IntLoc = IntLoc - 1 155 50000 67263 1.3 11.1 IntParIO = IntLoc - IntGlob 156 50000 65494 1.3 10.8 EnumLoc = Ident1 157 50000 68001 1.4 11.2 if EnumLoc == Ident1: 158 50000 63739 1.3 10.5 break 159 50000 61575 1.2 10.1 return IntParIO
  12. line_profiler Shortcomings: 1. You already need to suspect which function

    is using your CPU. 2. Information gathering and analysis is done on run time
  13. Key recommendations 1. Split information gathering and analysis 2. Measure

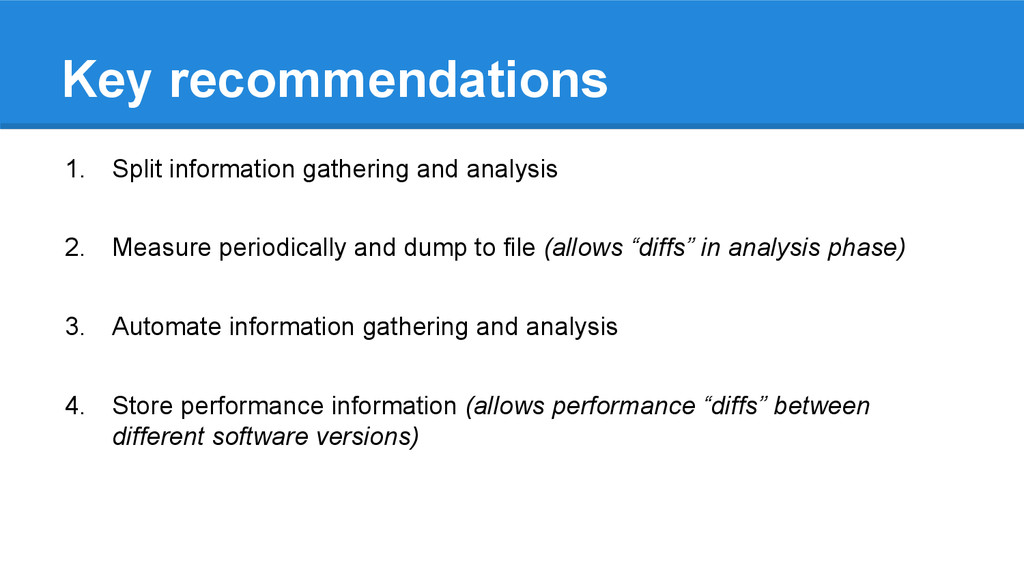
    periodically and dump to file (allows “diffs” in analysis phase) 3. Automate information gathering and analysis 4. Store performance information (allows performance “diffs” between different software versions)
  14. Example run export W3AF_CPU_PROFILING=1 export W3AF_MEMORY_PROFILING=1 export W3AF_CORE_PROFILING=1 export W3AF_THREAD_ACTIVITY=1

    export W3AF_PROCESSES=1 export W3AF_PSUTILS=1 export W3AF_PYTRACEMALLOC=1 ./w3af_console -s /tmp/test-script.w3af
  15. Information gathering: Tools 1. Memory profiling a. meliae b. pytracemalloc

    2. CPU profiling using yappi 3. Get operating system information with psutil: load average, virtual/swap memory, network, processes, etc.
  16. Information gathering: Tools 1. multiprocessing.active_children() returns all the sub-processes created

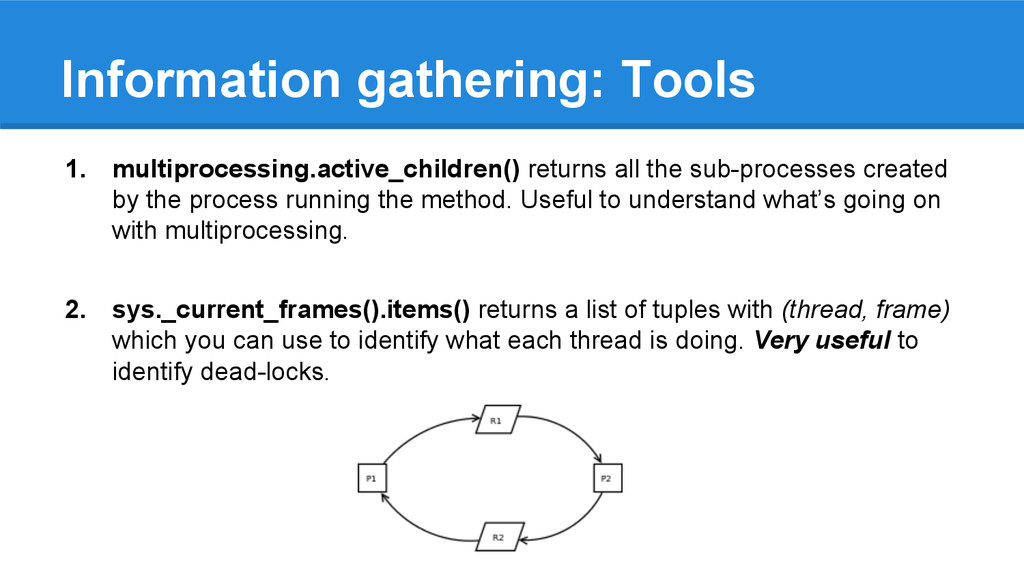
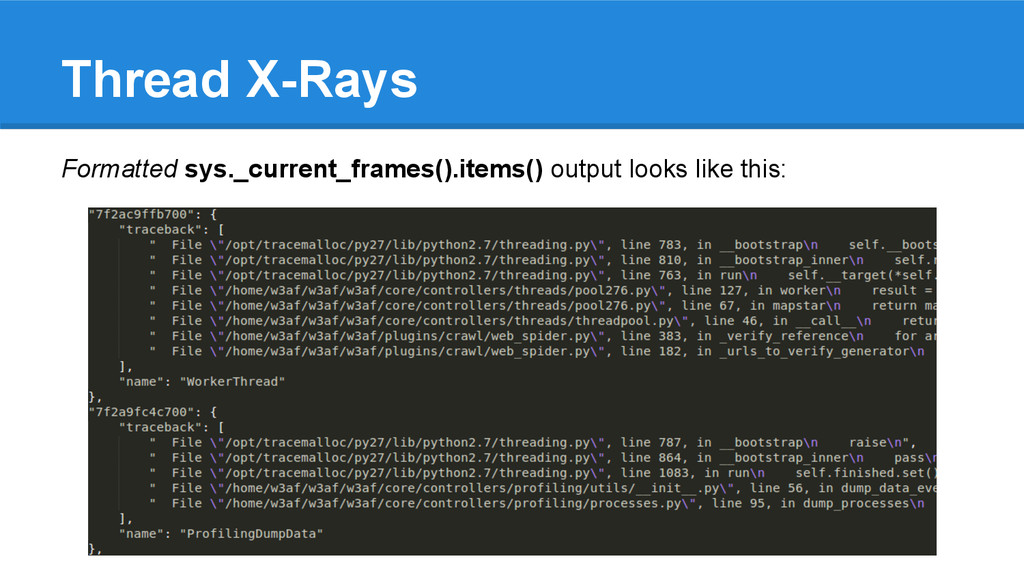
    by the process running the method. Useful to understand what’s going on with multiprocessing. 2. sys._current_frames().items() returns a list of tuples with (thread, frame) which you can use to identify what each thread is doing. Very useful to identify dead-locks.
  17. Collector helps me automate the profiling information gathering: 1. Start

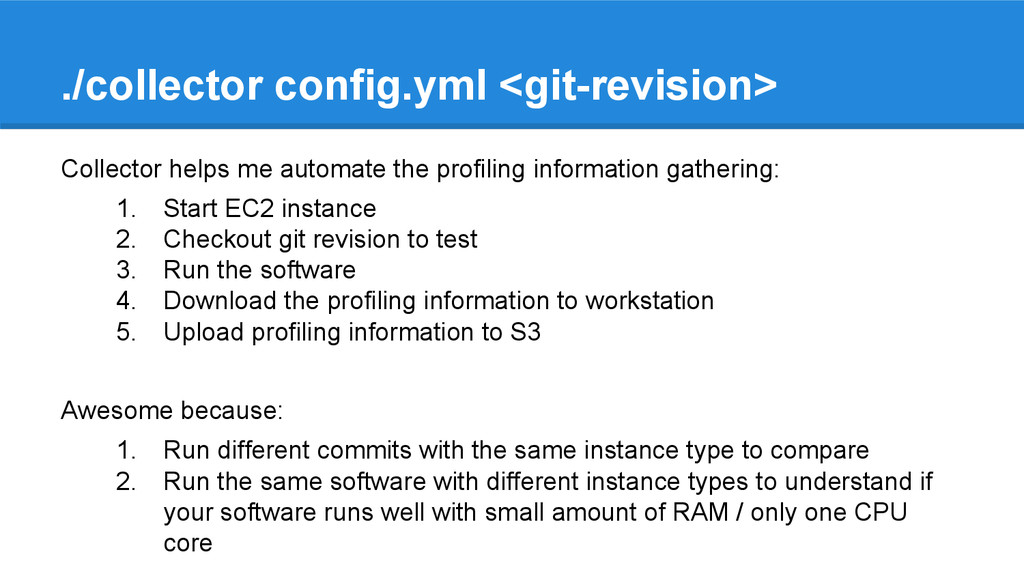
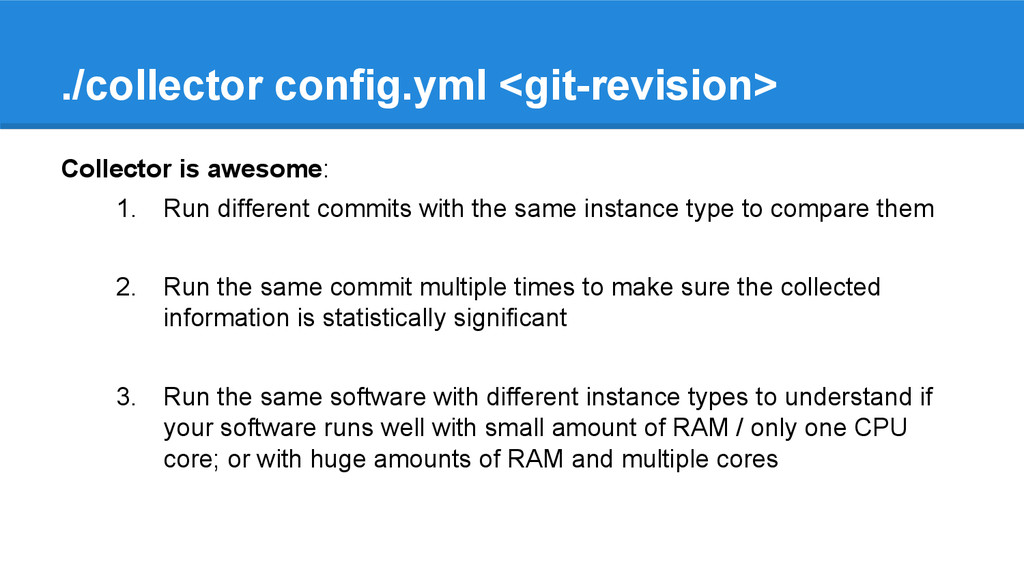
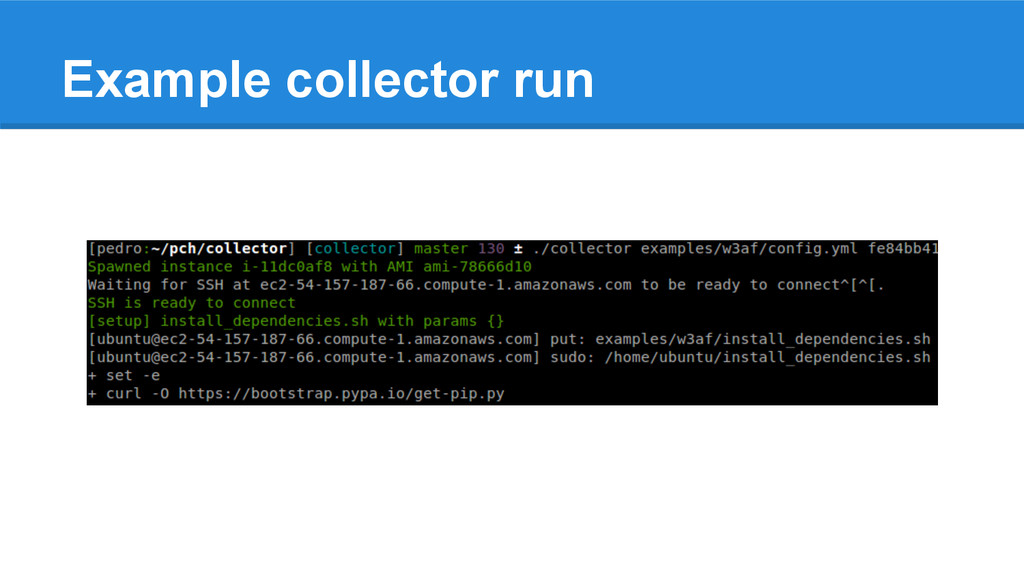
    EC2 instance 2. Checkout git revision to test 3. Run the software 4. Download the profiling information to workstation 5. Upload profiling information to S3 Awesome because: 1. Run different commits with the same instance type to compare 2. Run the same software with different instance types to understand if your software runs well with small amount of RAM / only one CPU core ./collector config.yml <git-revision>
  18. Collector is awesome: 1. Run different commits with the same

    instance type to compare them 2. Run the same commit multiple times to make sure the collected information is statistically significant 3. Run the same software with different instance types to understand if your software runs well with small amount of RAM / only one CPU core; or with huge amounts of RAM and multiple cores ./collector config.yml <git-revision>
  19. main: output: ~/performance_info/ performance_results: /tmp/collector/w3af-* ec2_instance_size: m3.medium security_group: collector keypair:

    collector2 ami: ami-78666d10 user: ubuntu S3: w3af-performance-data Example collector config for w3af
  20. setup: # We want to run w3af inside docker -

    install_dependencies.sh - setup.sh run: # Runs w3af - run_docker.sh: - timeout: 15 - warn_only: true Example collector config for w3af
  21. EC2 instance customization Preparing the instance to run the profiled

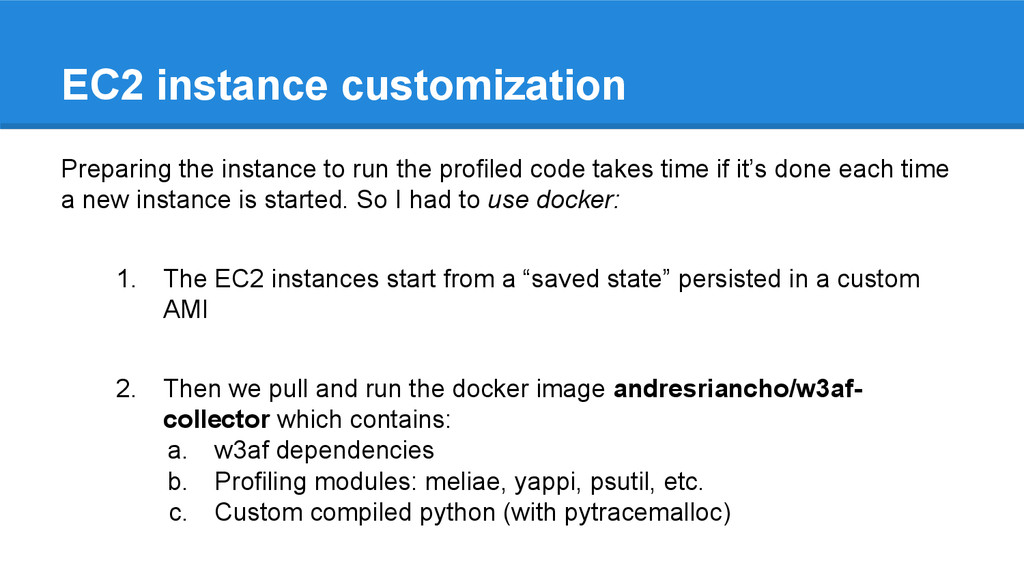
    code takes time if it’s done each time a new instance is started. So I had to use docker: 1. The EC2 instances start from a “saved state” persisted in a custom AMI 2. Then we pull and run the docker image andresriancho/w3af- collector which contains: a. w3af dependencies b. Profiling modules: meliae, yappi, psutil, etc. c. Custom compiled python (with pytracemalloc)
  22. Thread X-Rays Useful to understand what your threaded software is

    doing and identify dead- locks. The analysis is completely manual, but we could hack a small tool which will identify dead-locks in an automated way during the evening.
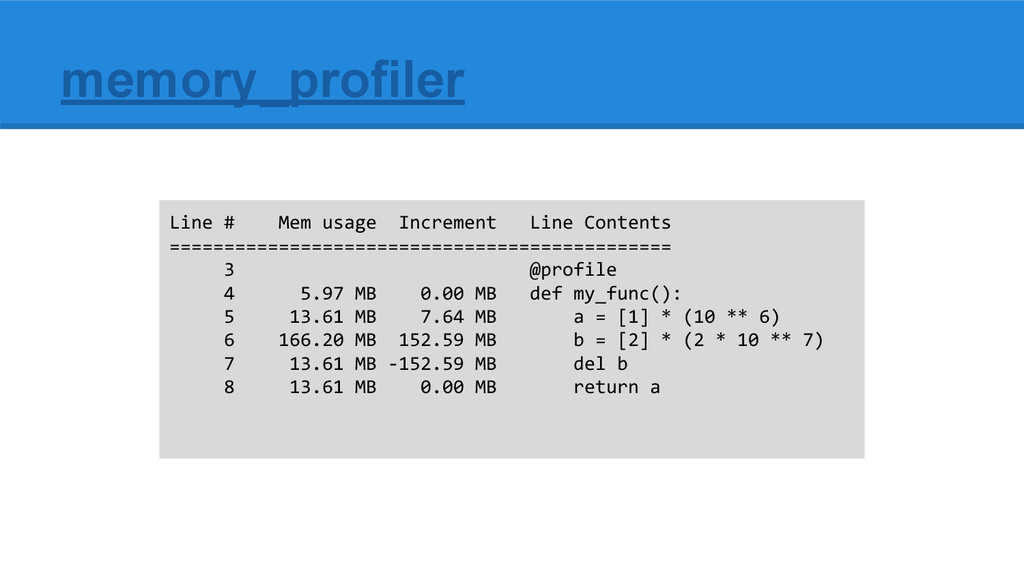