Upgrade to Pro — share decks privately, control downloads, hide ads and more …

Anomaly Detection on Remote Sensing with Ray + Horovod (Linsong Chu, IBM Research)

Anomaly Detection on Remote Sensing with Ray + Horovod (Linsong Chu, IBM Research)

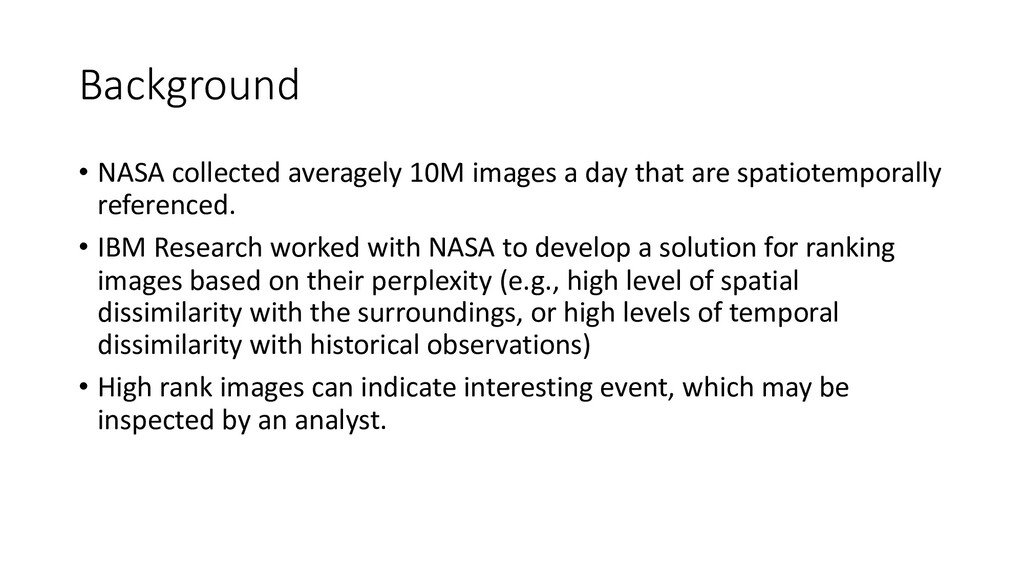
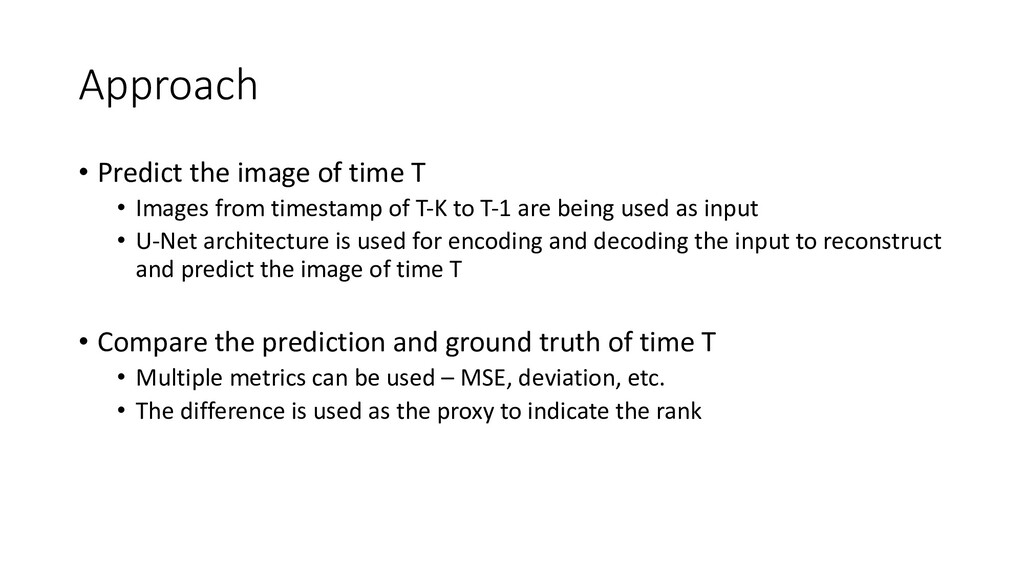
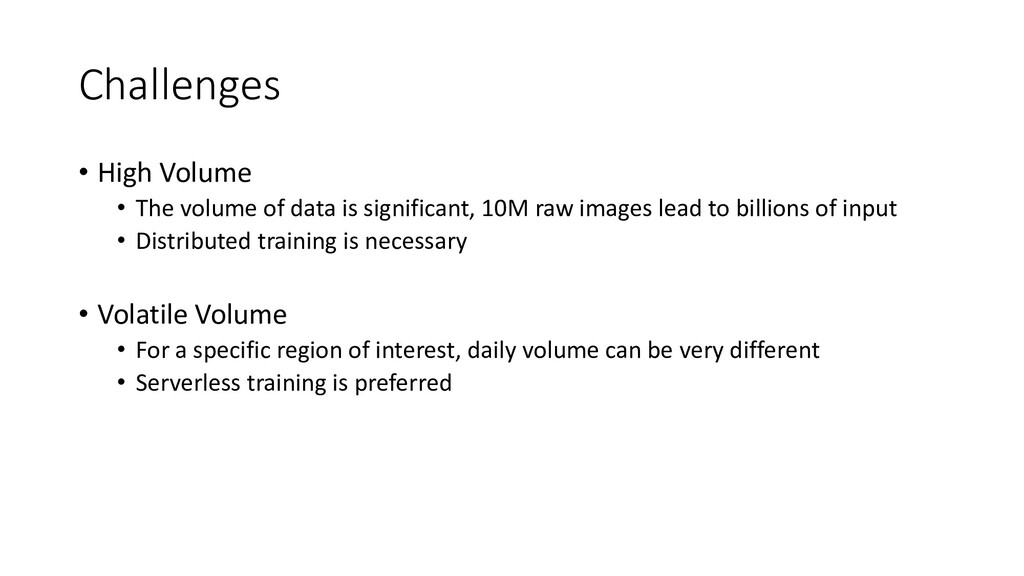
Labeling remote sensing data is crucial for supervised ML/AI in Earth Science, but also very challenging. Manual labeling is not practical as the volume of remote sensing data is tremendous. In this talk, Linsong will show how Ray's distributed learning integration with Horovod can be used to train AI models at scale for identifying "anomalous" regions in an unsupervised manner. Linsong will demonstrate this workflow on a sample application, disaster classification and illustrate it with open source Sentinel satellite data. Ray and Horovod running on IBM's serverless platform Cloud Code Engine enable the scalable learning and inferencing across a few terabytes of raw data. The attendees will be able to see a demo of this end to end workflow on open source datasets.

Anyscale

July 21, 2021
Tweet

More Decks by Anyscale

Other Decks in Technology

Transcript

  1. Background • NASA collected averagely 10M images a day that

    are spatiotemporally referenced. • IBM Research worked with NASA to develop a solution for ranking images based on their perplexity (e.g., high level of spatial dissimilarity with the surroundings, or high levels of temporal dissimilarity with historical observations) • High rank images can indicate interesting event, which may be inspected by an analyst.
  2. A Deadly Debris Flow in India. The image pair above

    shows a closeup of the same area before and after the debris flow, on January 20 and February 21, 2021 https://earthobservatory.nasa.gov/images/147973/a-deadly-debris-flow-in-india
  3. Approach • Predict the image of time T • Images

    from timestamp of T-K to T-1 are being used as input • U-Net architecture is used for encoding and decoding the input to reconstruct and predict the image of time T • Compare the prediction and ground truth of time T • Multiple metrics can be used – MSE, deviation, etc. • The difference is used as the proxy to indicate the rank
  4. Challenges • High Volume • The volume of data is

    significant, 10M raw images lead to billions of input • Distributed training is necessary • Volatile Volume • For a specific region of interest, daily volume can be very different • Serverless training is preferred
  5. Examples of Anomalies detected I - NDVI (Vegetation Index) Data

    is used - Validated as Woolsey wildfire