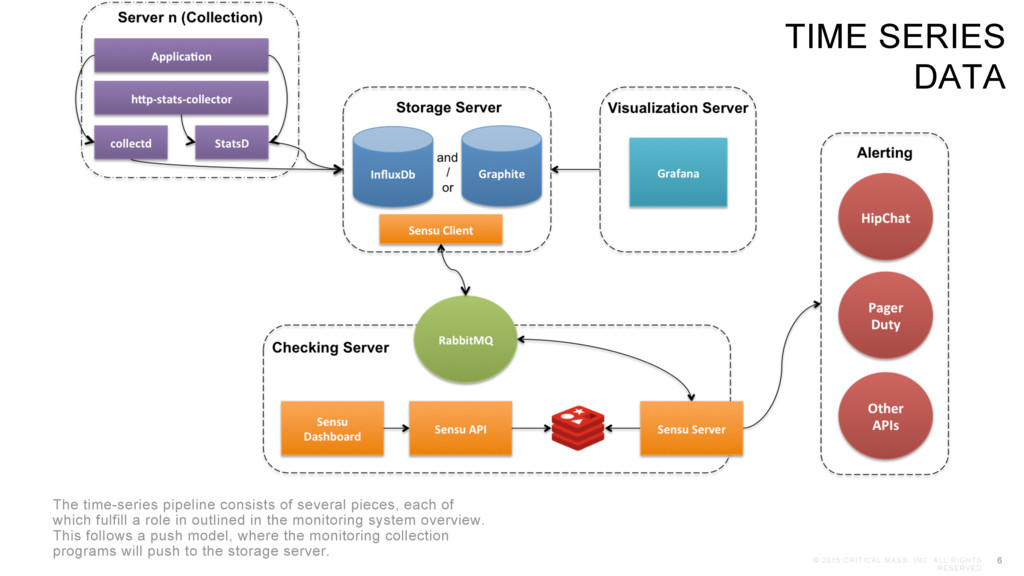
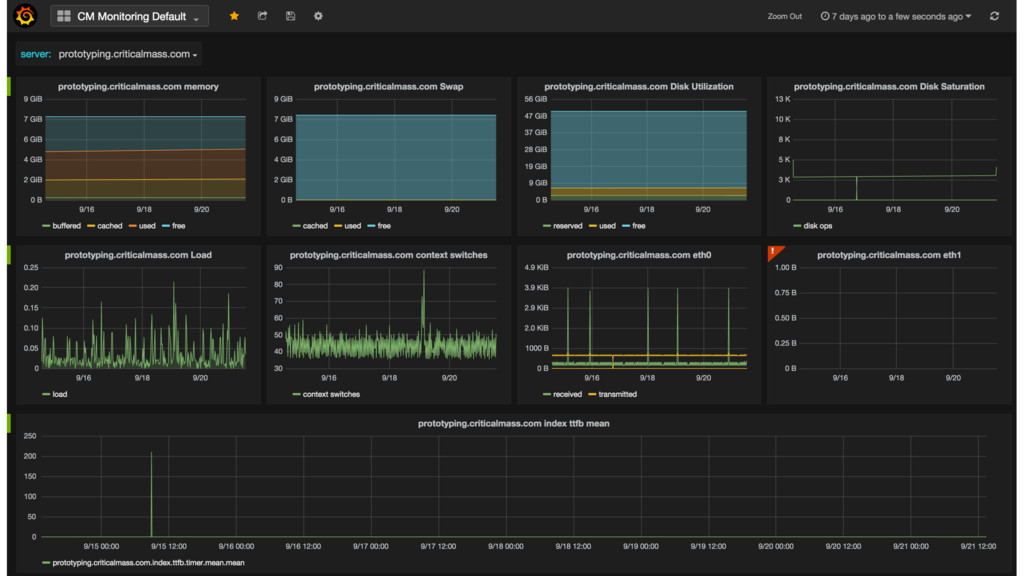
time-series pipeline consists of several pieces, each of which fulfill a role in outlined in the monitoring system overview. This follows a push model, where the monitoring collection programs will push to the storage server. TIME SERIES DATA
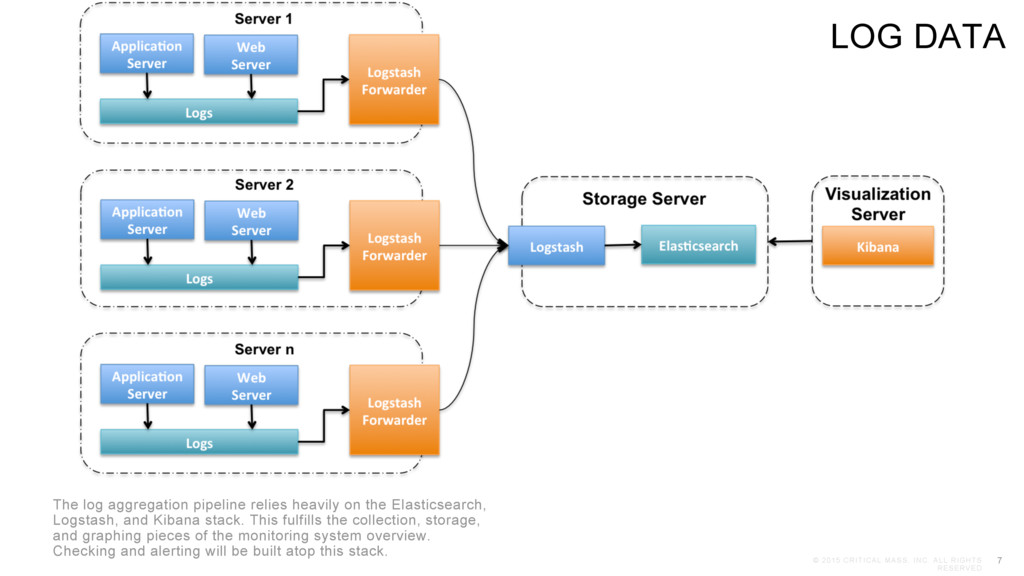
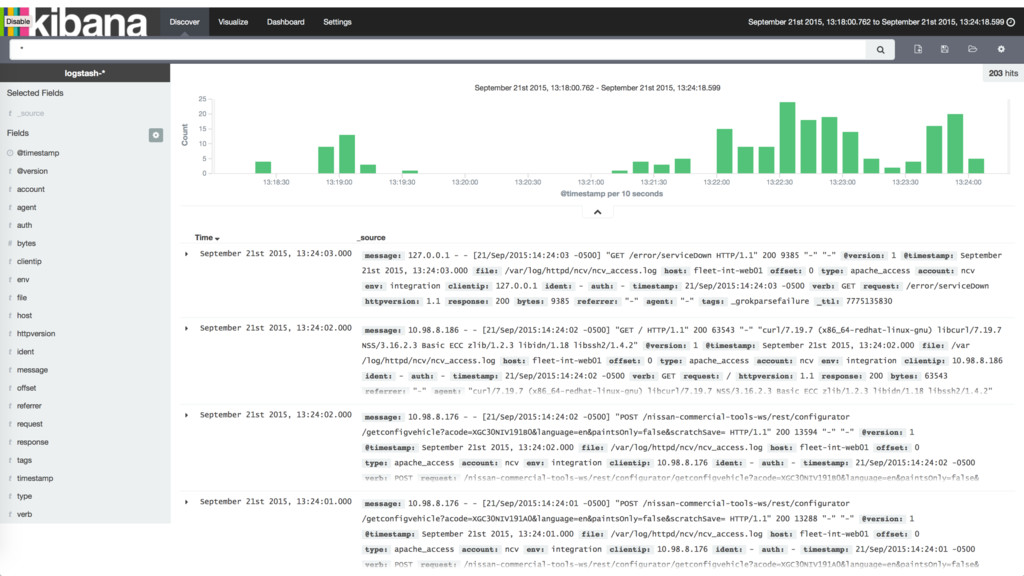
log aggregation pipeline relies heavily on the Elasticsearch, Logstash, and Kibana stack. This fulfills the collection, storage, and graphing pieces of the monitoring system overview. Checking and alerting will be built atop this stack. LOG DATA
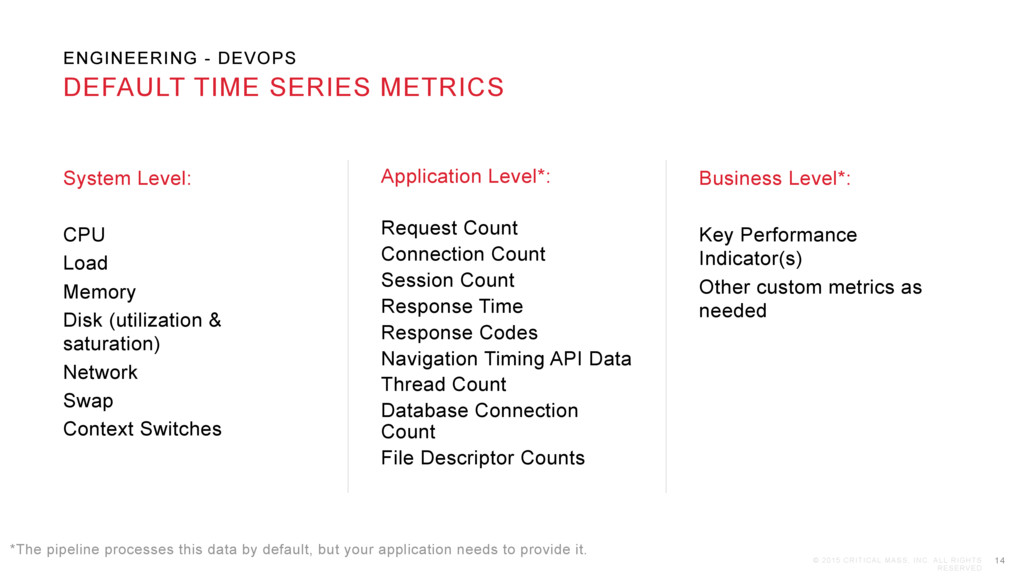
CPU Load Memory Disk (utilization & saturation) Network Swap Context Switches Application Level*: Request Count Connection Count Session Count Response Time Response Codes Navigation Timing API Data Thread Count Database Connection Count File Descriptor Counts Business Level*: Key Performance Indicator(s) Other custom metrics as needed 14 DEFAULT TIME SERIES METRICS ENGINEERING - DEVOPS *The pipeline processes this data by default, but your application needs to provide it.
Lots of Dependencies - Used to take several days to set up. Onboarding was not easy - Different developers used to have slightly different environments - Code works on dev’s machine, not on integration server. AEM DEVELOPMENT ENVIRONMENT SETUP
It takes time initially to code everything but it pays off in the long run. - You do not need monitoring intelligence every day, but this will save your time when you need it most - You need to put effort to spread the use of these new tools. People might not be using it first, but once they know about these, they will love you. - Pick your automation project carefully, work with the people who are suffering from the lack of it and figure their preferences and style of working LEARNINGS ENGINEERING - DEVOPS