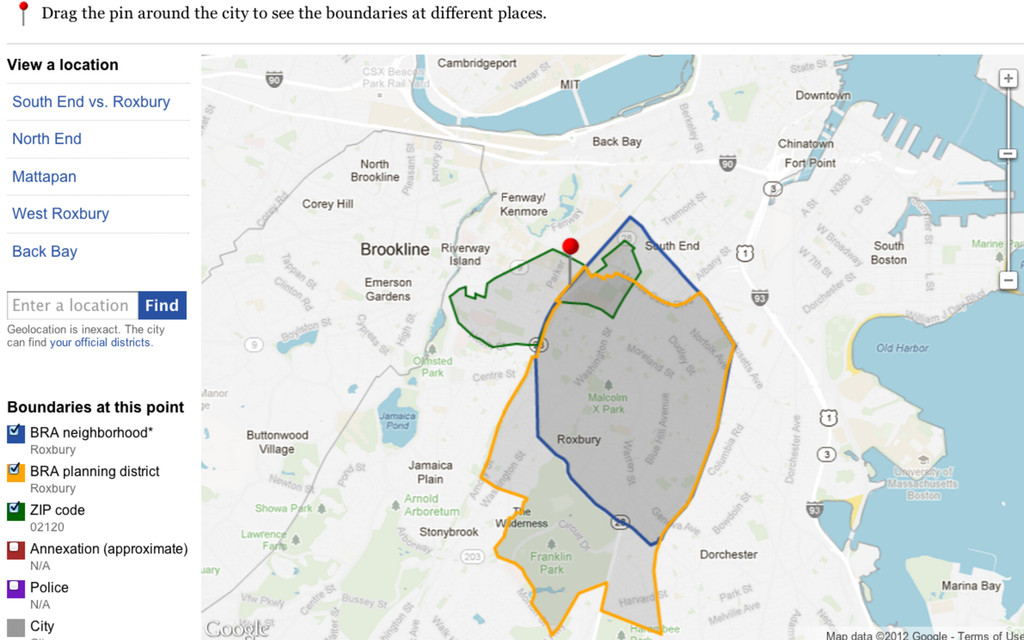
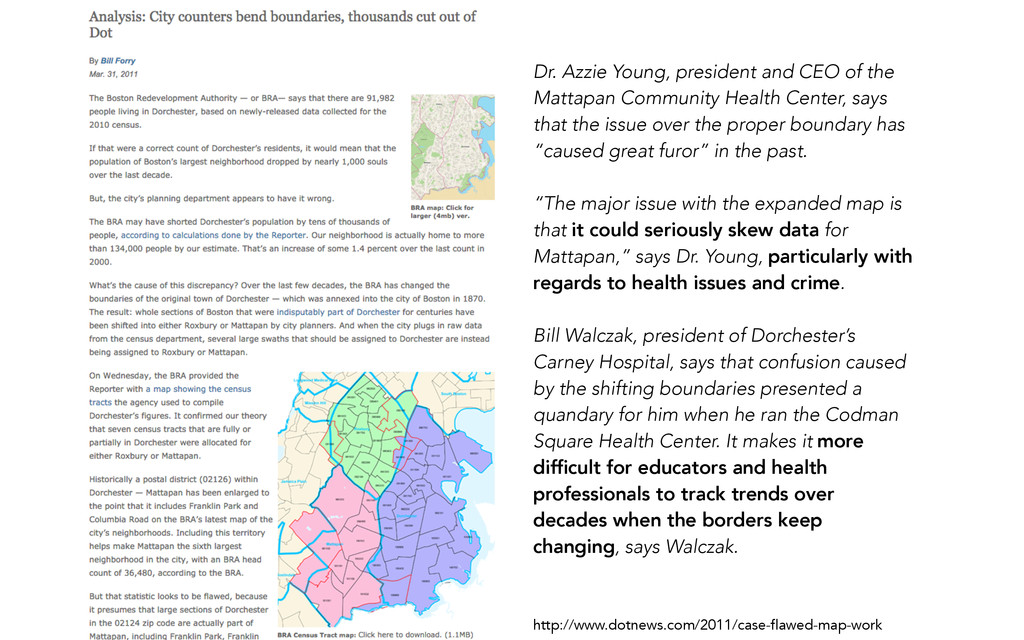
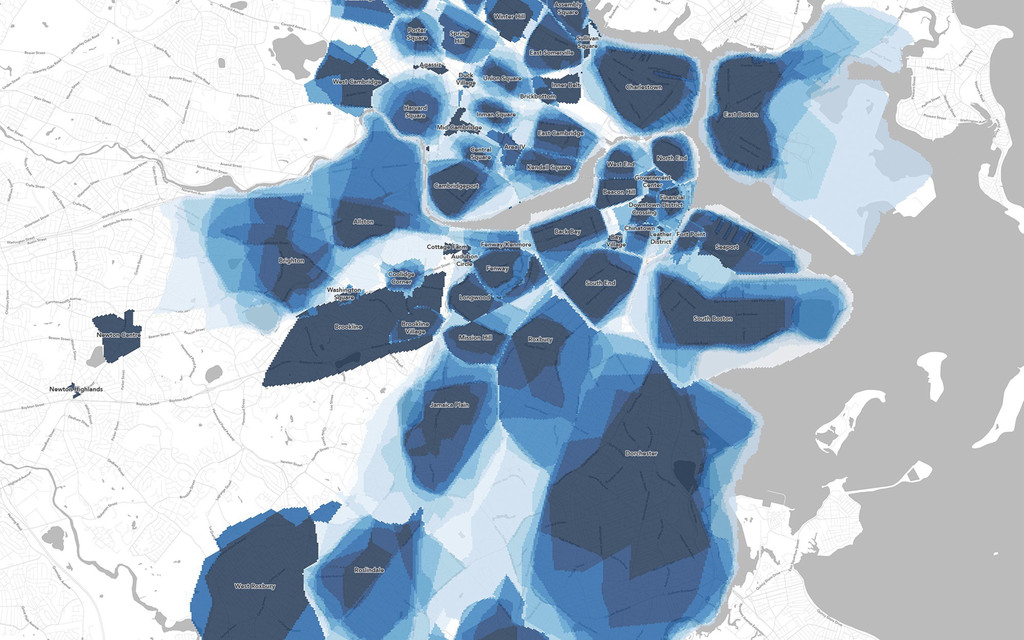
Health Center, says that the issue over the proper boundary has “caused great furor” in the past. “The major issue with the expanded map is that it could seriously skew data for Mattapan,” says Dr. Young, particularly with regards to health issues and crime. Bill Walczak, president of Dorchester’s Carney Hospital, says that confusion caused by the shifting boundaries presented a quandary for him when he ran the Codman Square Health Center. It makes it more difficult for educators and health professionals to track trends over decades when the borders keep changing, says Walczak. http://www.dotnews.com/2011/case-flawed-map-work
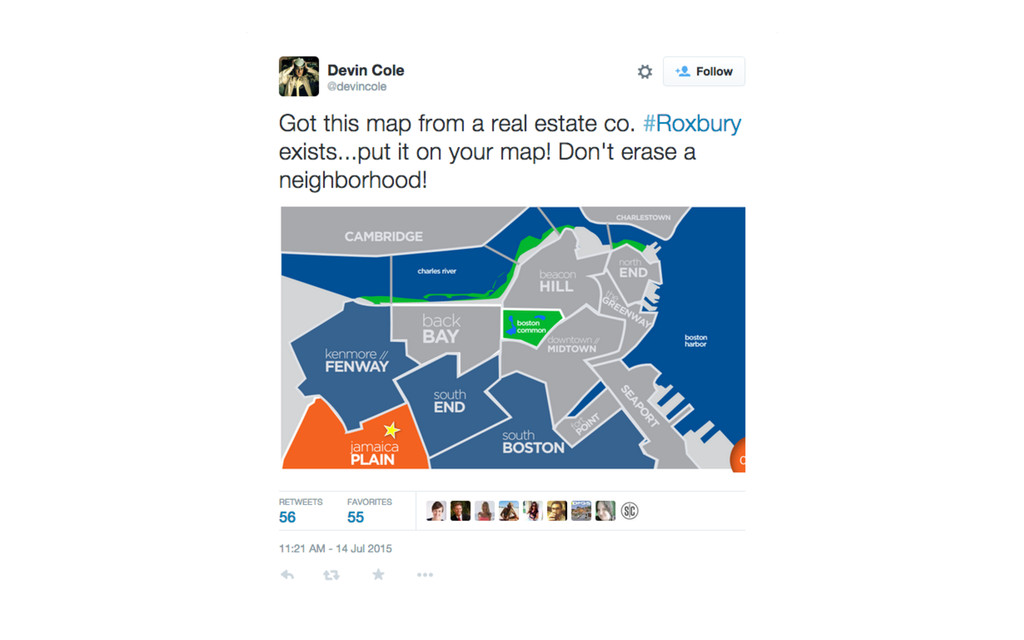
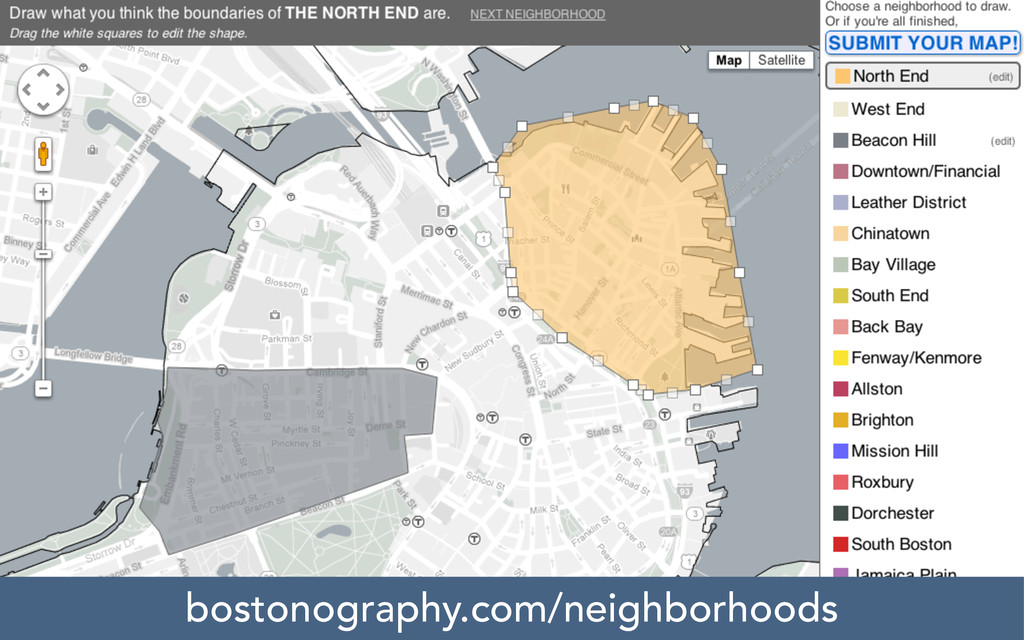
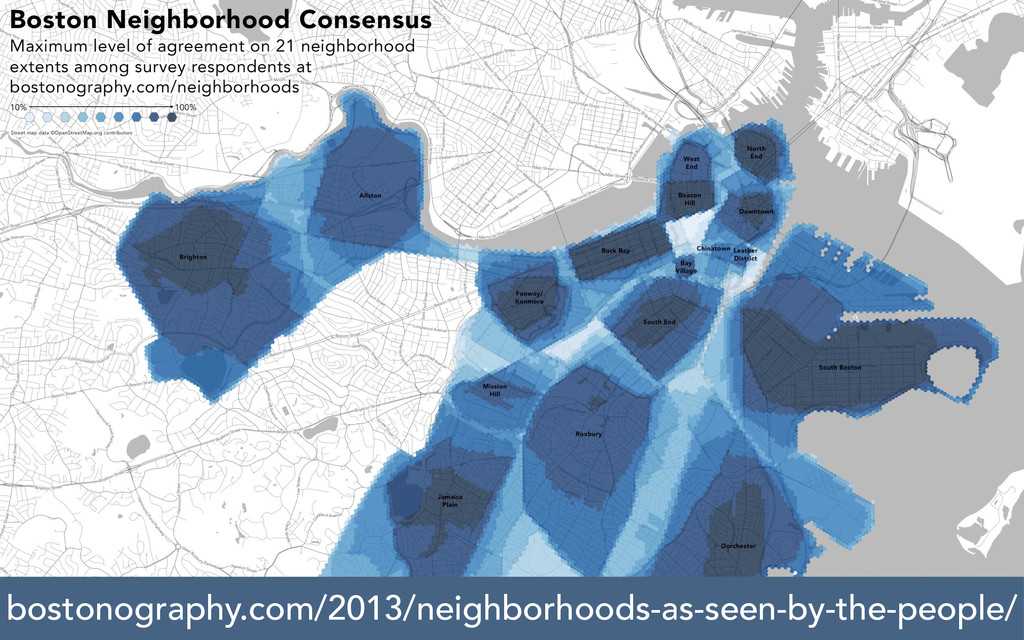
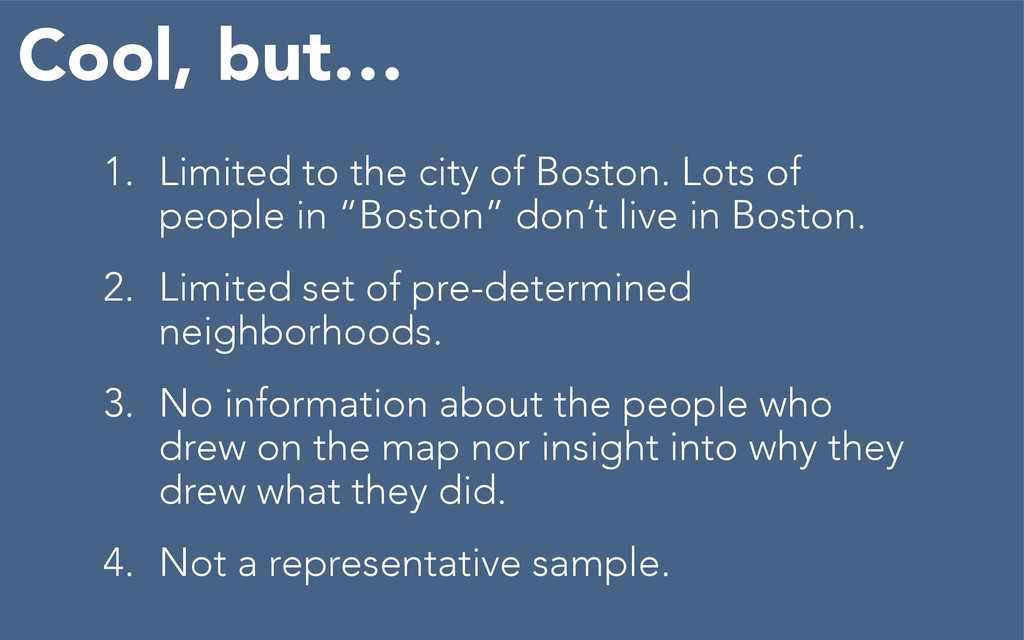
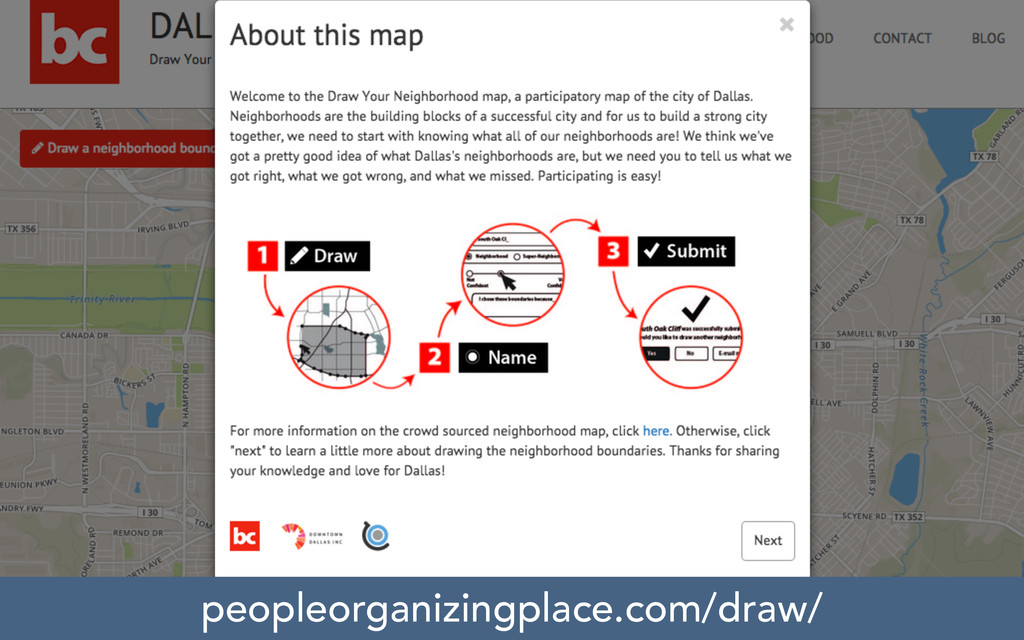
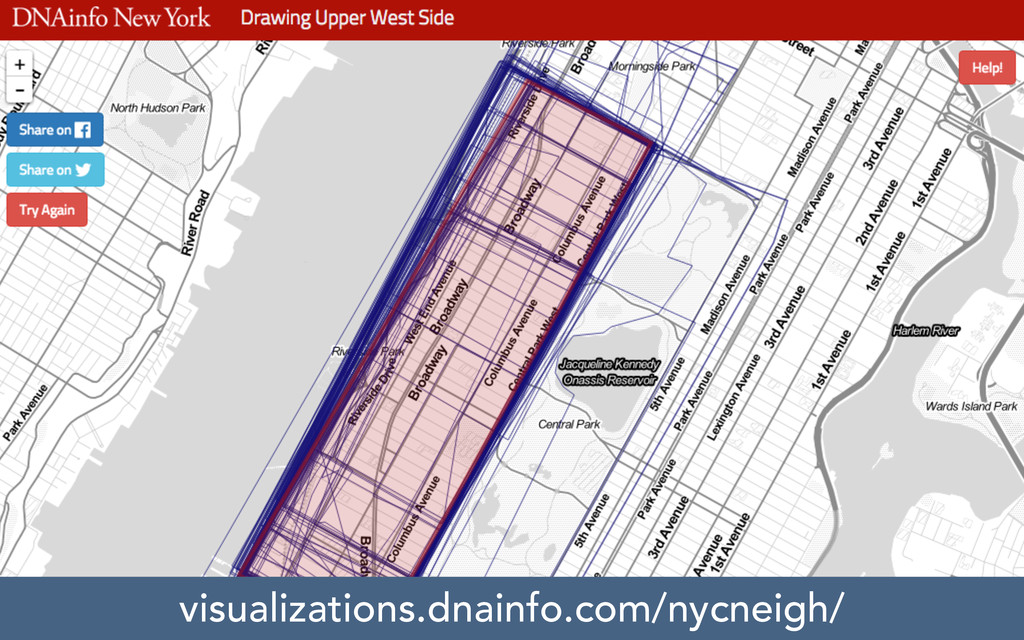
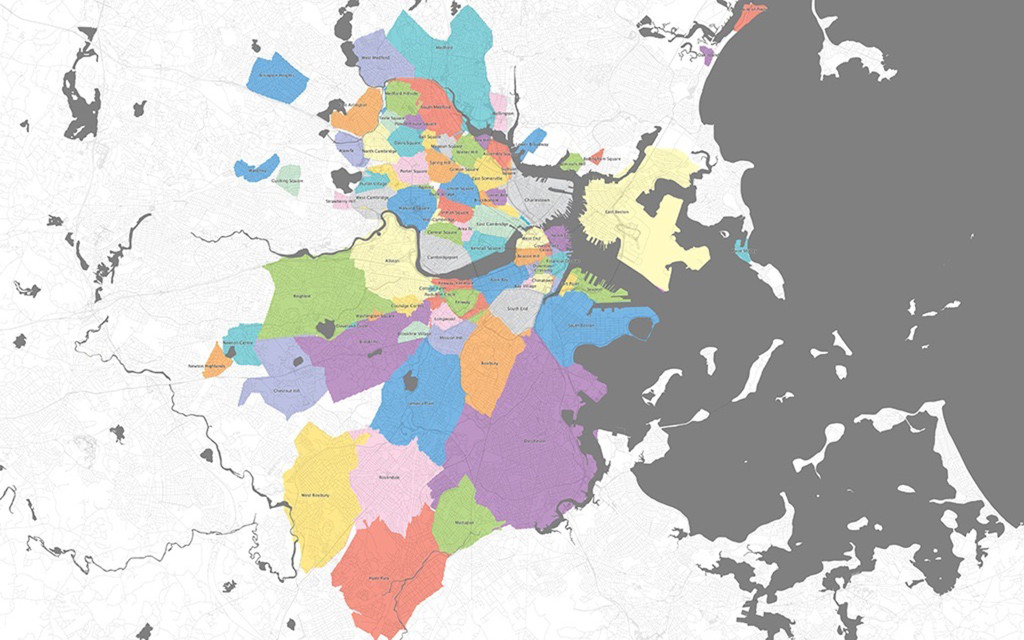
in “Boston” don’t live in Boston. 2. Limited set of pre-determined neighborhoods. 3. No information about the people who drew on the map nor insight into why they drew what they did. 4. Not a representative sample. Cool, but…
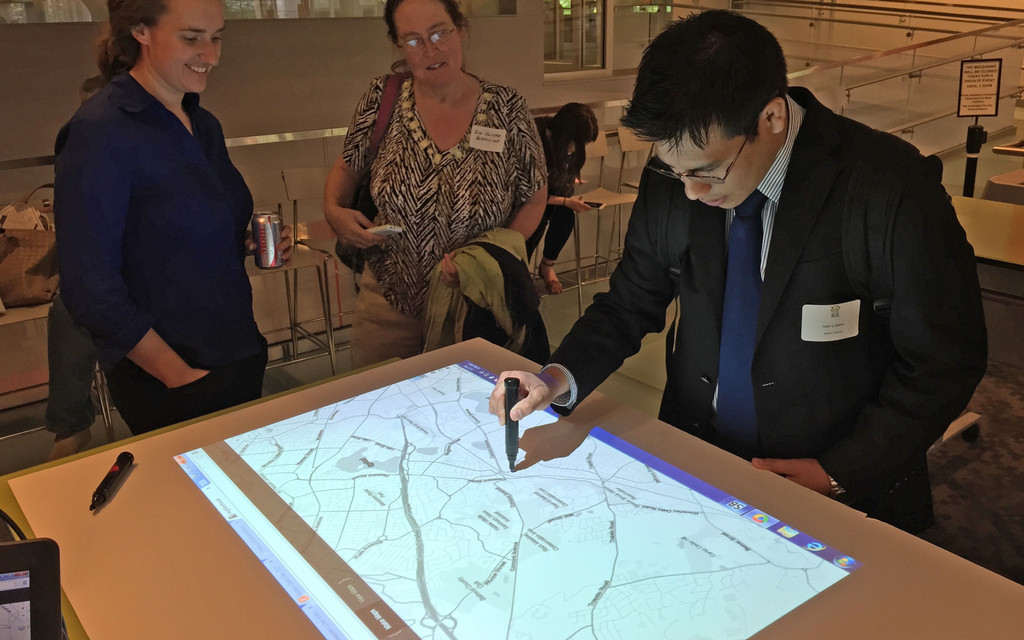
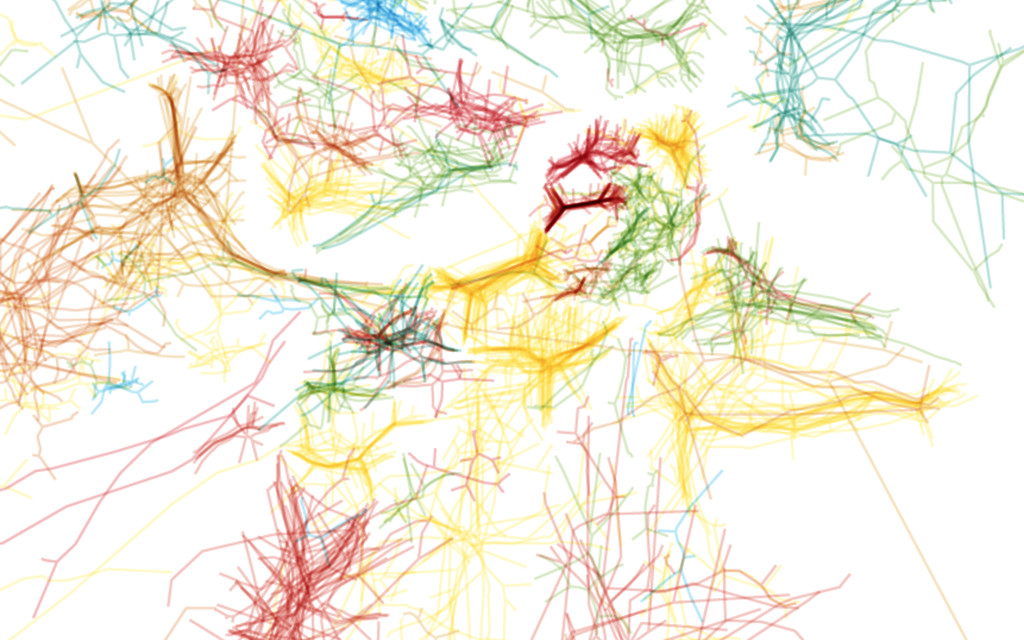
points that are central or important to neighborhoods. Participants are now invited either to draw shapes or to place markers—or both! More than boundaries
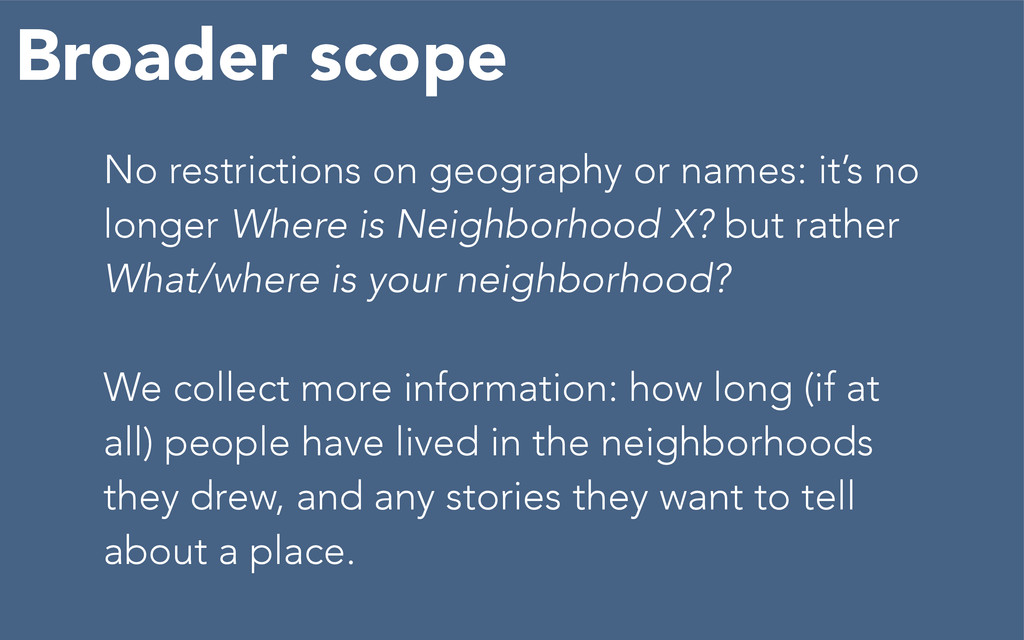
is Neighborhood X? but rather What/where is your neighborhood? We collect more information: how long (if at all) people have lived in the neighborhoods they drew, and any stories they want to tell about a place. Broader scope