Upgrade to Pro — share decks privately, control downloads, hide ads and more …

GABC2018: Mastering IoT Hub, Azure Stream Analy...

GABC2018: Mastering IoT Hub, Azure Stream Analytics and Power BI by Matthias Gessenay

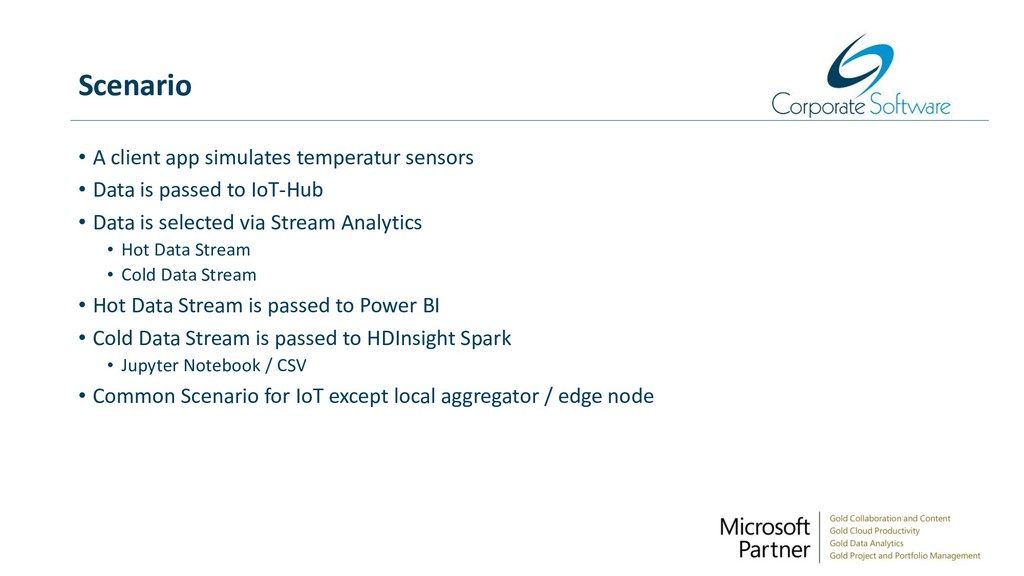
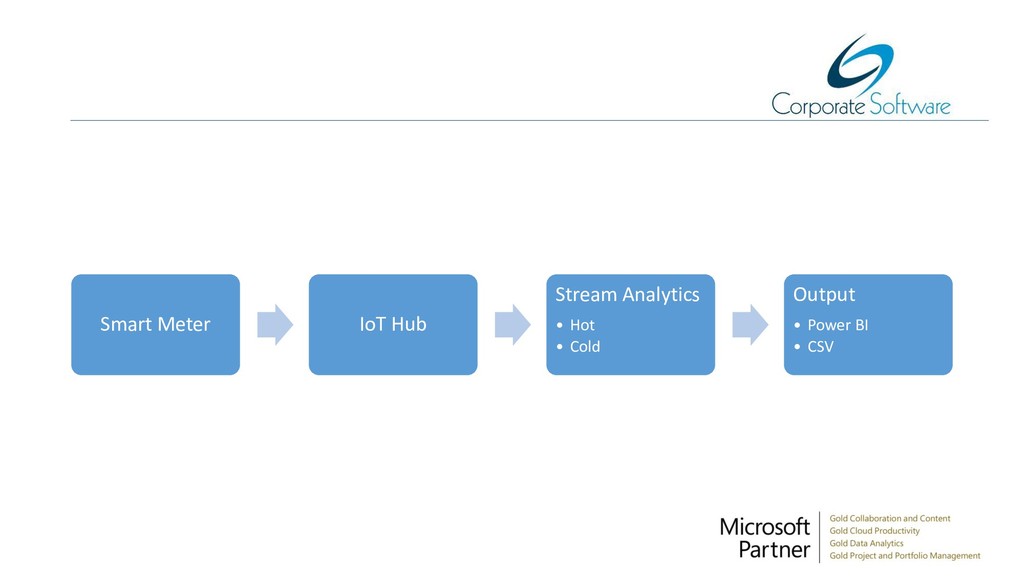
In this demo packed session we will connect a software based Smart Meter to the Azure IoT Hub, feed and transform data with Stream analytics – hot and cold data stream – and display the results in Power BI, both direct through Stream Analytics and Apache Spark. This will show you the end to end design of a typical IoT scenario.

Avatar for Azure Zurich User Group

Azure Zurich User Group

April 21, 2018
Tweet

More Decks by Azure Zurich User Group

Other Decks in Programming

Transcript

  1. Matthias Gessenay • Senior Consultant @ Corporate Software • MPP

    Data Science, Cloud Administration • Various MCSA/E • MCT • Focus on Azure • [email protected] • LinkedIn: https://www.linkedin.com/matthias-gessenay
  2. Agenda • IoT in Azure • Technical Fundamentals • IoT

    Hub • IoT Central • IoT Sphere • The Scenario
  3. IoT now? • Technology is not that new (device connection)

    • But ... • Hardware is small and cheap • Connection is available • Big Data Processing is possible
  4. IoT Hub • Up to 10 million devices • Telemetry

    ingestion • Bi-directional device <-> cloud • Device Twins • Command & control • Device registry & identity • HTTP/AMQP/AMQP-WS/MQTT • Extensible protocol support • Operations Monitoring
  5. HDInsight • Hadoop as PaaS • Map / Reduce •

    Head and Worker Nodes • Apache Spark • In Memory Processing • Used as cold data stream
  6. Stream Analytics • On-demand real-time analytics service • Complex Event

    Processing (CEP) • Pay per Job • Interface to Power BI • SQL Like Query Language
  7. Power BI • SaaS BI Dashboards • Inline Filtering •

    Very capable ETL Engine • Hybrid Connectors • Extensible Graphics • R Support • Support for live data streams
  8. Jupyter • «OneNote for Data Scientists» • Supports Code Execution

    with Kernels • Interactive elements • Capable of R
  9. Scenario • A client app simulates temperatur sensors • Data

    is passed to IoT-Hub • Data is selected via Stream Analytics • Hot Data Stream • Cold Data Stream • Hot Data Stream is passed to Power BI • Cold Data Stream is passed to HDInsight Spark • Jupyter Notebook / CSV • Common Scenario for IoT except local aggregator / edge node