Upgrade to Pro — share decks privately, control downloads, hide ads and more …

Optimizing performance of Phoenix apps

Optimizing performance of Phoenix apps

My presentation at Braga BEAM User Group meetup in October 2023

More Decks by Bernardo Dornellas Cysneiros Gomes de Amorim

Other Decks in Programming

Transcript

  1. “I made this one longer only because I did not

    have the leisure to make it shorter.” BLAISE PASCAL
  2. Used Tools • • • • • • • •

    • • • • • • Environment Setup Toxiproxy - Network Latency K6 - Load Generation / Testing Ballerina Lang - Created "microservices" for testing Observability Grafana Grafana Tempo Prometheus Elixir Profiling & Benchmark fprof + erlgrind + gprof2dot + dot eflambe + speedscope Database Profiling Postgres' EXPLAIN PEV2
  3. A 3-tiered application using Postgres, Ecto, LiveView (or maybe just

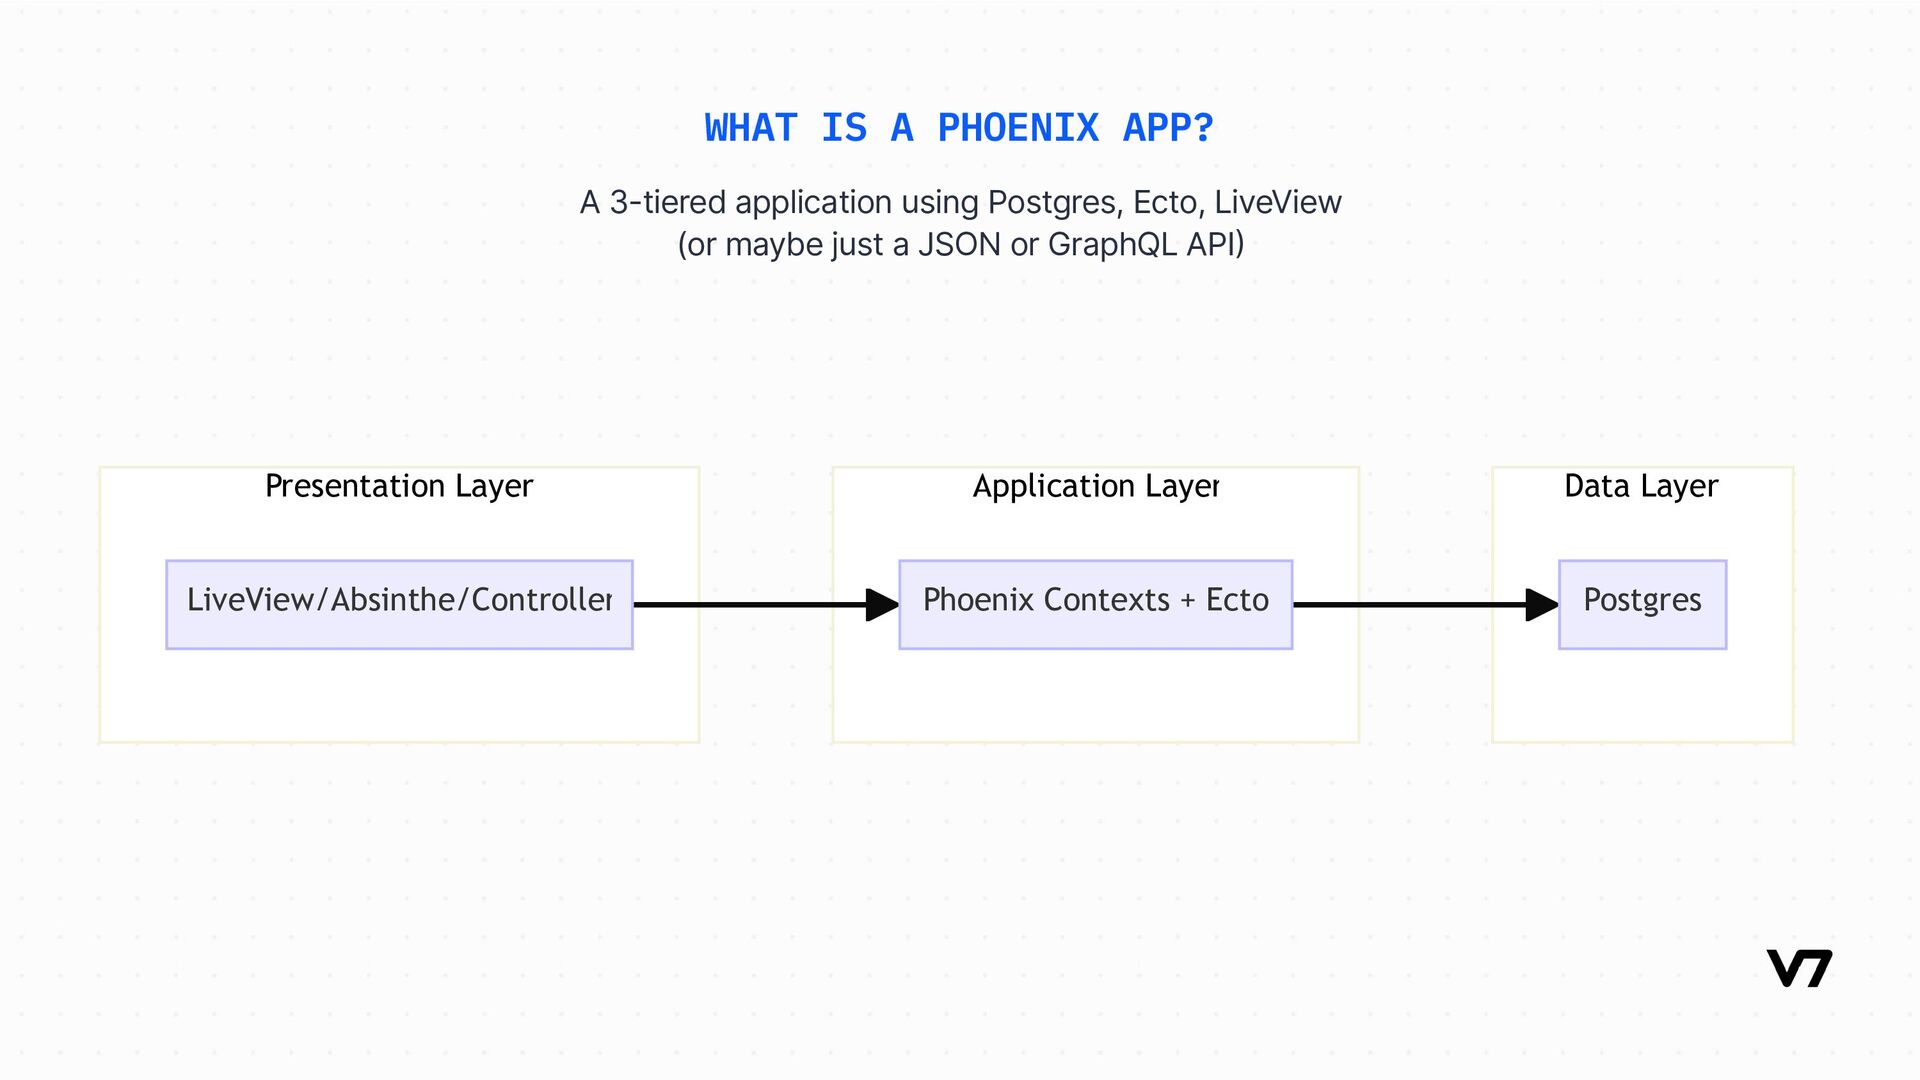
    a JSON or GraphQL API) WHAT IS A PHOENIX APP? Data Layer Application Layer Presentation Layer Postgres Phoenix Contexts + Ecto LiveView/Absinthe/Controller
  4. OUR DEMO APP: MODEL posts BIGSERIAL id VARCHAR title TEXT

    content BIGINT topic_id TIMESTAMP inserted_at TIMESTAMP updated_at topics BIGSERIAL id VARCHAR name BIGINT parent_id TIMESTAMP inserted_at TIMESTAMP updated_at post_contributors BIGSERIAL id BIGINT post_id BIGINT user_id BOOLEAN author users BIGSERIAL id CITEXT email VARCHAR hashed_password TIMESTAMP confirmed_at TIMESTAMP inserted_at TIMESTAMP updated_at users_tokens BIGSERIAL id BIGINT user_id BYTEA token VARCHAR context VARCHAR sent_to TIMESTAMP inserted_at topic_id post_id user_id user_id parent_id
  5. PERFORMANCE IMPROVEMENT LIFE CYCLE DISCOVERY PROFILE OPTIMIZE • • User

    Reports Monitoring • • • Distributed Tracing Lang/VM specific tools EXPLAIN ANALYZE • • • Batching / Preloading Database Indexes Faster Algorithms
  6. • • Unified observability standards and SDKs Combines metrics, logs,

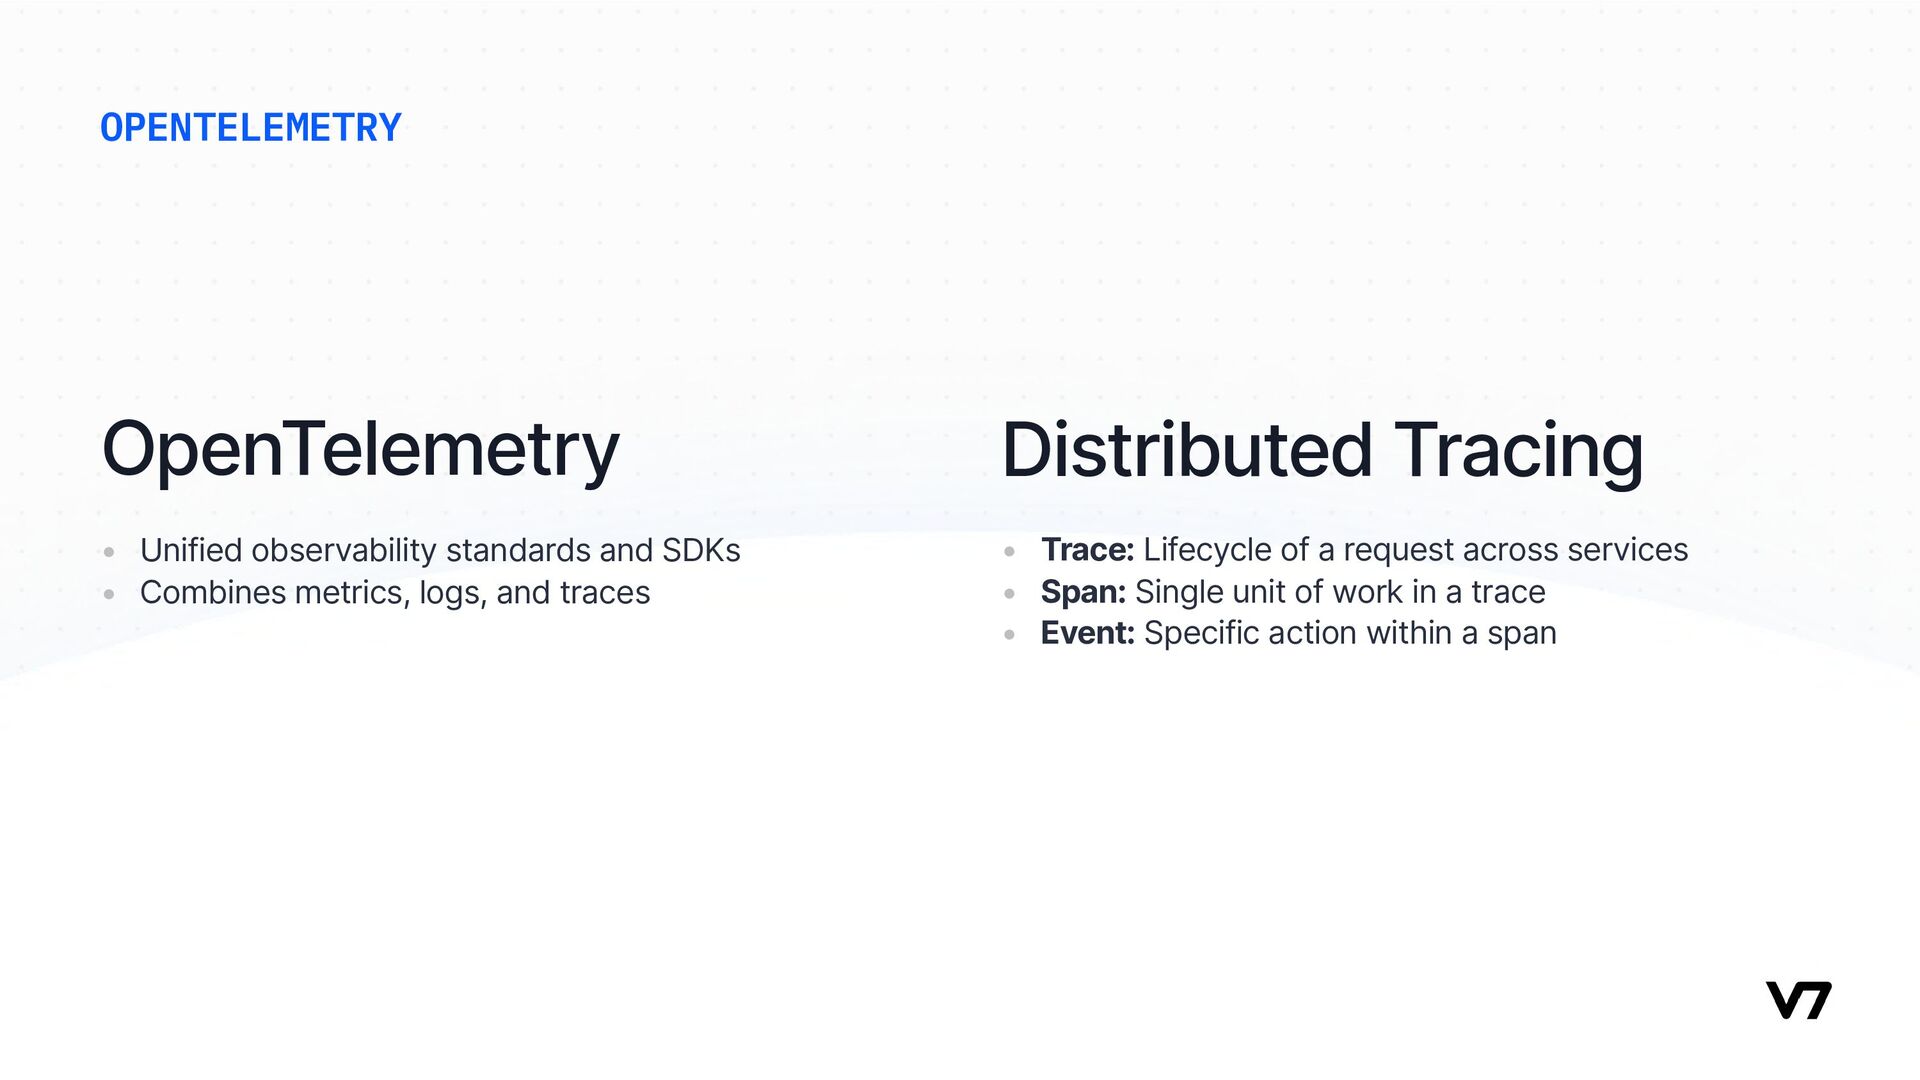
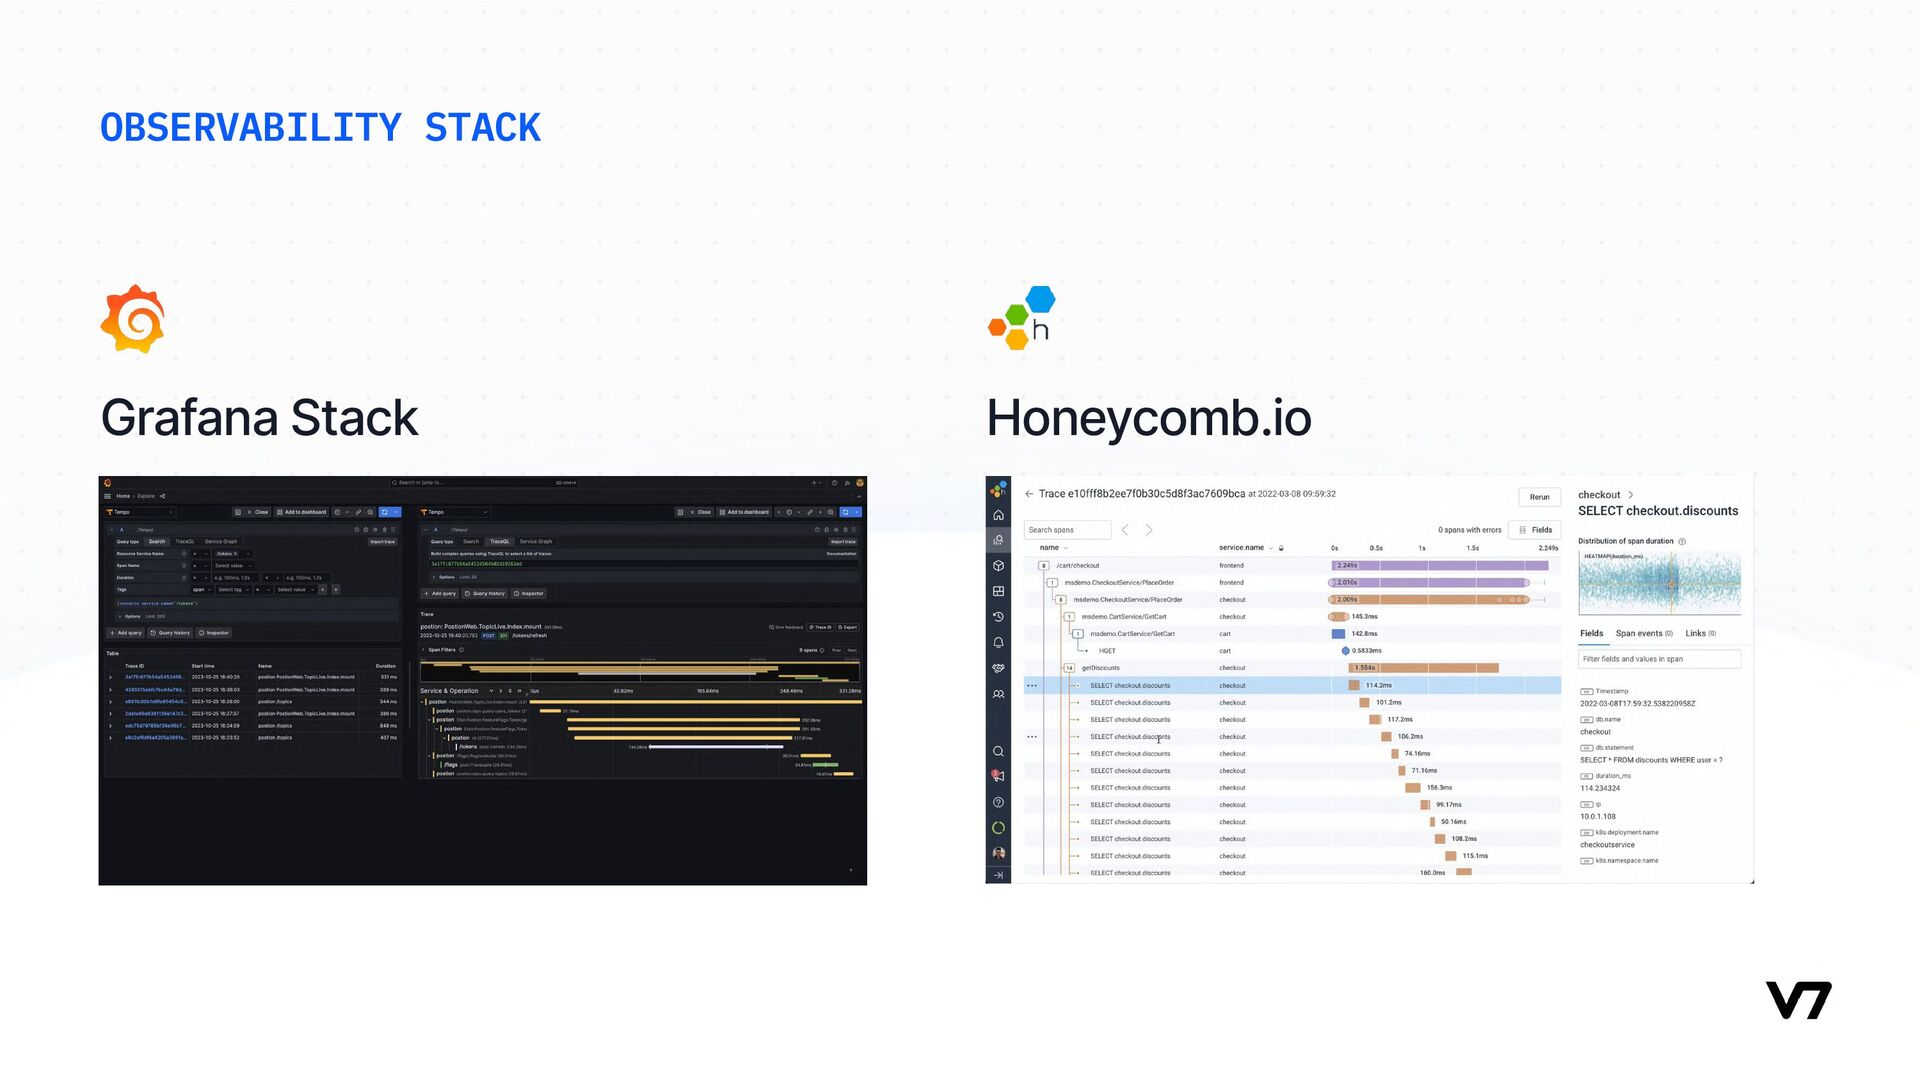
    and traces OpenTelemetry • • • Trace: Lifecycle of a request across services Span: Single unit of work in a trace Event: Specific action within a span Distributed Tracing OPENTELEMETRY
  7. • Some problems only became visible with larger data sets

    Data Size PRODUCTION VS DEV • Some problems only happen when there are concurrent requests coming from many users Load • Latencies between services can make some problems much worse Latency
  8. • • Built into OTP Pair with erlgrind & gprof2dot

    (or qcachegrind) for nice visualization fprof • Pair with speedscope for nice flame graph visualization eflambe
  9. • • • • • OTEL Tracing alone will make

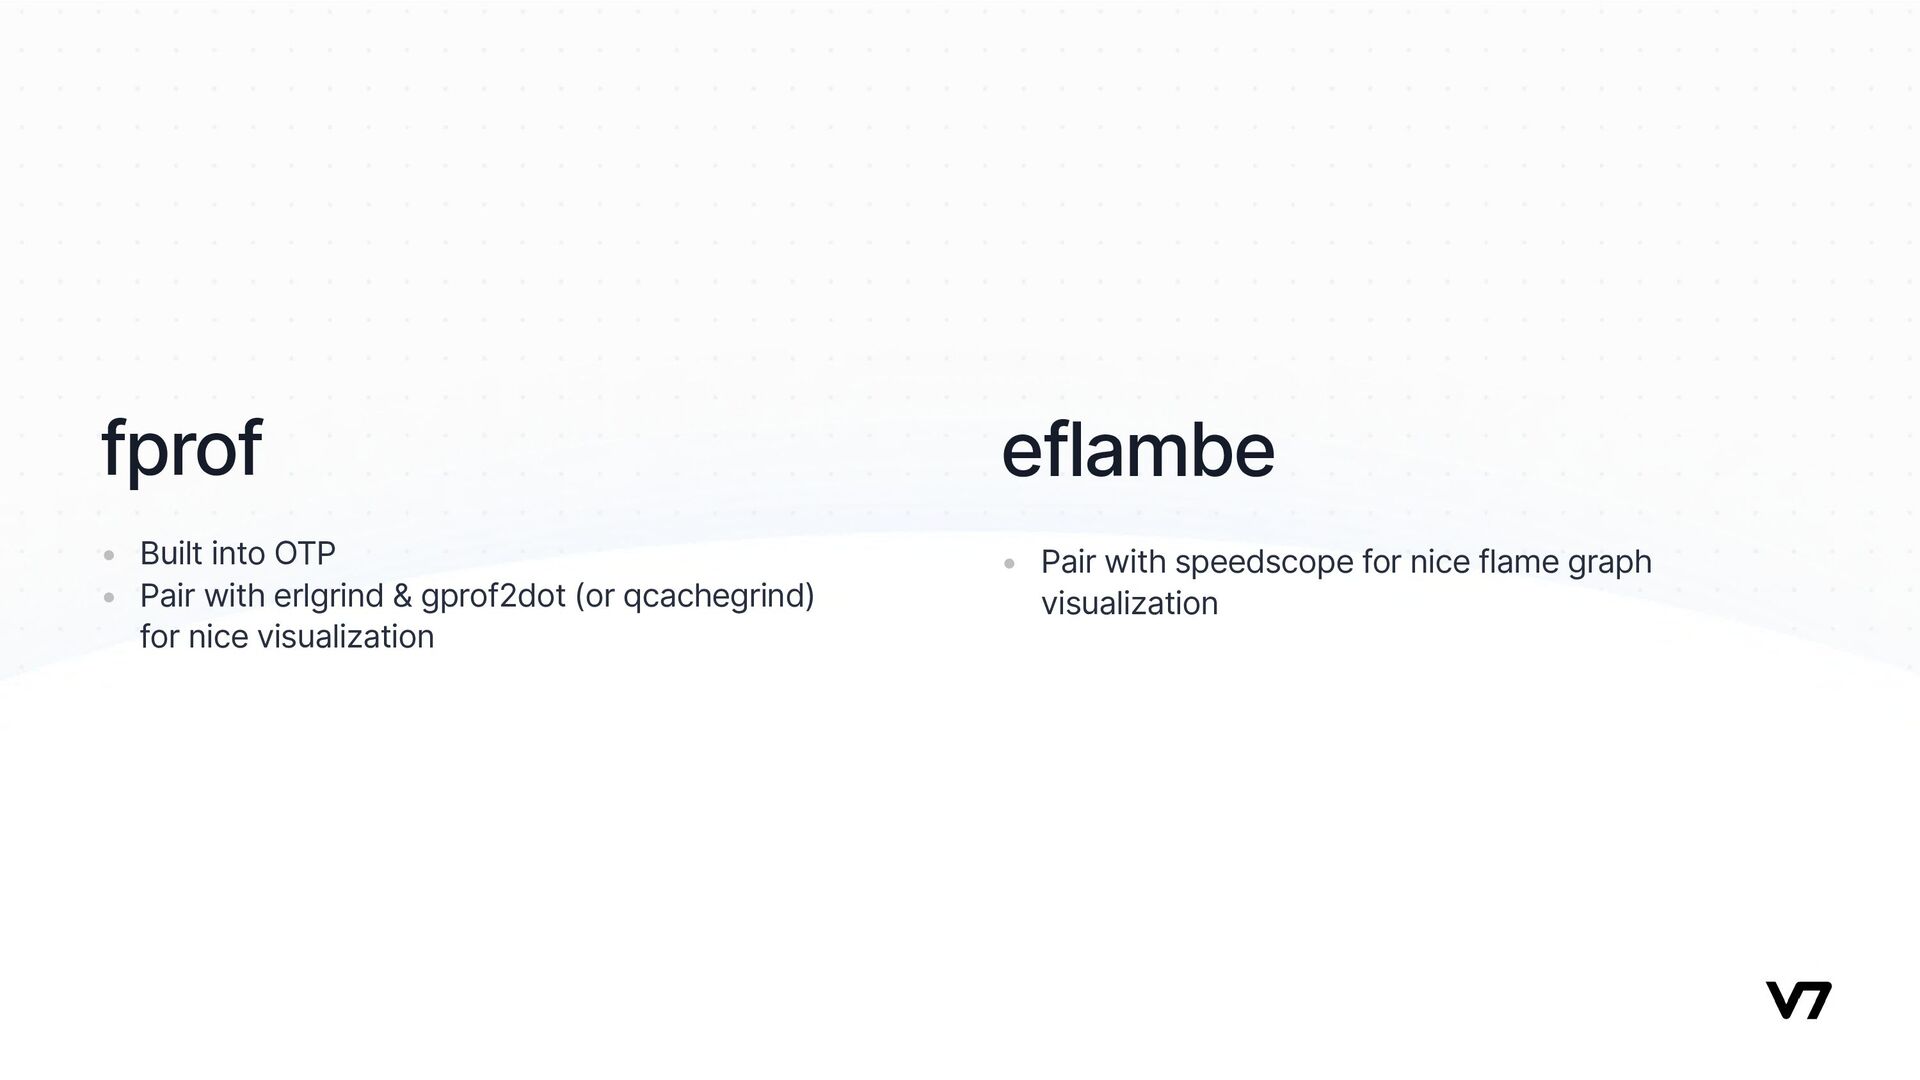
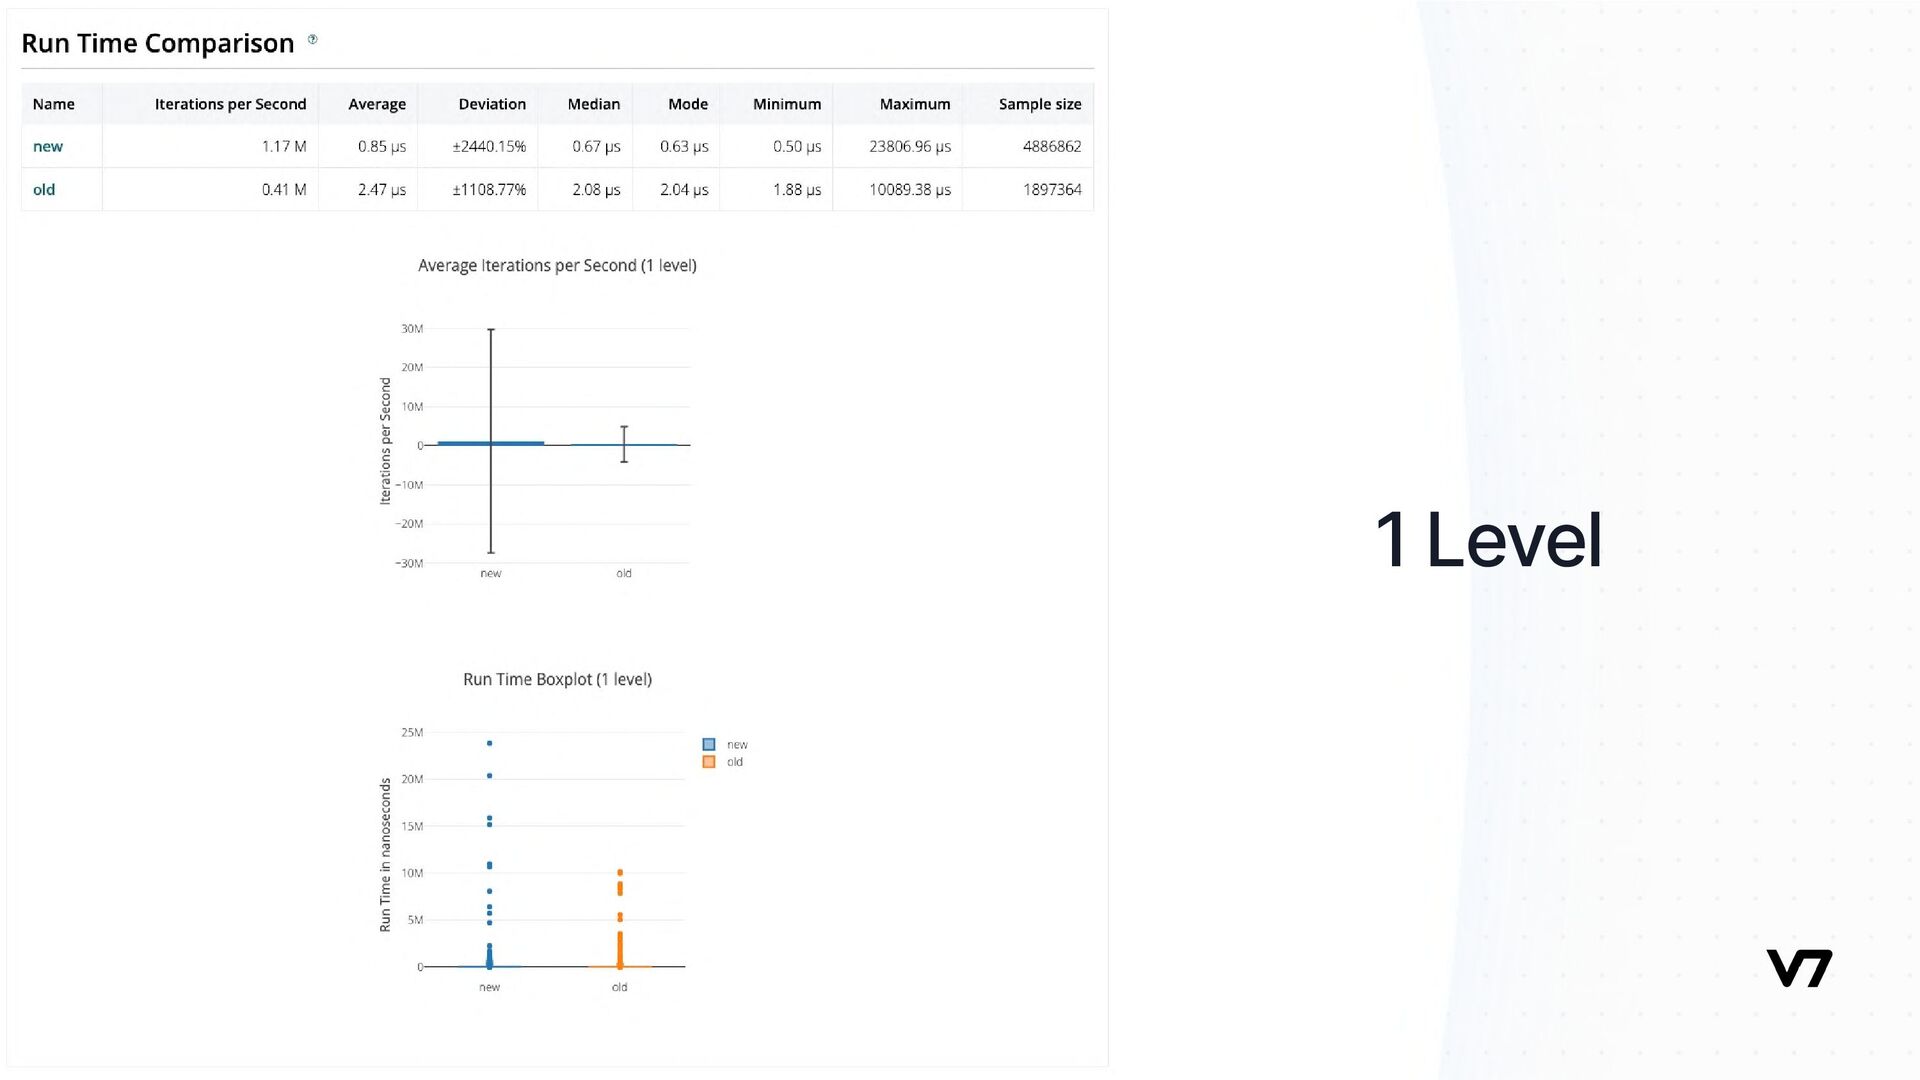
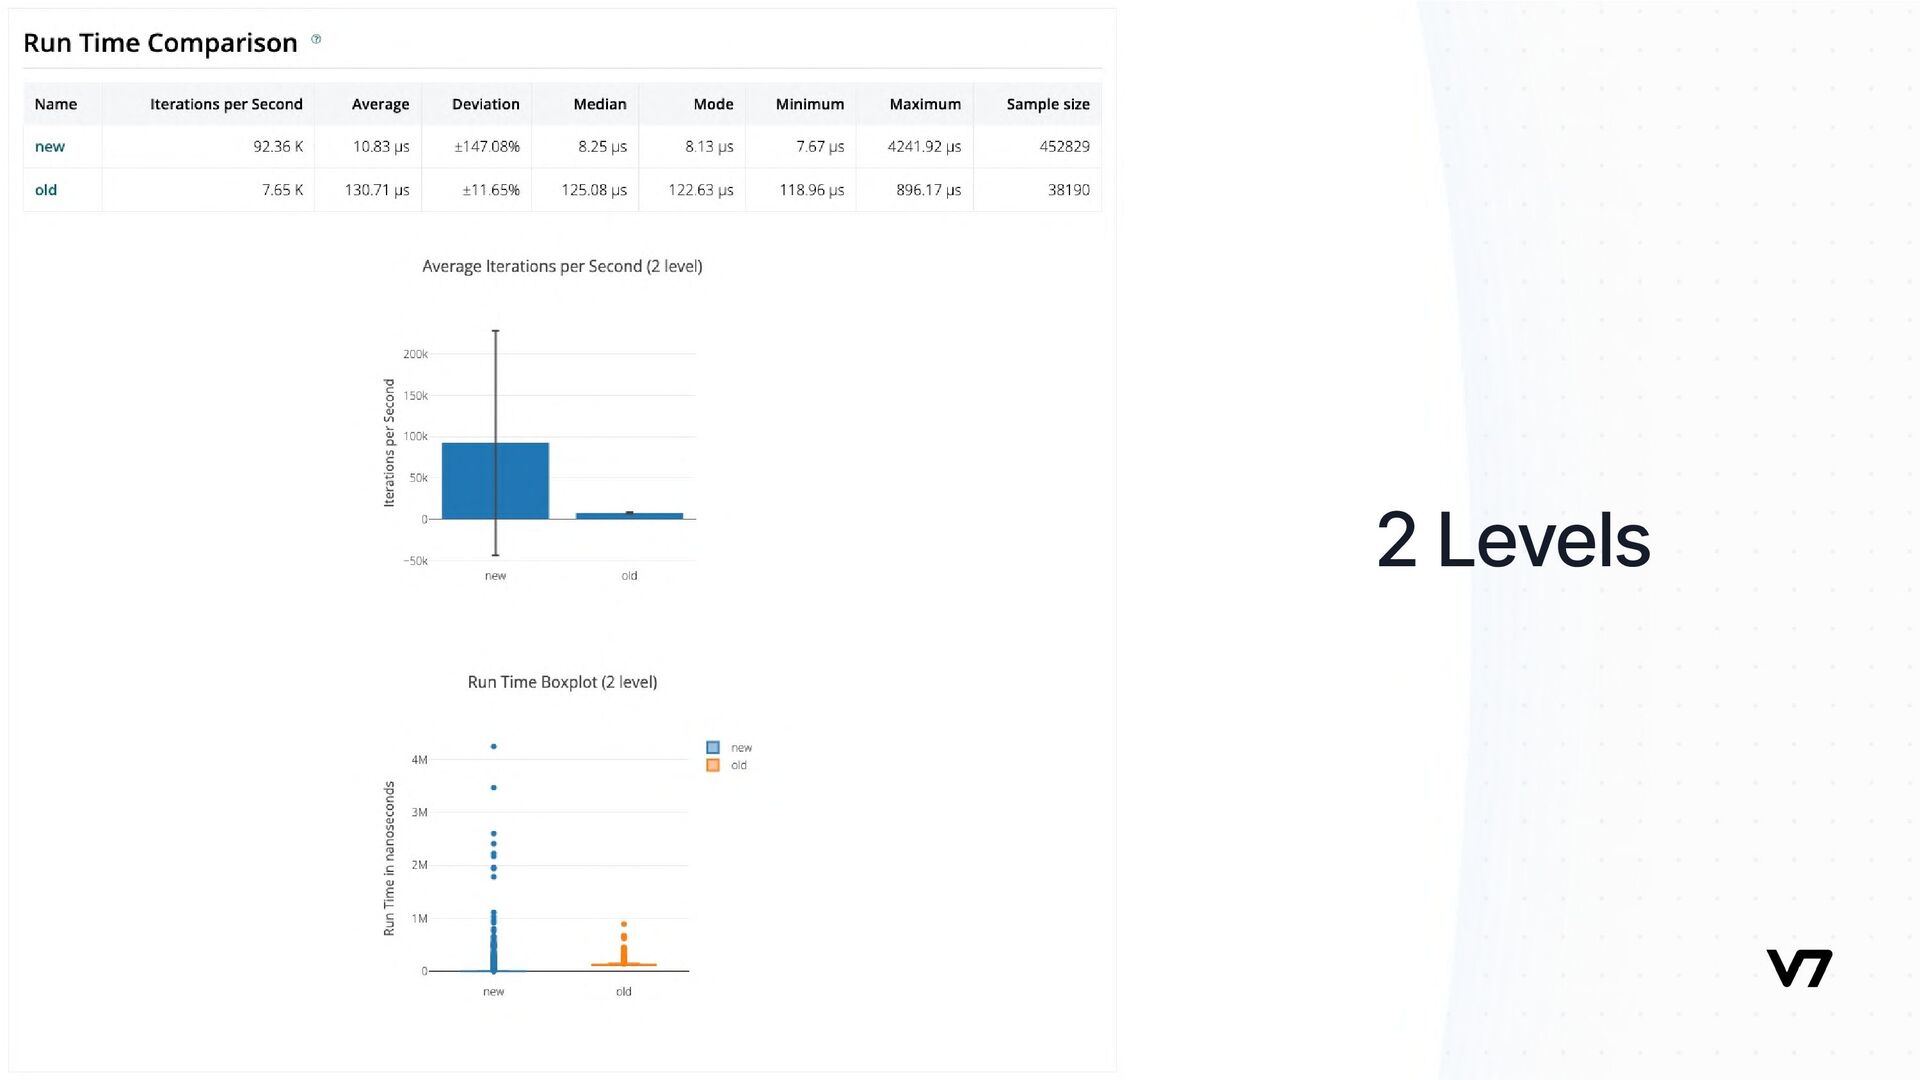
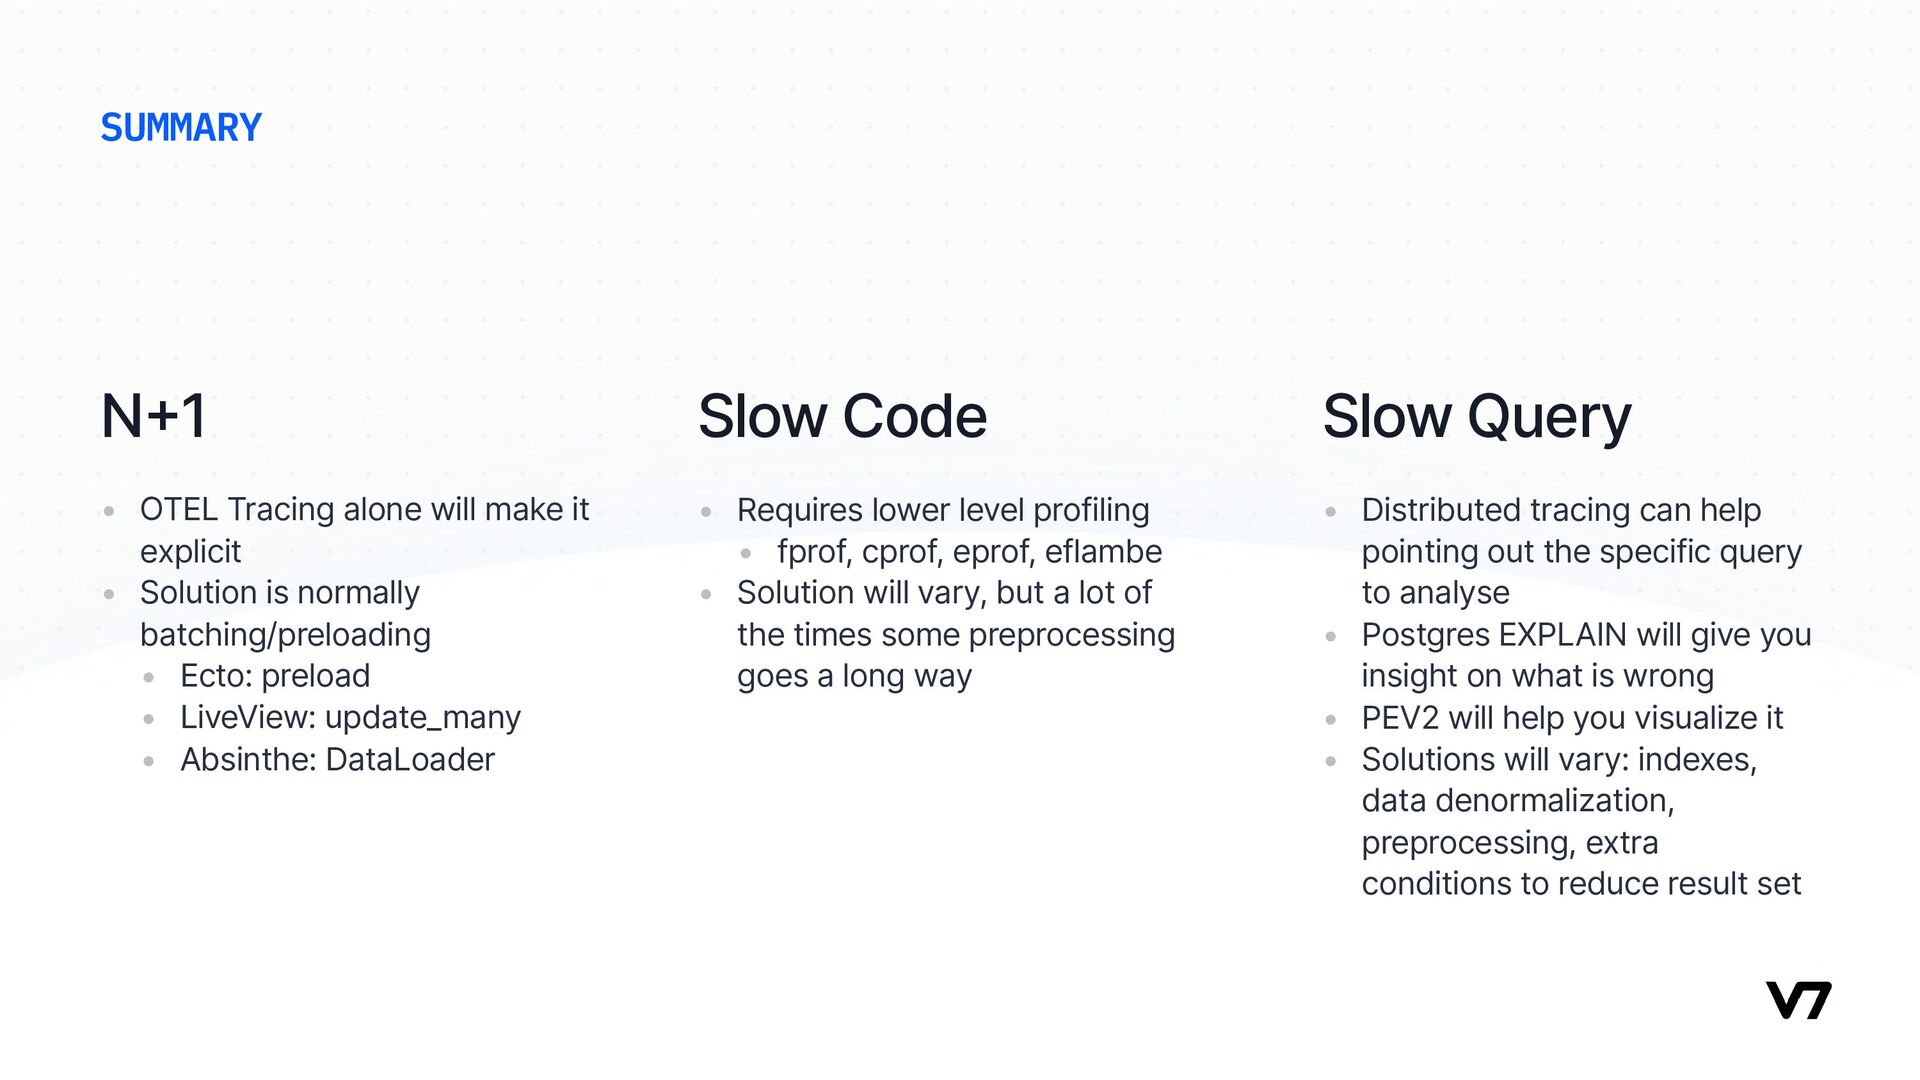
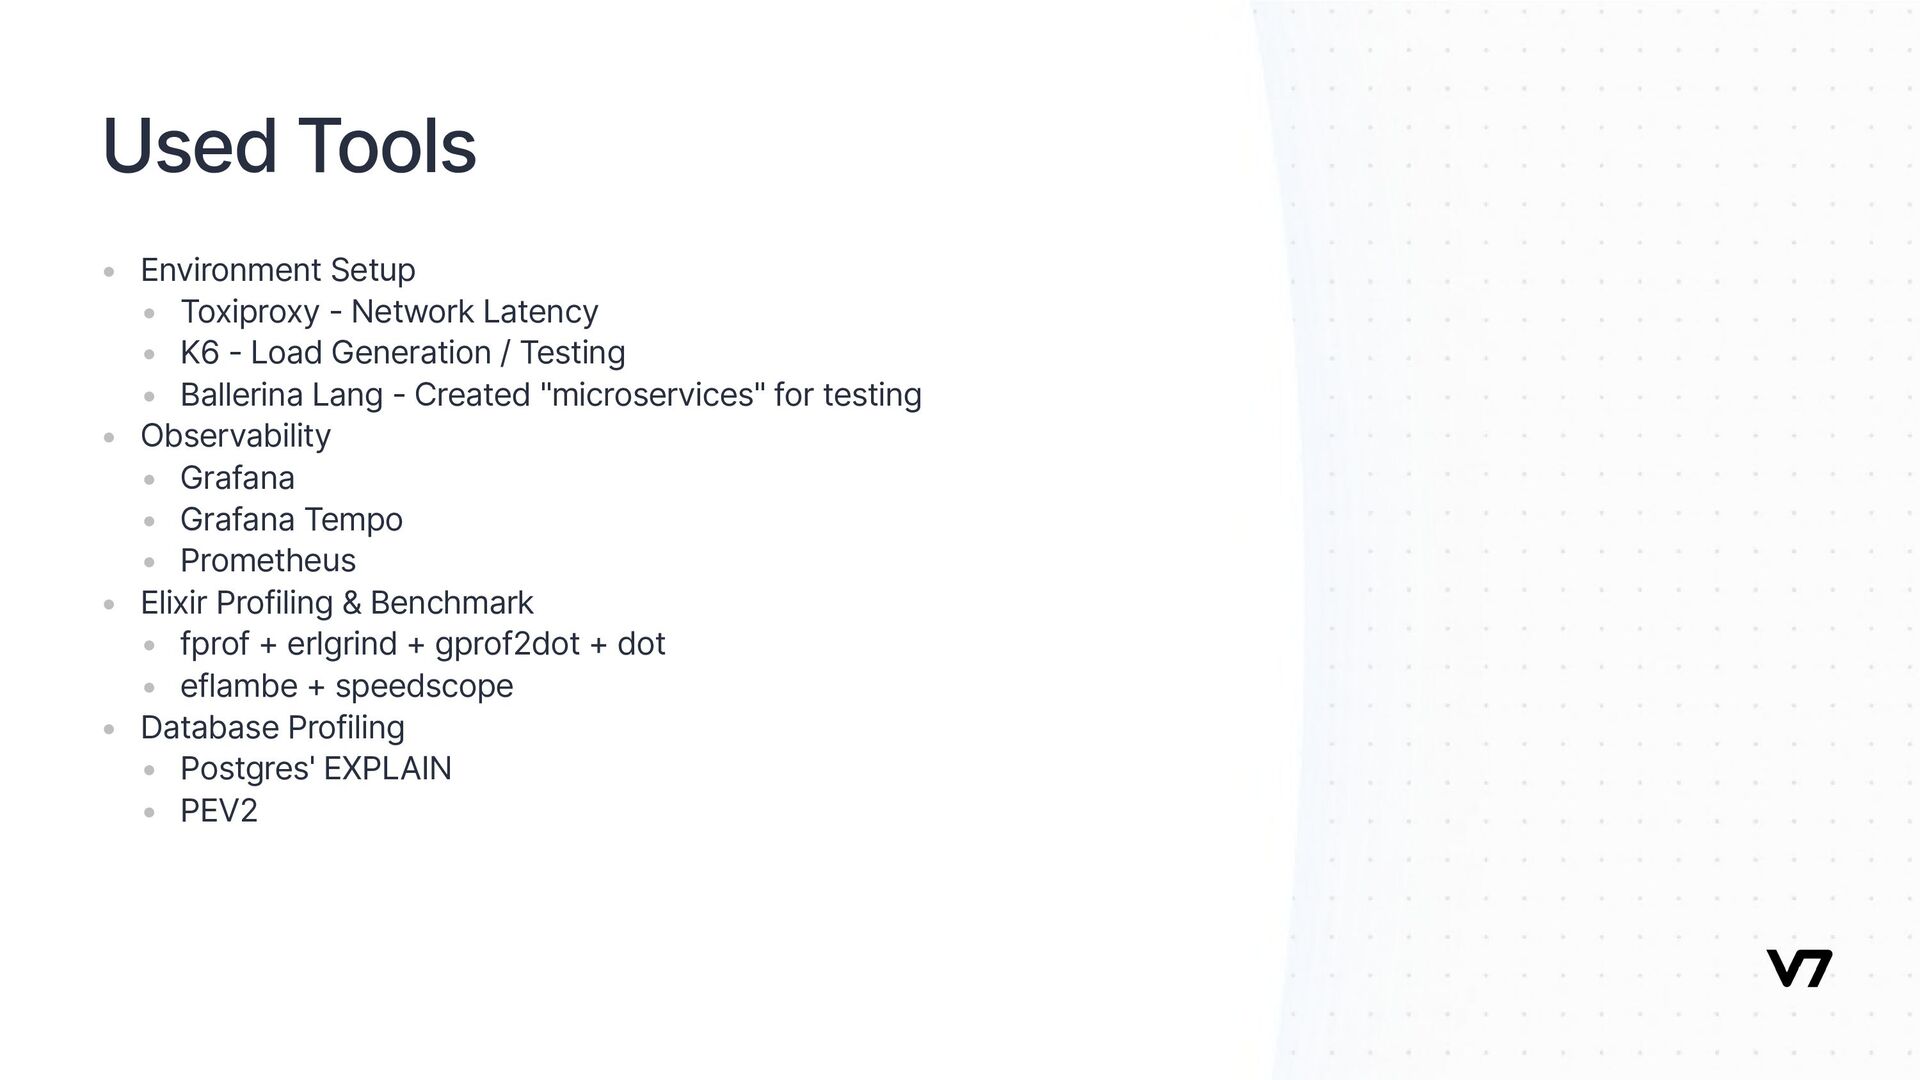
    it explicit Solution is normally batching/preloading Ecto: preload LiveView: update_many Absinthe: DataLoader N+1 SUMMARY • • • Requires lower level profiling fprof, cprof, eprof, eflambe Solution will vary, but a lot of the times some preprocessing goes a long way Slow Code • • • • Distributed tracing can help pointing out the specific query to analyse Postgres EXPLAIN will give you insight on what is wrong PEV2 will help you visualize it Solutions will vary: indexes, data denormalization, preprocessing, extra conditions to reduce result set Slow Query
  10. Used Tools • • • • • • • •

    • • • • • • Environment Setup Toxiproxy - Network Latency K6 - Load Generation / Testing Ballerina Lang - Created "microservices" for testing Observability Grafana Grafana Tempo Prometheus Elixir Profiling & Benchmark fprof + erlgrind + gprof2dot + dot eflambe + speedscope Database Profiling Postgres' EXPLAIN PEV2