Upgrade to Pro — share decks privately, control downloads, hide ads and more …

Three reasons why Kepler's discoveries will continue for a decade

Three reasons why Kepler's discoveries will continue for a decade

A talk presented by Geert Barentsen at the 2018 Wetton Workshop. Held at Christ Church College, Oxford, on June 19th, 2018.

Geert Barentsen

June 19, 2018
Tweet

More Decks by Geert Barentsen

Other Decks in Science

Transcript

  1. 3
    Three reasons

    why
    Kepler’s discoveries

    will continue for a 
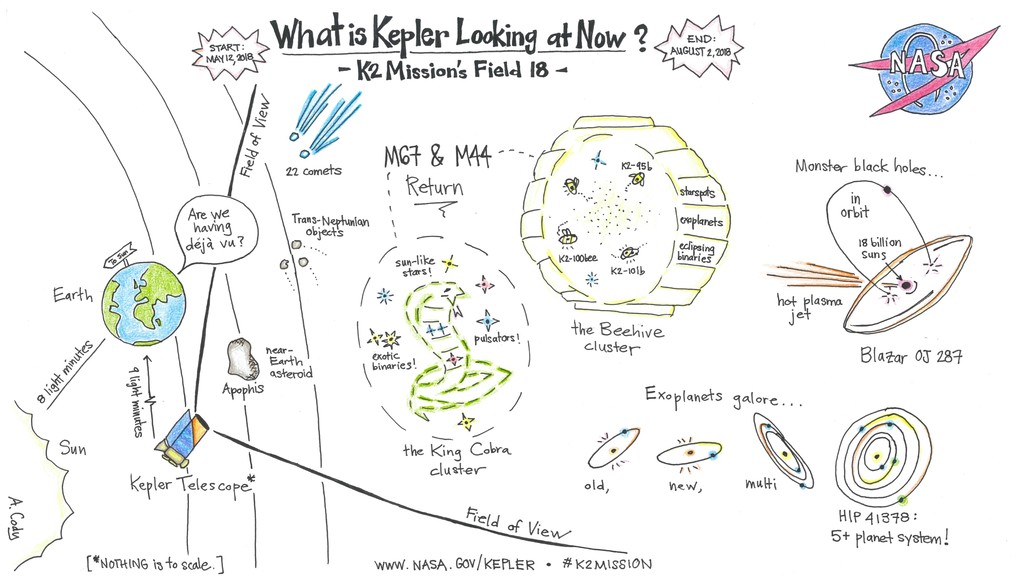
decade
    A talk presented by Geert Barentsen (Kepler GO Director)

    at the Wetton Workshop in Oxford on June 19th, 2018.

    @GeertHub - [email protected] - https://keplerscience.arc.nasa.gov

    View Slide

  2. Photo by Greg Rakozy on Unsplash
    Are we alone?

    View Slide

  3. Jupiter Earth

    View Slide

  4. Photo by Marina Khrapova on Unsplash

    View Slide

  5. 2,621 confirmed exoplanets
    discovered using Kepler & K2 data as of Jun 15th, 2018

    View Slide

  6. Small planets are ubiquitous
    Boxes show the
    average number of
    planets per star.

    Kopparapu+ 2018

    View Slide

  7. View Slide

  8. View Slide

  9. Many of Kepler’s most fundamental
    discoveries are still emerging.

    View Slide

  10. The distribution of planet radii is bimodal
    Photoevaporation appears to
    herd small planets into either
    bare cores or mini-Neptunes.


    Fulton+ 2017
    Also: Owen & Wu 2017

    View Slide

  11. Atmospheric erosion is a
    function of incident flux
    High-precision planet radii
    obtained via asteroseismology
    reveal a slope in the planet
    radius bimodality.

    Van Eylen+ 2017

    View Slide

  12. The number of planets
    discovered across open
    clusters is starting 
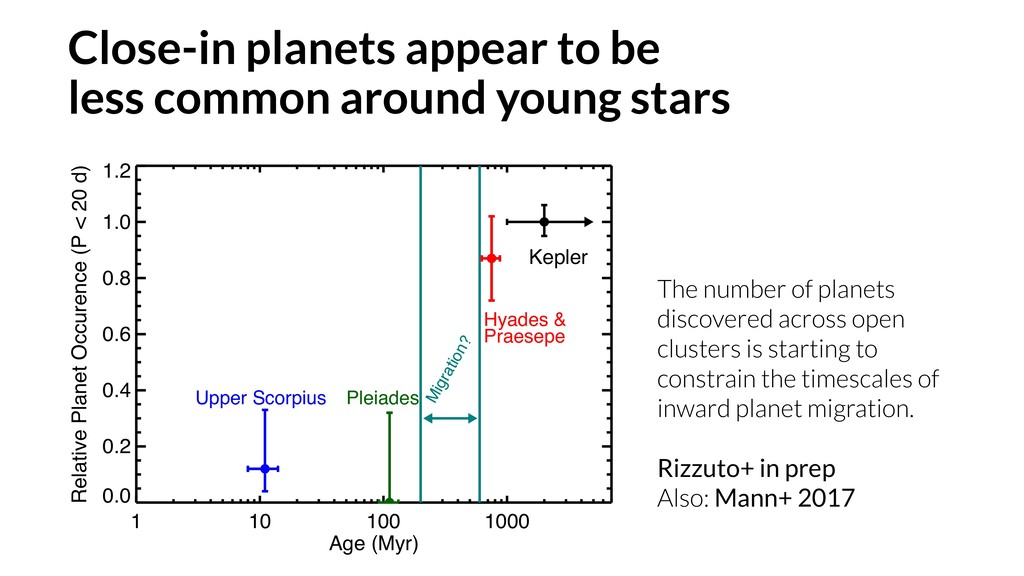
to
    constrain the timescales of
    inward planet migration.
    Rizzuto+ in prep
    Also: Mann+ 2017
    1 10 100 1000
    Age (Myr)
    0.0
    0.2
    0.4
    0.6
    0.8
    1.0
    1.2
    Relative Planet Occurence (P < 20 d)
    Migration?
    Kepler
    Upper Scorpius Pleiades
    Hyades &
    Praesepe
    Close-in planets appear to be
    less common around young stars

    View Slide

  13. Beehive cluster (600 Myr) before K2
    Late M-dwarfs spin down

    in a radically different way

    View Slide

  14. Also:
    Rebull+ 2016a,b, 2017,

    Somers+ 2017,

    Barnes+ 2016,

    Stauffer+ 2016,

    Nardiello+ 2015,

    and others.
    Late M-dwarfs spin down

    in a radically different way

    View Slide

  15. Model prediction:
    Matt et al. (2015), 653 Myr
    Late M-dwarfs spin down

    in a radically different way
    Also:
    Rebull+ 2016a,b, 2017,

    Somers+ 2017,

    Barnes+ 2016,

    Stauffer+ 2016,

    Nardiello+ 2015,

    and others.

    View Slide

  16. Transients can have the shape of a Type Ia SN
    but show a rise time of just 2 days
    The median rise time of
    Type Ia SN is ~17 days?!

    Rest+ 2018

    View Slide

  17. Oscillation frequencies in the brightness of active galaxies
    appear to be predictive of the central black hole mass
    Smith+ 2018

    View Slide

  18. Photo by Marina Khrapova on Unsplash

    View Slide

  19. These results were all published
    within the past year
    … nine years after Kepler’s launch!

    View Slide

  20. 2018 will be Kepler’s most productive year on record

    View Slide

  21. Why?

    View Slide

  22. Science takes time.

    View Slide

  23. But also: fully open data has
    grown our community.

    View Slide

  24. Will the discoveries continue?

    View Slide

  25. 1. The data analysis methods continue to improve.
    2. Our computational capabilities are growing faster than
    the data set.
    3. The field is increasingly valuing community software
    and tutorials.

    View Slide

  26. 1
    The data analysis methods
    continue to improve

    View Slide

  27. Electronic “rolling band” noise
    limits Kepler’s sensitivity, but
    progress is being made towards
    modeling the varying background,
    e.g. using 2D Gaussian Processes.

    Hedges+ in prep
    Our ability to model Kepler’s background
    systematics is improving

    View Slide

  28. The intra-pixel response function of Kepler’s CCDs
    is being measured to an unprecedented precision
    A new measurement
    apparatus was designed
    which uses small spots of
    light across a range of
    wavelengths.

    Vorobiev+ in prep
    This opens the door towards high-precision PSF-fitting photometry with Kepler.

    View Slide

  29. Our understanding of data caveats, and
    the tools to identify them, are improving
    Video show the negative
    crosstalk signal produced
    by a bright asteroid on a
    different CCD channel.

    Movie credit: Hugh Osborn

    View Slide

  30. Look at your data!

    View Slide

  31. Rackham+ 2018
    But also … our understanding of the physics is improving

    View Slide

  32. Identification of 92 dipper stars
    using a Random Forest Classifier
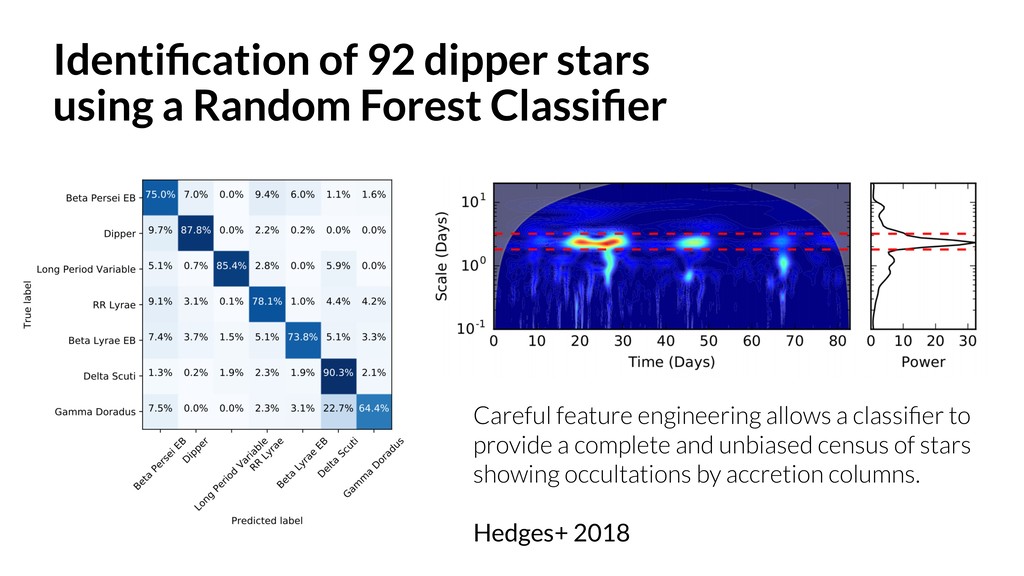
    Careful feature engineering allows a classifier to
    provide a complete and unbiased census of stars
    showing occultations by accretion columns.

    Hedges+ 2018

    View Slide

  33. Transit shape validation of Kepler-80 g and 90 i
    using a Convolutional Neural Network
    Shallue+ 2018

    View Slide

  34. 2
    Our computational capabilities are
    growing faster than the data set

    View Slide

  35. In optical astronomy, the “deluge of data" is often
    out-paced by the “deluge of computing power”.

    View Slide

  36. The number of pixels telemetered by NASA’s
    exoplanet surveys doubles every 28 months
    Also: MOST, CoRoT,
    Plato, Cheops, Ariel,
    and others.
    Assumptions detailed at https://github.com/barentsen/tech-progress-data

    View Slide

  37. Ground-based optical surveys show a pixel
    rate which doubles every 44 months
    Caveat: radio astronomers
    are significantly worse off.
    Assumptions detailed at https://github.com/barentsen/tech-progress-data

    View Slide

  38. The number of transistors in CPUs has
    continued to double every 24 months
    (Moore’s original law)

    View Slide

  39. The speed of the world’s
    fastest supercomputer
    doubles every 13 months
    The speed of research
    internet backbones
    doubles every 16 months
    Data sources detailed at https://github.com/barentsen/tech-progress-data

    View Slide

  40. The cost of storage halves
    every 28 months
    Storage bus speeds
    double every 35 months
    Data sources detailed at https://github.com/barentsen/tech-progress-data

    View Slide

  41. We are working with MAST to simplify bulk
    analyses of Kepler data in the cloud
    Smith+ 2018

    View Slide

  42. Key issue: the number of astronomers
    only doubles every ~13 years
    Caveat: assumes the number
    of IAU members is a proxy for
    the number of astronomers.

    View Slide

  43. Your brain size doubles
    every 1.5 million years
    Caveat: brain size is
    a flawed proxy for
    intelligence.

    View Slide

  44. Our computational capability per
    unit (Kepler) data is increasing.
    How to leverage it?

    View Slide

  45. 3
    The field is increasingly valuing
    community software and tutorials

    View Slide

  46. Credit: Arfon Smith
    Number of AstroPy contributors over time

    View Slide

  47. View Slide

  48. Lintott+ 2018

    View Slide

  49. View Slide

  50. View Slide

  51. View Slide

  52. View Slide

  53. Software was key to enable Kepler’s resurrection:
    ‣ Field & target selection tool : github.com/KeplerGO/K2fov
    ‣ Asteroid selection tool: github.com/KeplerGO/K2ephem
    ‣ Motion systematics correction: github.com/KeplerGO/PyKE
    ‣ Raw data parser: github.com/KeplerGO/kadenza
    ‣ Quicklook tool: github.com/KeplerGO/K2flix
    ‣ Quality control: github.com/KeplerGO/k2-quality-control
    ‣ Mission website: github.com/KeplerGO/KeplerScienceWebsite
    ‣ Publication tracker: github.com/KeplerGO/kpub
    Also: community pipelines, e.g.:
    ‣ K2SC: github.com/OxES/k2sc
    ‣ EVEREST: github.com/rodluger/everest

    View Slide

  54. Ann Marie Cody Michael Gully-Santiago
    Christina Hedges Zé Vinícius

    View Slide

  55. lightkurve: a new Python package for Kepler, K2, and TESS analysis

    View Slide

  56. View Slide

  57. Community software, tutorials, and data enable us
    to open ourselves to our peers and to the public.

    View Slide

  58. Video tutorial for
    Windows users

    View Slide

  59. Citizen science matters
    In 2013, volunteers of the Zooniverse
    brought the unusual dips in the light
    curve of “Tabby’s Star” to attention.

    View Slide

  60. We benefit from treating the public as our peers
    In 2017, students from
    the Thacher School in
    California obtained
    20k observations over
    135 nights; finding that
    the dips are chromatic.

    View Slide

  61. Important ongoing conversations:
    - how to credit the authors of open software & data?
    - how to provide robust careers and funding
    opportunities to support scientists?
    - how to address the stress related to the fear of
    “getting scooped” in the era of openness.

    View Slide

  62. 3
    I feel excited about the future of our field,
    because of:
    1. new data analysis methods;
    2. our computational capabilities;
    3. community software and tutorials.

    View Slide

  63. Photo by Marina Khrapova on Unsplash

    View Slide

  64. Photo by Greg Rakozy on Unsplash
    Are we alone?

    View Slide