Upgrade to Pro — share decks privately, control downloads, hide ads and more …

Big data meets scalable visualizations by JAVIER DE LA TORRE at Big Data Spain 2013

Big data meets scalable visualizations by JAVIER DE LA TORRE at Big Data Spain 2013

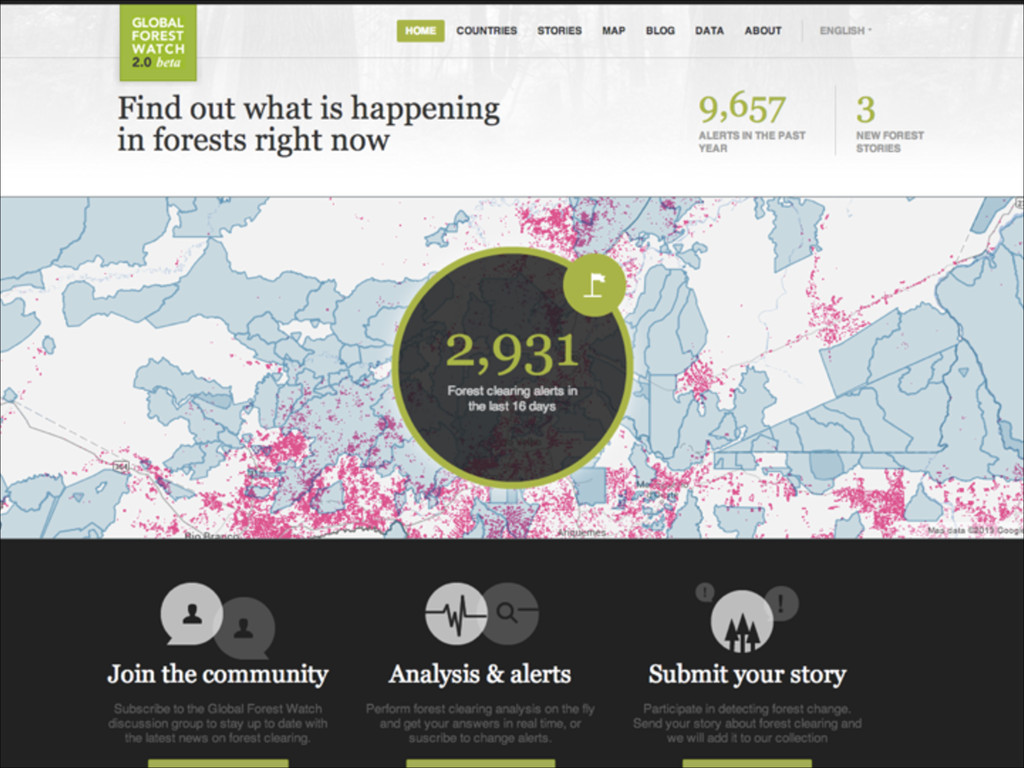
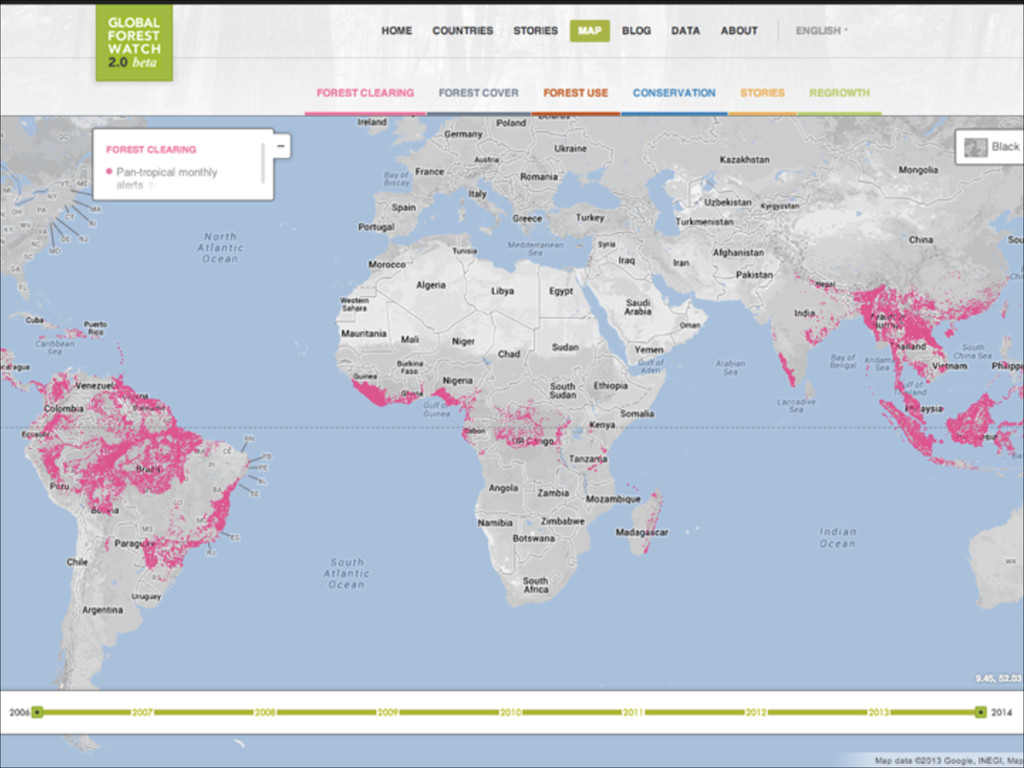
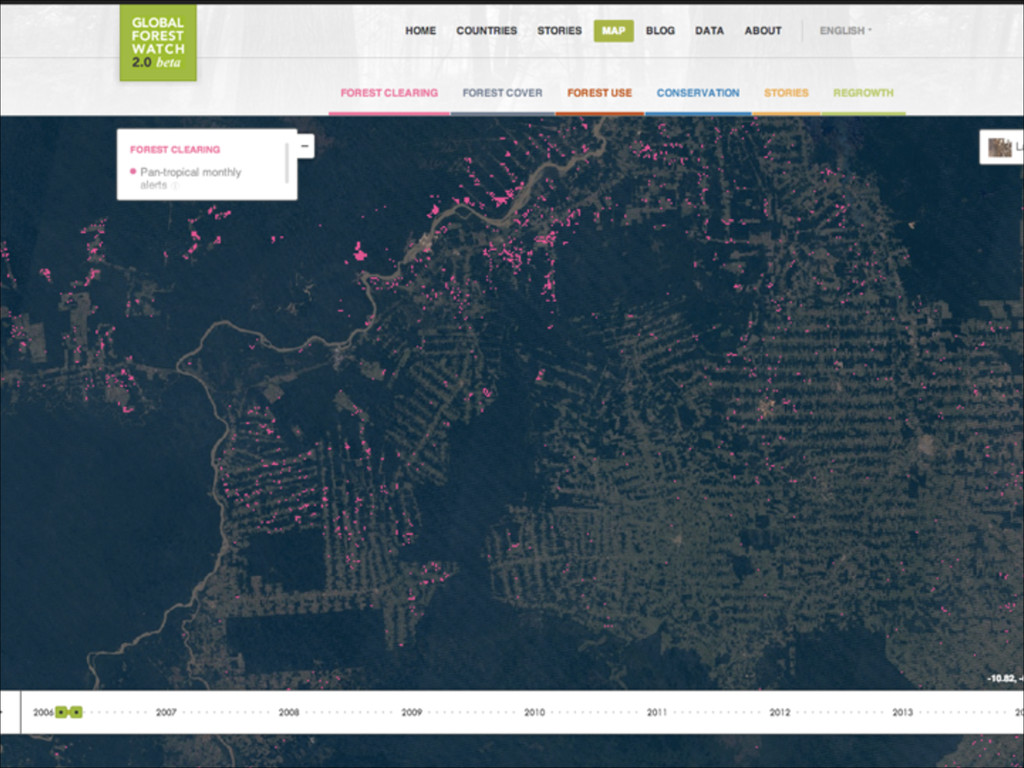
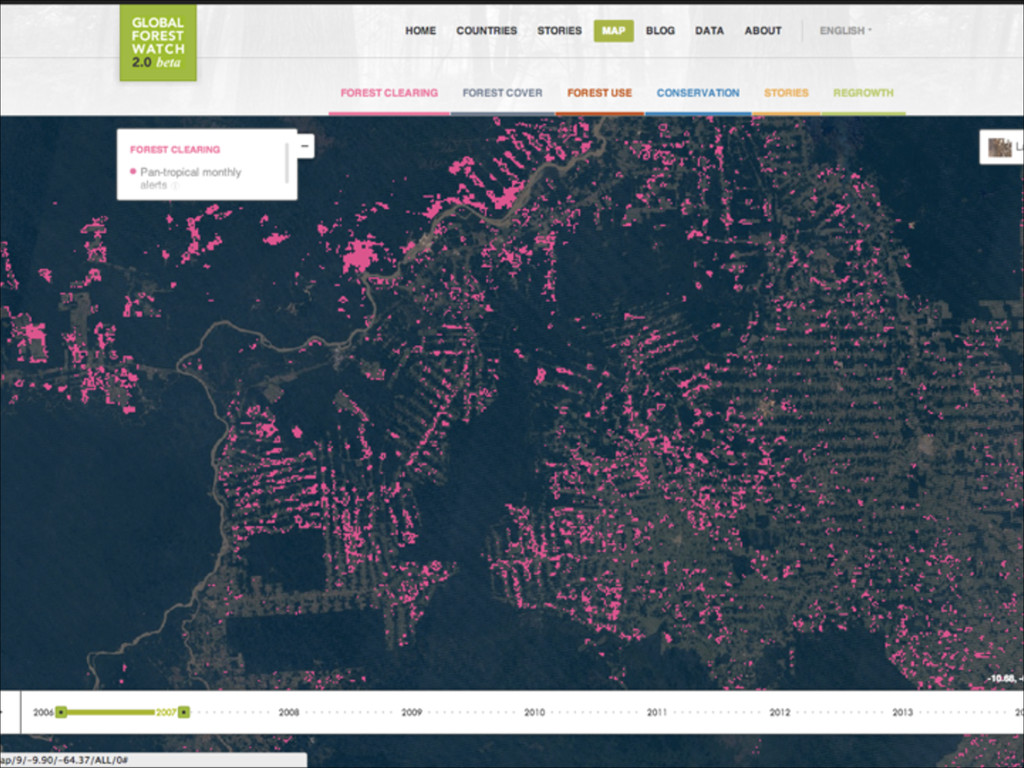
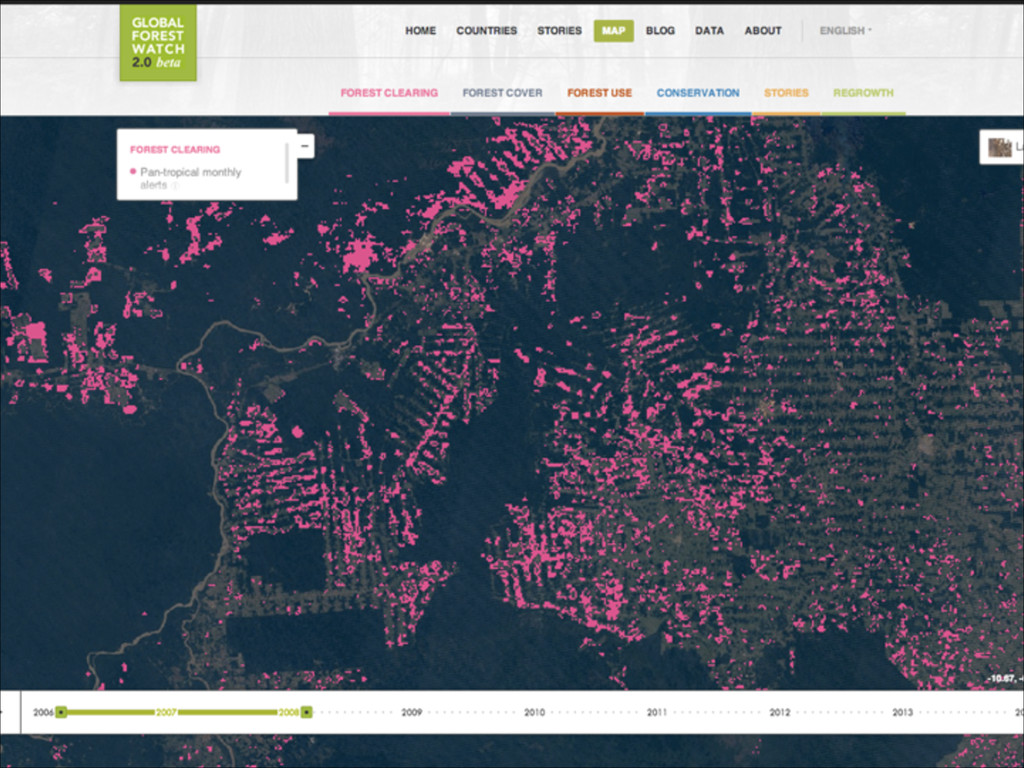
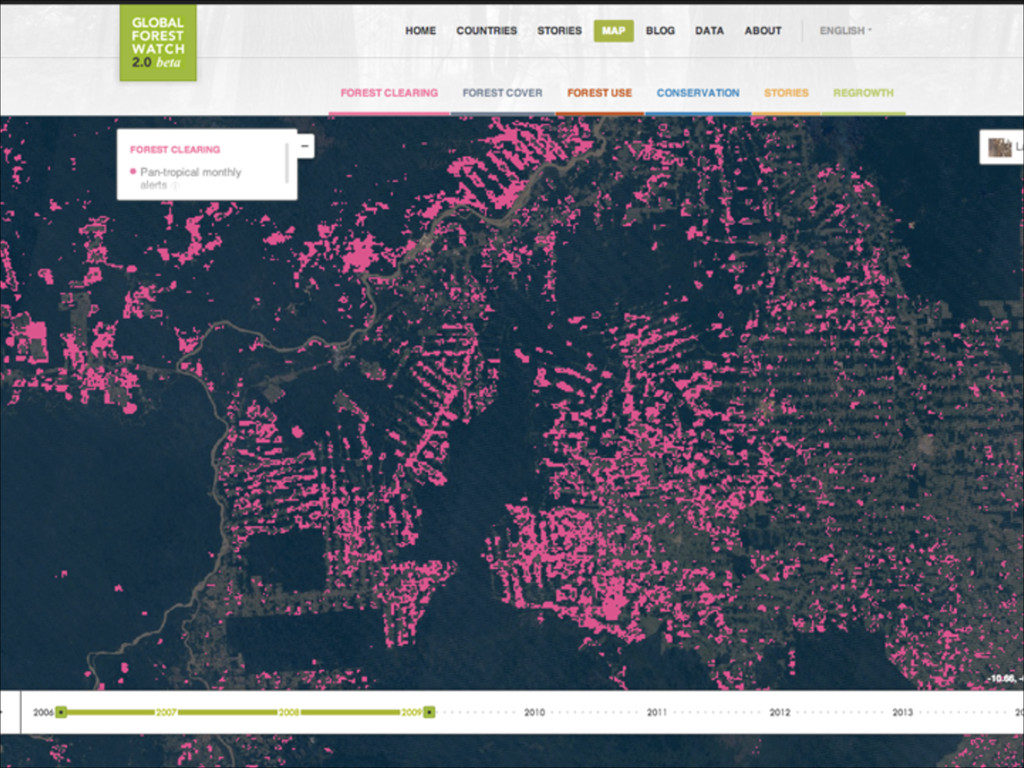
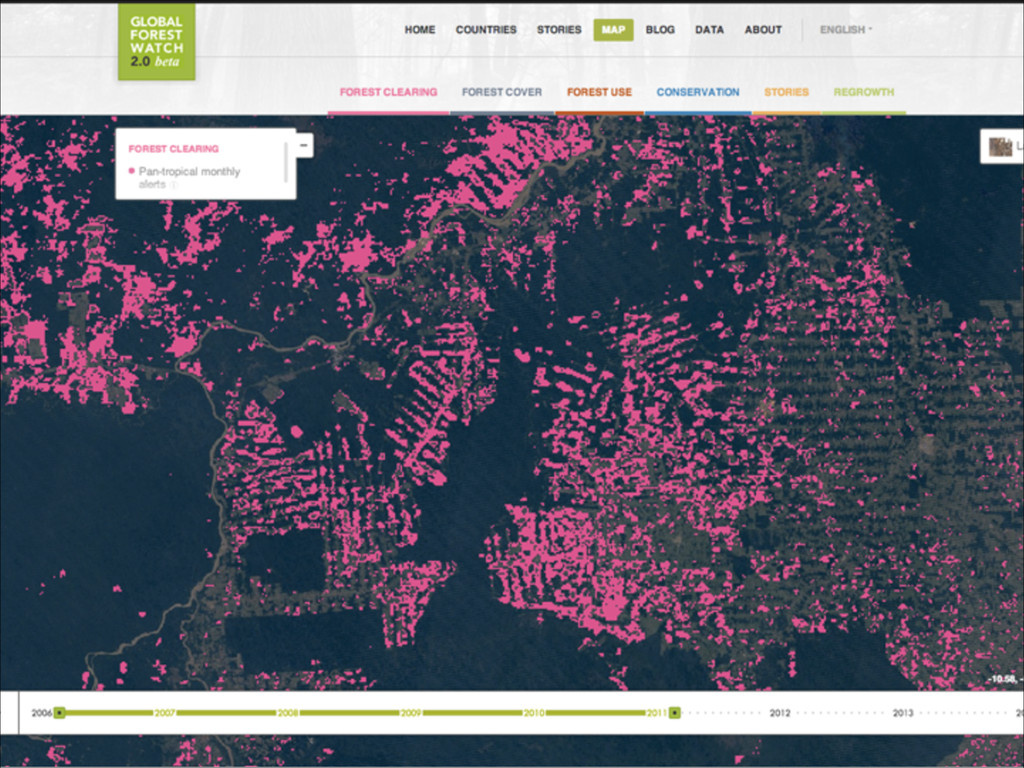
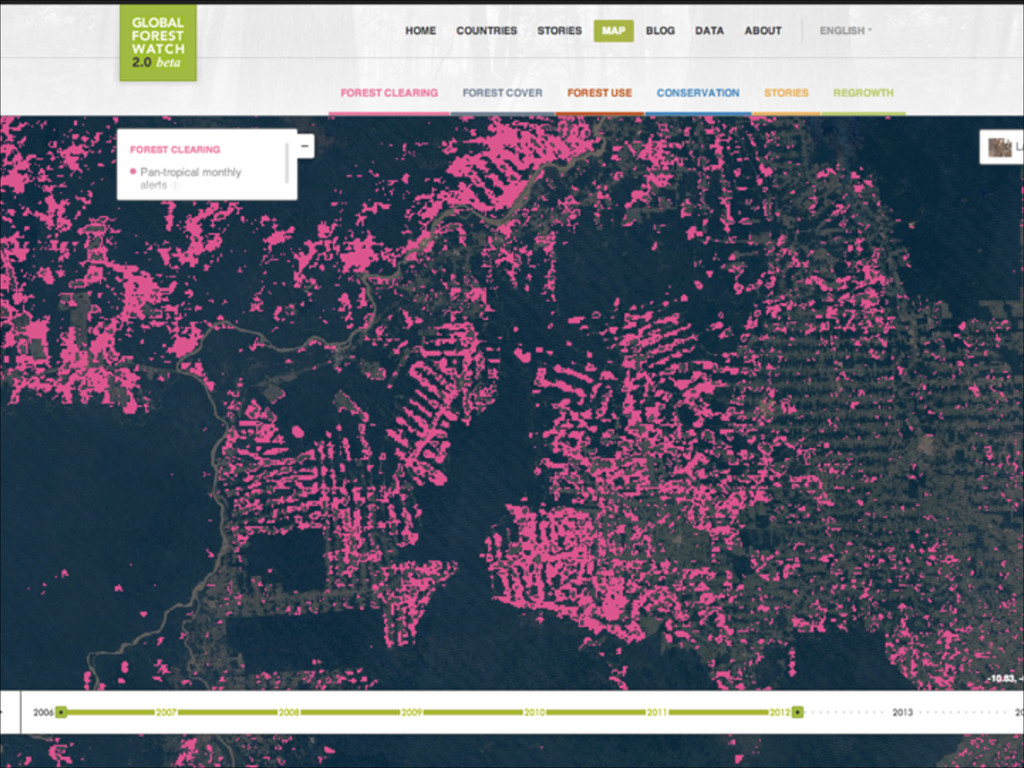
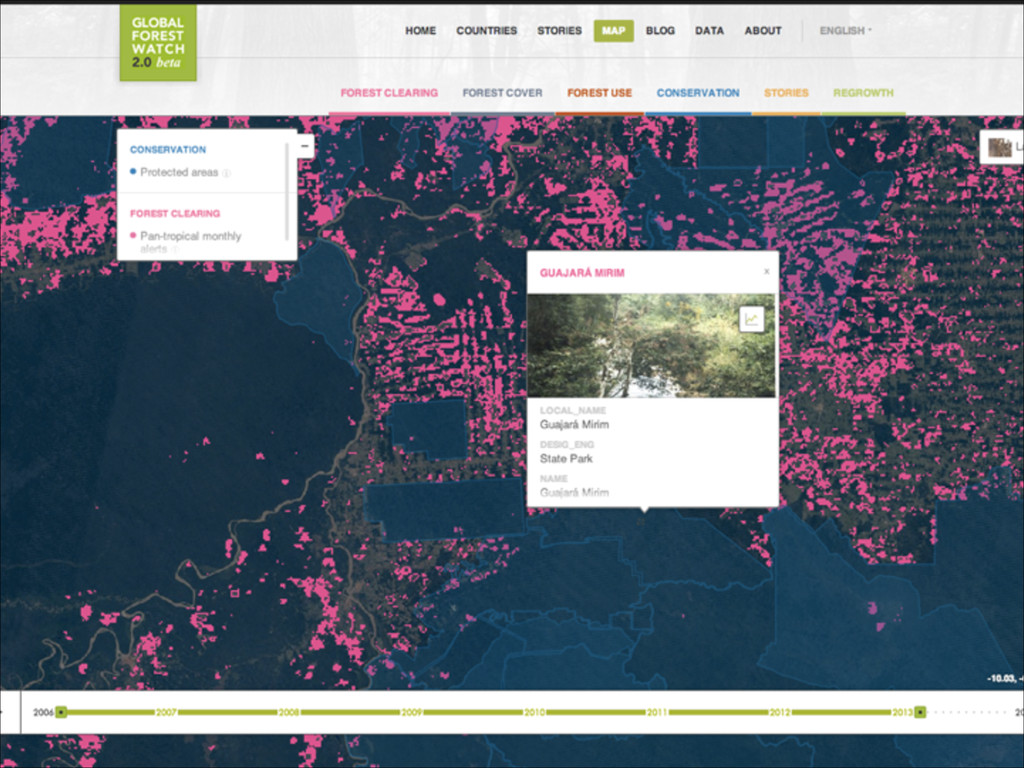
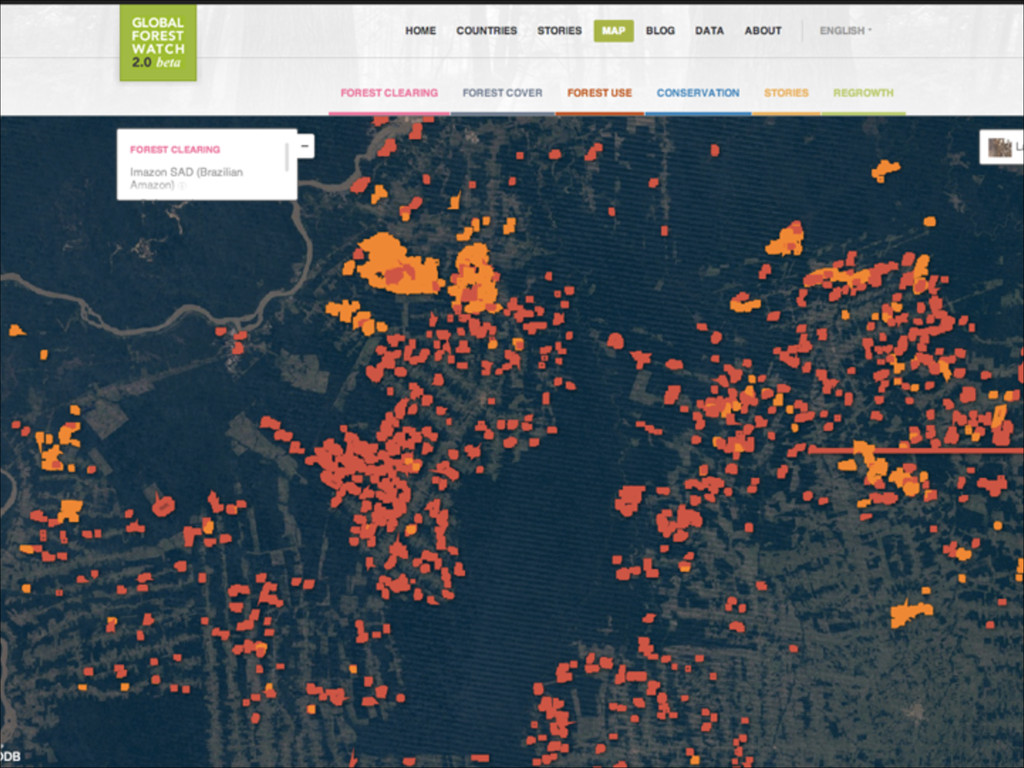
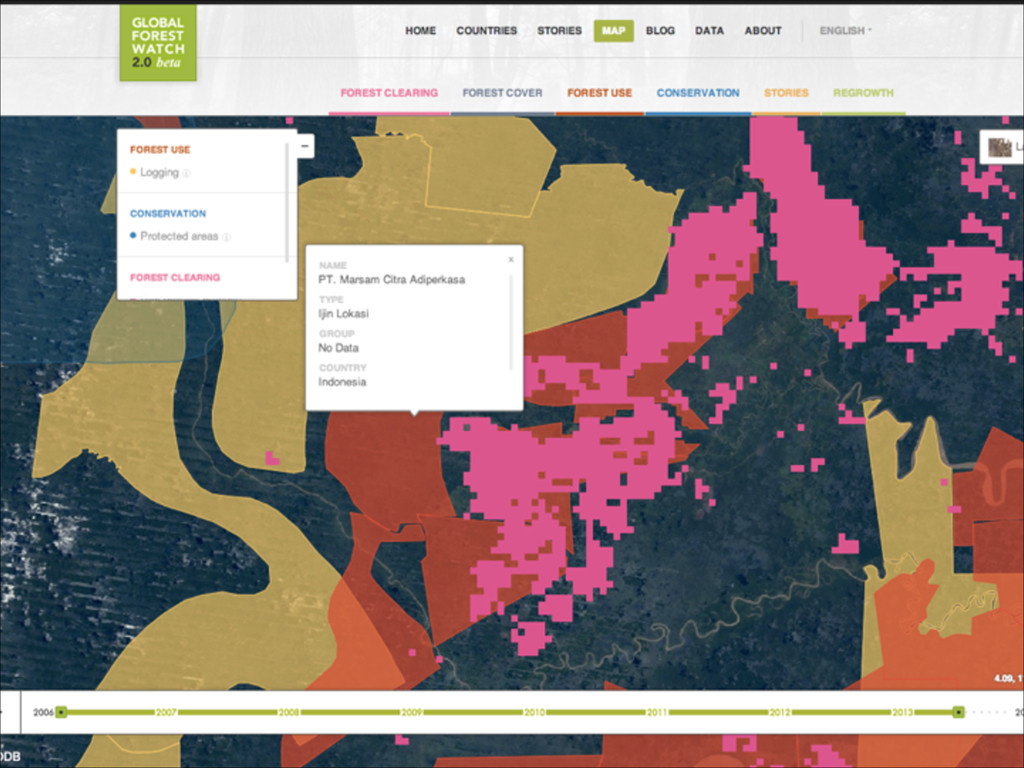
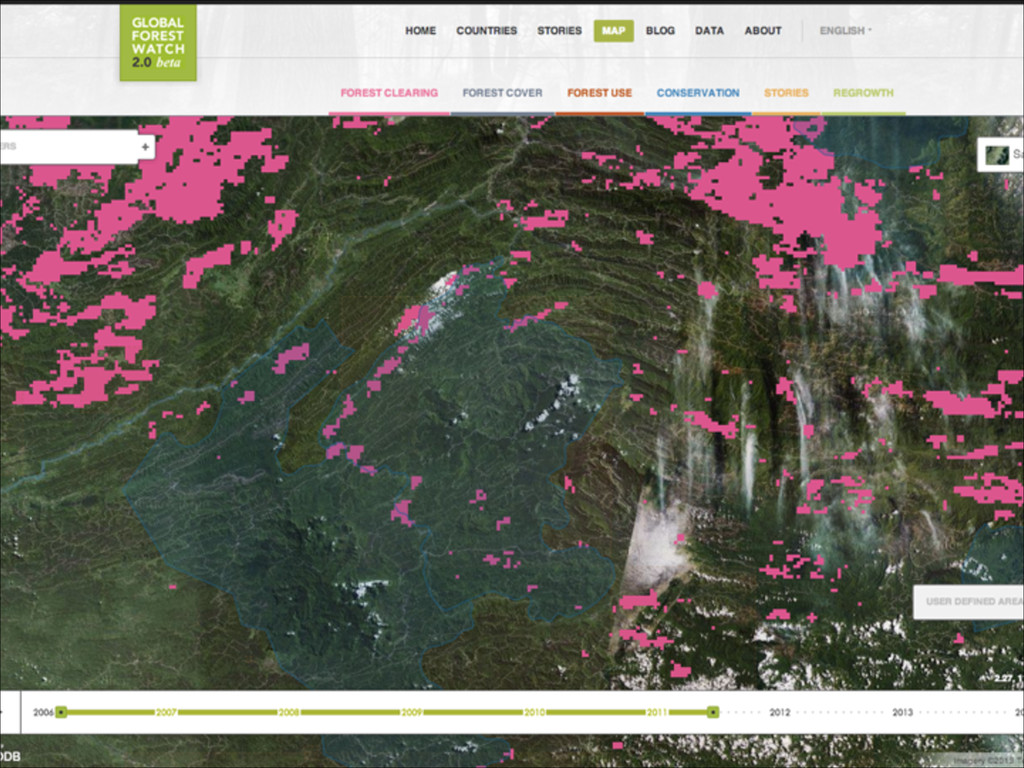
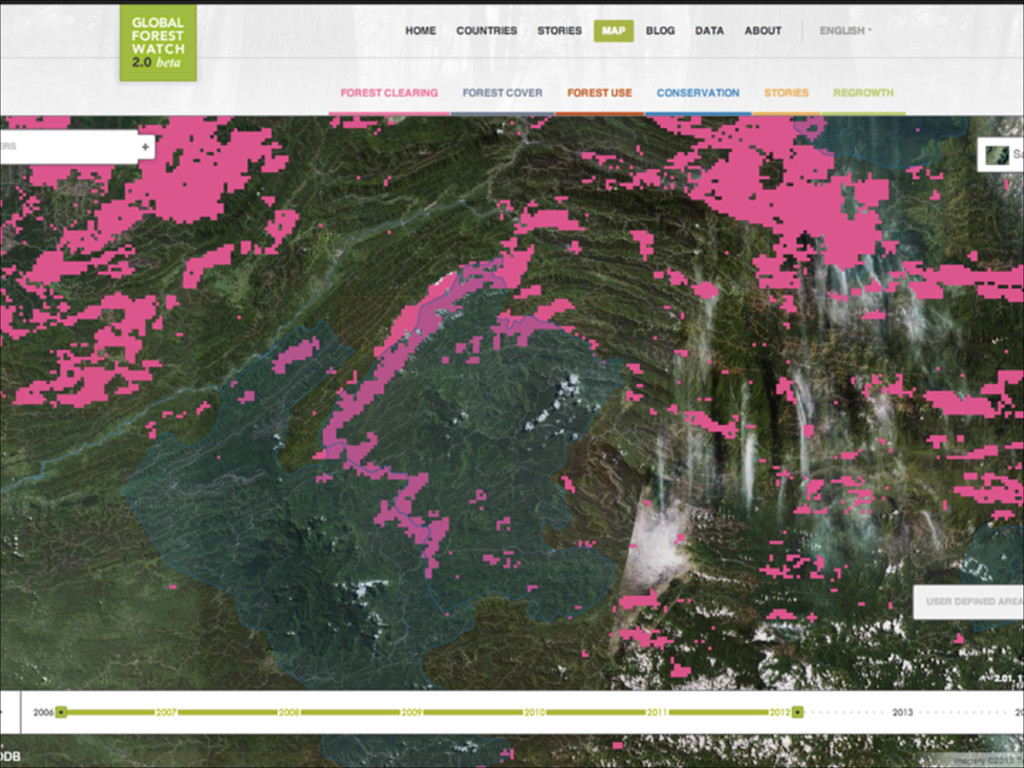
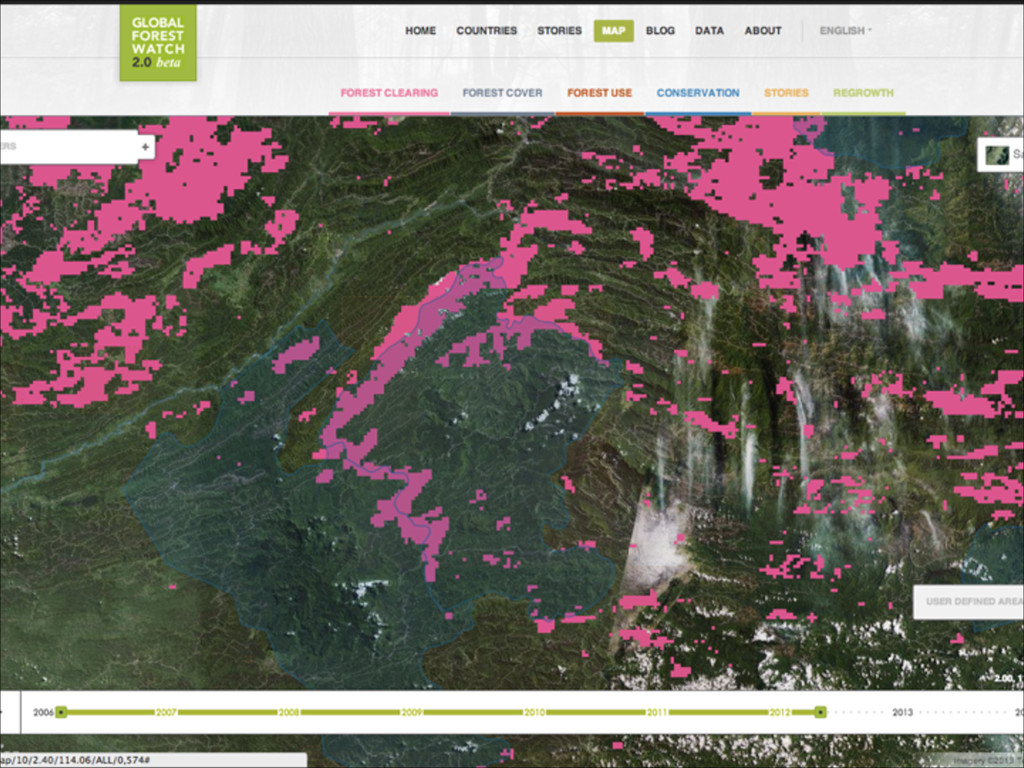
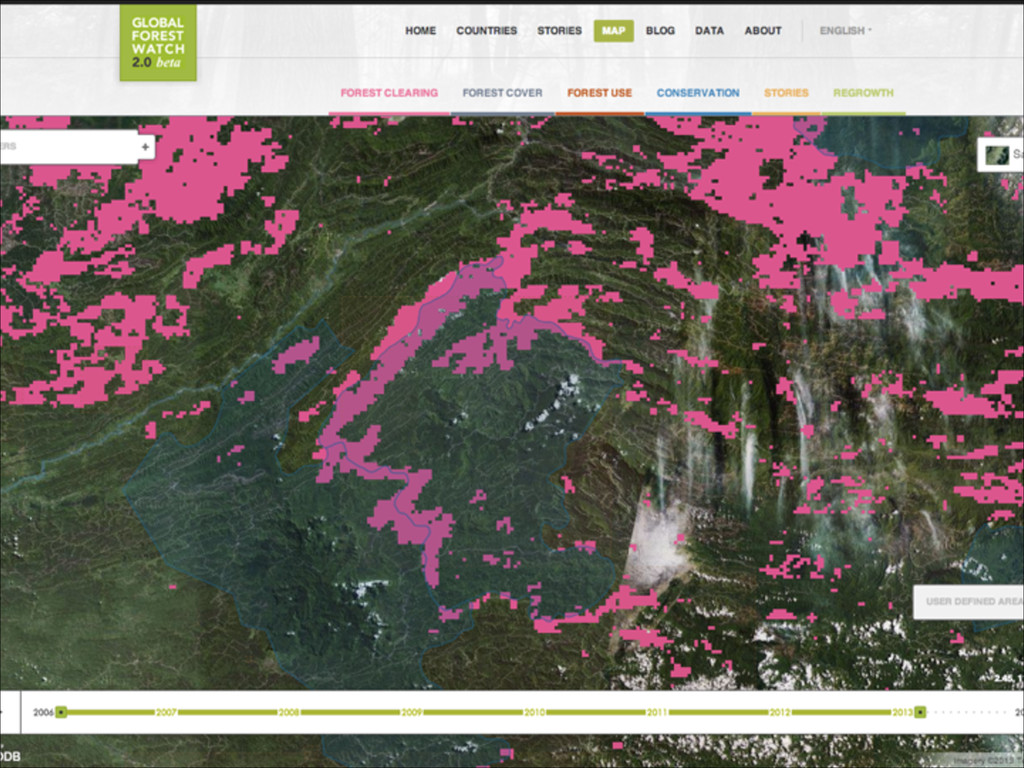
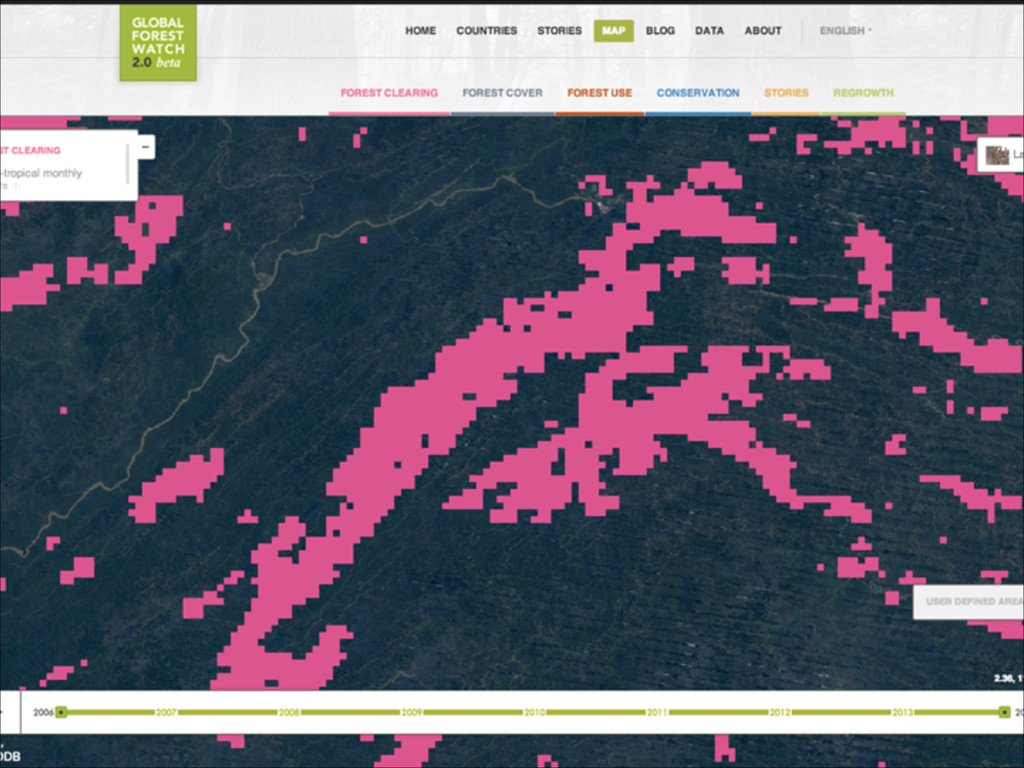
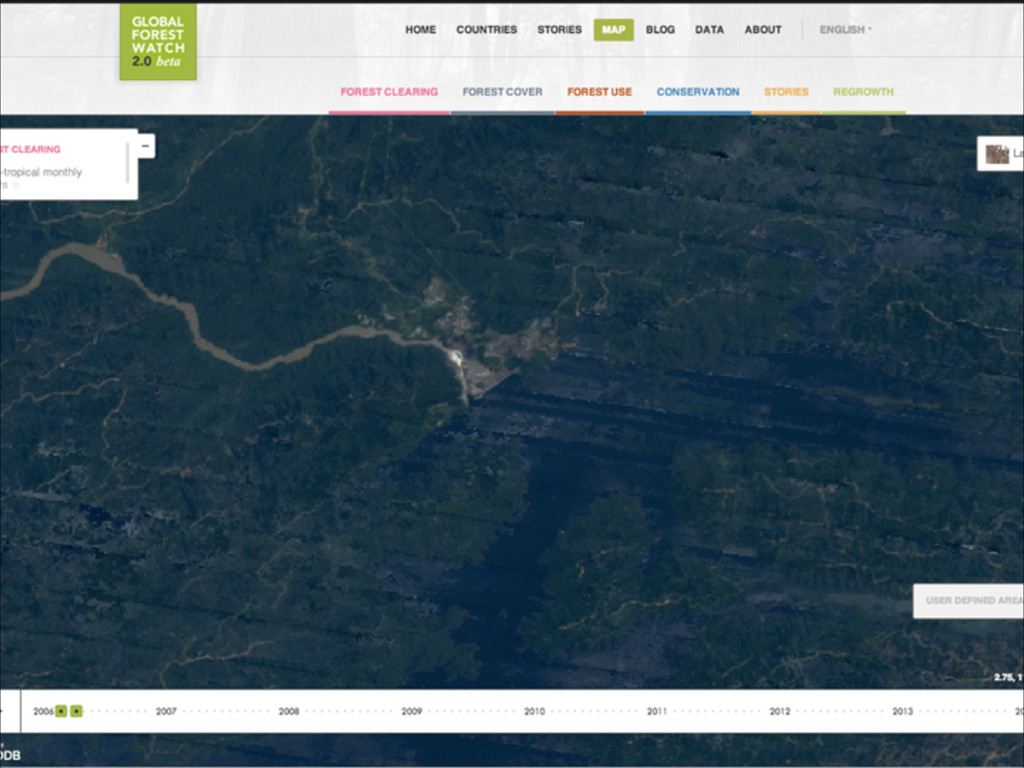
The power of visualizing time-series data derived from remote sensing products can not be overestimated. Visualization can give scientists, policy makers, journalists and others immediate insights into how the landscape and environment is changing over time and can lead to quicker understanding and action.

Big Data Spain

December 19, 2013
Tweet

More Decks by Big Data Spain

Other Decks in Technology

Transcript

  1. 4

  2. 5

  3. 6

  4. Maps are the most popular type of data visualization Everything

    happens somewhere ! Where are your clients? IP=location ! So everything can be analyzed and visualized on maps
  5. Making maps is hard because… Tools are not there yet.

    They are for GIS experts ! Handling 100 points is easy, 1Million is hard ! Data chages! Is not about printing maps online!
  6. 23

  7. Most people don’t need Big Data technologies But when you

    can’t…. when it really explodes… You just need to start collecting and analyzing data. Don’t focus on technology, probably your database can already do it ! You are not Facebook, don’t be cheat
  8. Foreign Data wrappers Connect PostgreSQL to almost anything Oracle Hadoop

    MySQL MongoDB CouchDB Redis …. Twitter Email S3
  9. WITH%hgrid% %%%%%AS%(SELECT%Cdb_rectanglegrid(Cdb_xyz_extent(8,%12,%5),% %%%%%%%%%%%%%%%%Cdb_xyz_resolution(5)%*%4,% %%%%%%%%%%%%%%%%%%%%%%%%%%%Cdb_xyz_resolution(5)%*%4)%AS%cell)% SELECT%x,% %%%%%%%y,% %%%%%%%Array_agg(c)%vals,% %%%%%%%Array_agg(d)%dates% FROM%%%(SELECT%St_xmax(hgrid.cell)%%%%%%%%%%%%%%%%%%%%%%%%%%%%%%%%%%%%%%%%%%%%x,% %%%%%%%%%%%%%%%St_ymax(hgrid.cell)%%%%%%%%%%%%%%%%%%%%%%%%%%%%%%%%%%%%%%%%%%%%y,%

    %%%%%%%%%%%%%%%Count(i.cartodb_id)%%%%%%%%%%%%%%%%%%%%%%%%%%%%%%%%%%%%%%%%%%%%c,% %%%%%%%%%%%%%%%Floor((%Date_part('epoch',%built)%Q%Q10418716800%)%/%32837875)%d% %%%%%%%%FROM%%%hgrid,% %%%%%%%%%%%%%%%us_po_offices%i% %%%%%%%%WHERE%%St_intersects(i.the_geom_webmercator,%hgrid.cell)% %%%%%%%%GROUP%%BY%hgrid.cell,% %%%%%%%%%%%%%%%%%%Floor((%Date_part('epoch',%built)%Q%Q10418716800%)%/%32837875)% %%%%%%%)%f% GROUP%%BY%x,% %%%%%%%%%%y
  10. { %%rows:%[ %%{ %%%%x:%0, %%%%y:%0, %%%%vals:%[2], %%%%dates:%[457] %%}, %%{ %%%%x:%1,

    %%%%y:%0, %%%%vals:%[1,1,4], %%%%dates:%[2,3,4] %%%%} %%] }
  11. 1 10 100 1000 3mb 70mb 300mb 1.5 2 1.2

    300 70 3 Raw Datacube Payload sizes
  12. Think on the value of location on your data, and

    use it! Is very likely you have geospatial data already ! Complete the big data cycle: Don't forget data visualization ! Find the stories inside the data and show them!