Evaluating human impacts in the presence of internal climate variability Riley X. Brady University of South Carolina Acknowledgements: NOAA Hollings Scholarship Program Ryan Rykaczewski (U. South Carolina) Michael Alexander (NOAA ESRL) Jamie Scott (NOAA ESRL) Giuliana Turi (NOAA ESRL)
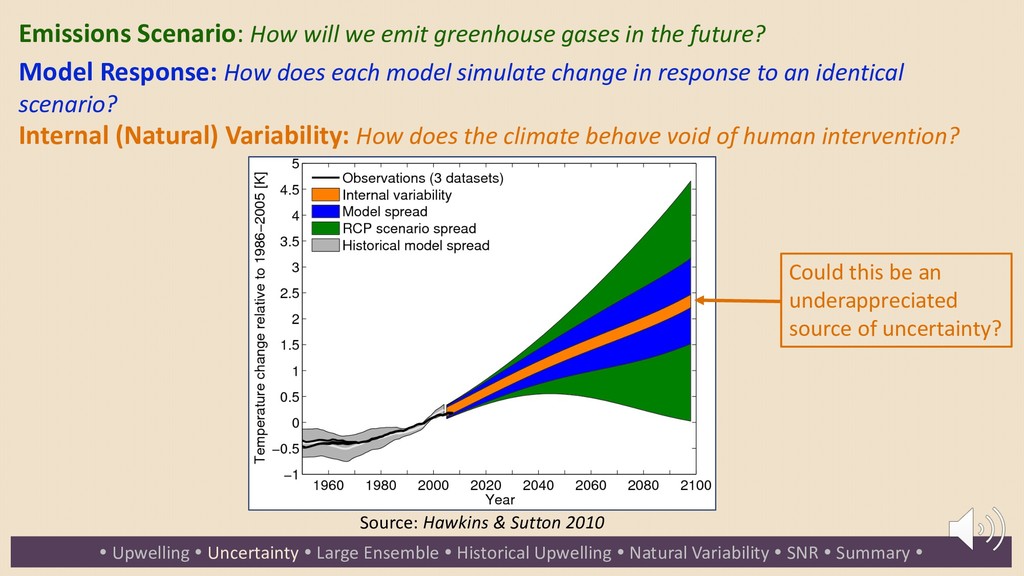
Natural Variability SNR Summary Emissions Scenario: How will we emit greenhouse gases in the future? Model Response: How does each model simulate change in response to an identical scenario? Internal (Natural) Variability: How does the climate behave void of human intervention? Source: Hawkins & Sutton 2010 Could this be an underappreciated source of uncertainty?
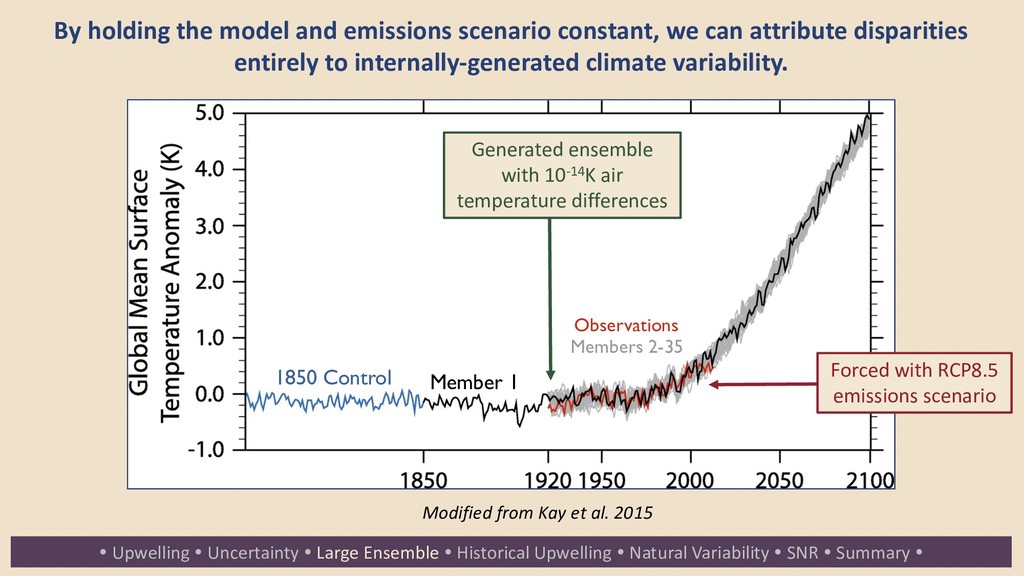
Natural Variability SNR Summary By holding the model and emissions scenario constant, we can attribute disparities entirely to internally-generated climate variability. Modified from Kay et al. 2015 1850 Control Member 1 Observations Members 2-35 Generated ensemble with 10-14K air temperature differences Forced with RCP8.5 emissions scenario
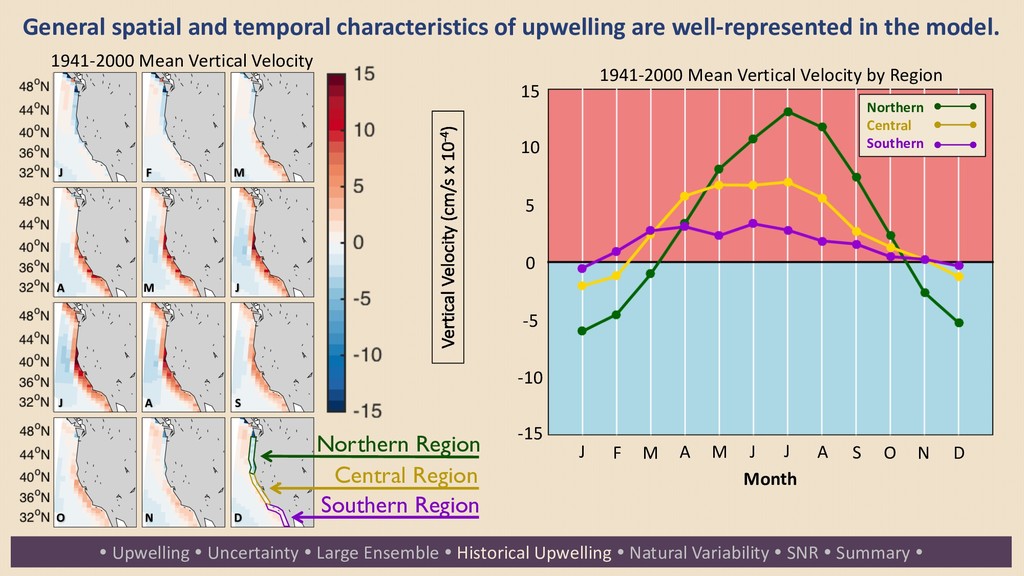
Natural Variability SNR Summary J F M A M J J A S O N D Vertical Velocity (cm/s x 10-4) General spatial and temporal characteristics of upwelling are well-represented in the model. Northern Region Central Region Southern Region J F M A M J J A S O N D Month 15 10 5 0 -5 -10 -15 1941-2000 Mean Vertical Velocity Northern Central Southern 1941-2000 Mean Vertical Velocity by Region
Natural Variability SNR Summary J F M A M J J A S O N D Vertical Velocity (cm/s x 10-4) General spatial and temporal characteristics of upwelling are well-represented in the model. Northern Region Central Region Southern Region J F M A M J J A S O N D Month 15 10 5 0 -5 -10 -15 1941-2000 Mean Vertical Velocity Northern Central Southern 1941-2000 Mean Vertical Velocity by Region
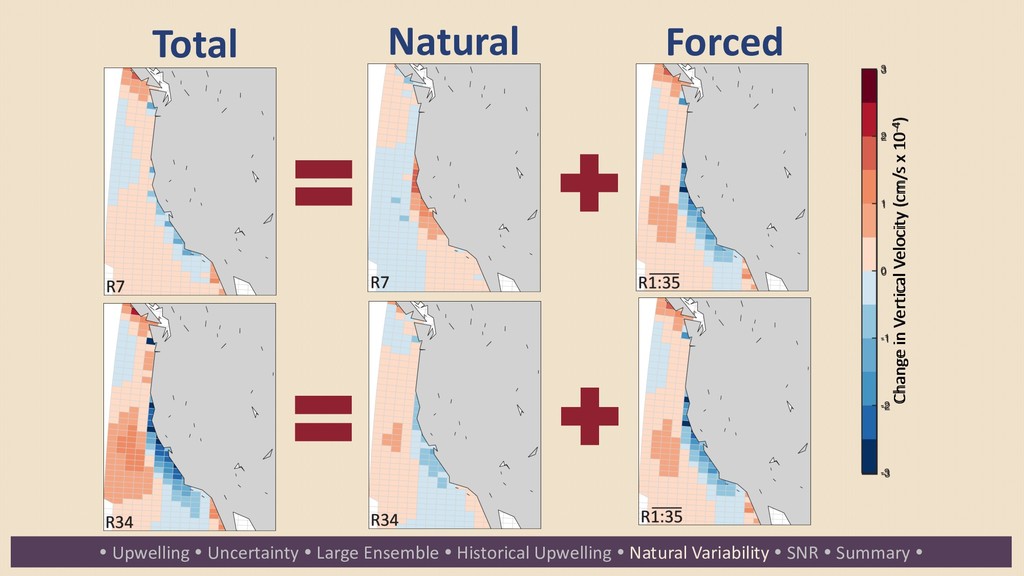
Natural Variability SNR Summary Change in Vertical Velocity (cm/s x 10-4) June Total Change in Upwelling (2041-2100) – (1941-2000) June Natural Change in Upwelling (2041-2100) – (1941-2000) Forced Natural Total Change in Vertical Velocity (cm/s x 10-4)
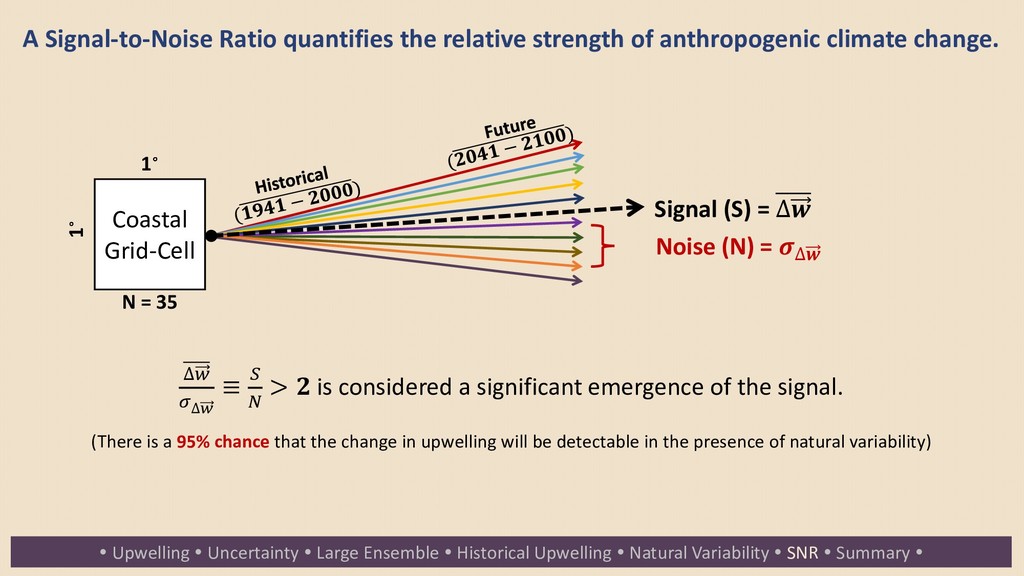
Natural Variability SNR Summary Coastal Grid-Cell A Signal-to-Noise Ratio quantifies the relative strength of anthropogenic climate change. Signal (S) = ∆ Noise (N) = ∆ N = 35 1∘ 1∘ ∆$ %∆& ≡ ( ) > is considered a significant emergence of the signal. (There is a 95% chance that the change in upwelling will be detectable in the presence of natural variability)
Natural Variability SNR Summary Changes in upwelling vary by season and location. 46N 42N 38N 34N 30N Historical (1941-2000) 15 10 5 0 -5 -10 -15 Future (2041-2100) 4 0 -4 2 -2 Future (2041-2100) – Historical (1941-2000) J M M J S N J M M J S N J M M J S N SNR >2 Vertical Velocity (cm/s x 10-4) Change in Vertical Velocity (cm/s x 10-4)
system. Upwelling Uncertainty Large Ensemble Historical Upwelling Natural Variability SNR Summary The sign of change in upwelling may vary meridionally and seasonally. Natural variability can largely impact the magnitude of change in California Current Upwelling.
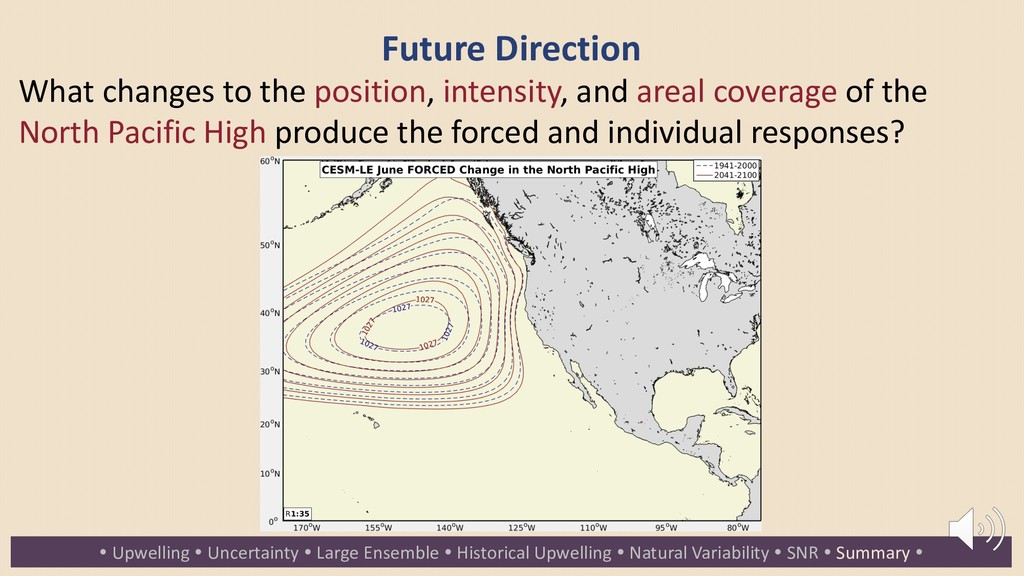
coverage of the North Pacific High produce the forced and individual responses? Upwelling Uncertainty Large Ensemble Historical Upwelling Natural Variability SNR Summary