impacts in the presence of internal climate variability Riley X. Brady University of South Carolina Acknowledgements: Ryan Rykaczewski (U. South Carolina) Michael Alexander (NOAA ESRL) Jamie Scott (NOAA ESRL) Giuliana Turi (NOAA ESRL)
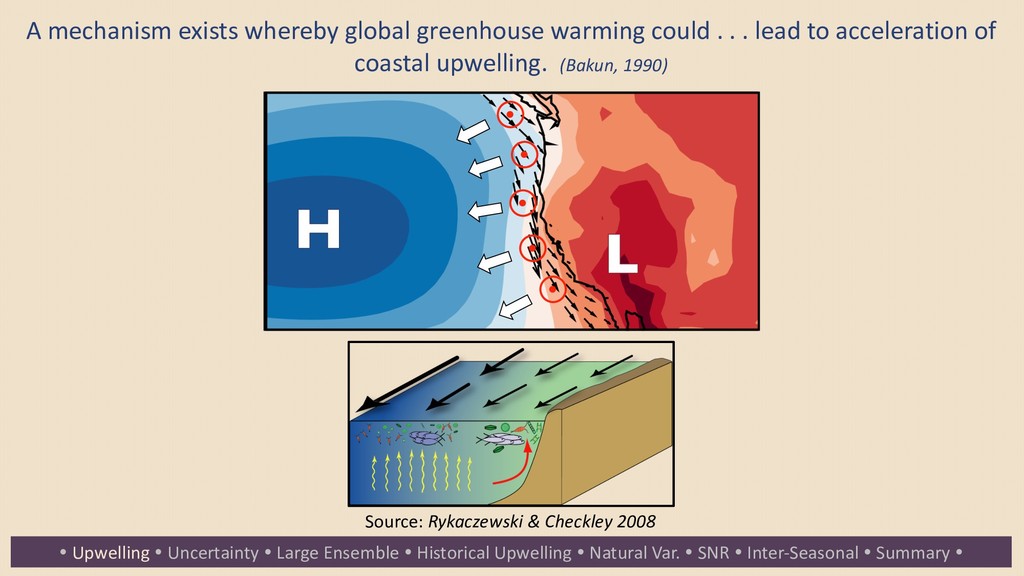
Natural Var. SNR Inter-Seasonal Summary A mechanism exists whereby global greenhouse warming could . . . lead to acceleration of coastal upwelling. (Bakun, 1990) Source: Rykaczewski & Checkley 2008
Natural Var. SNR Inter-Seasonal Summary Emissions Scenario: How will we emit greenhouse gases in the future? Model Response: How does each model simulate change in response to an identical scenario? Internal (Natural) Variability: How does the climate behave void of human intervention? Source: Hawkins & Sutton 2010 Could this be an underappreciated source of uncertainty?
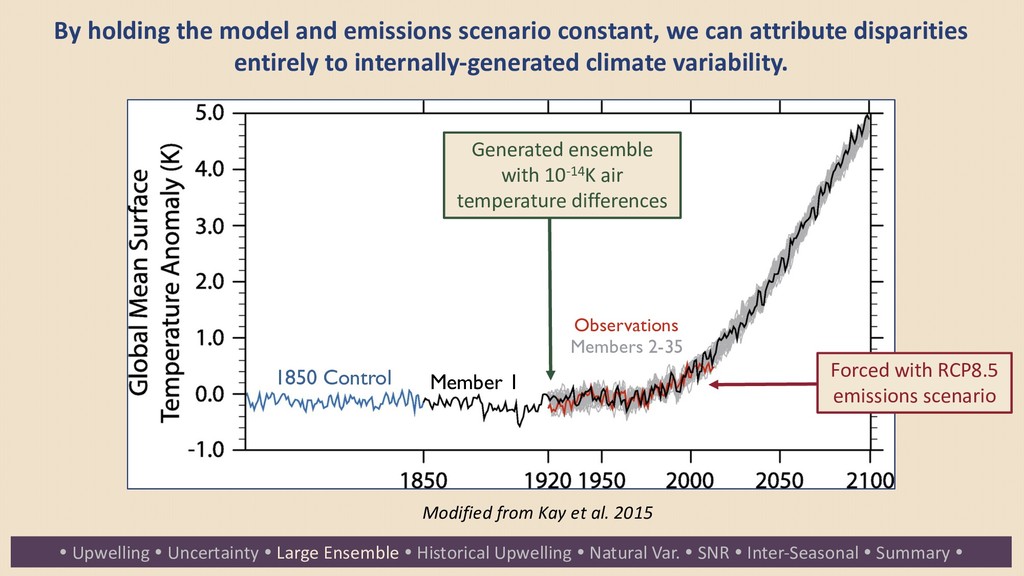
Natural Var. SNR Inter-Seasonal Summary By holding the model and emissions scenario constant, we can attribute disparities entirely to internally-generated climate variability. Modified from Kay et al. 2015 1850 Control Member 1 Observations Members 2-35 Generated ensemble with 10-14K air temperature differences Forced with RCP8.5 emissions scenario
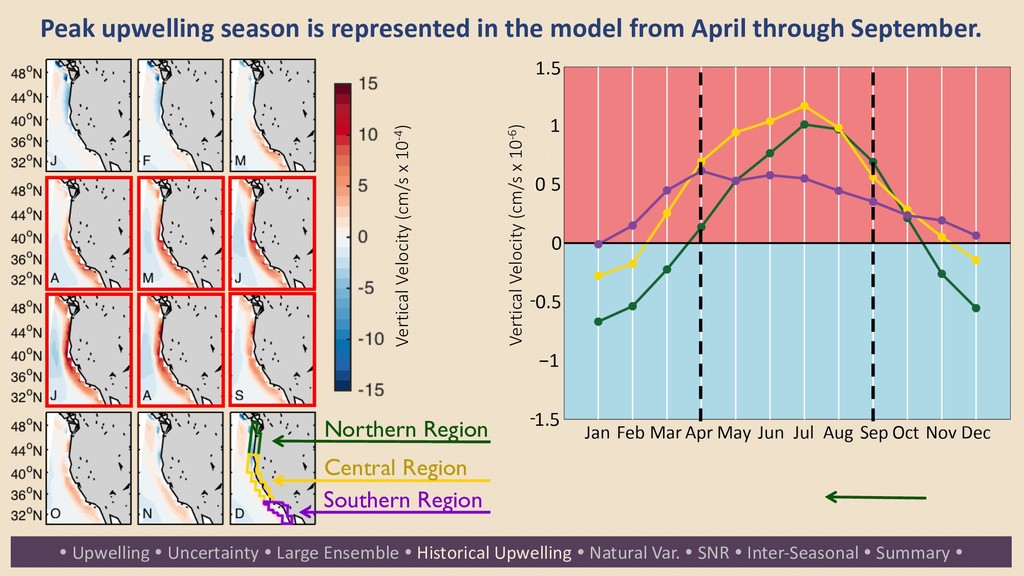
Natural Var. SNR Inter-Seasonal Summary Peak upwelling season is represented in the model from April through September. Southern Region Central Region Northern Region Vertical Velocity (cm/s x 10-4) Vertical Velocity (cm/s x 10-6) - -
Natural Var. SNR Inter-Seasonal Summary Change in Vertical Velocity (cm/s x 10-4) June Total Change in Upwelling (2041-2100) – (1941-2000) June Natural Change in Upwelling (2041-2100) – (1941-2000) Total Natural Forced Change in Vertical Velocity (cm/s x 10-4)
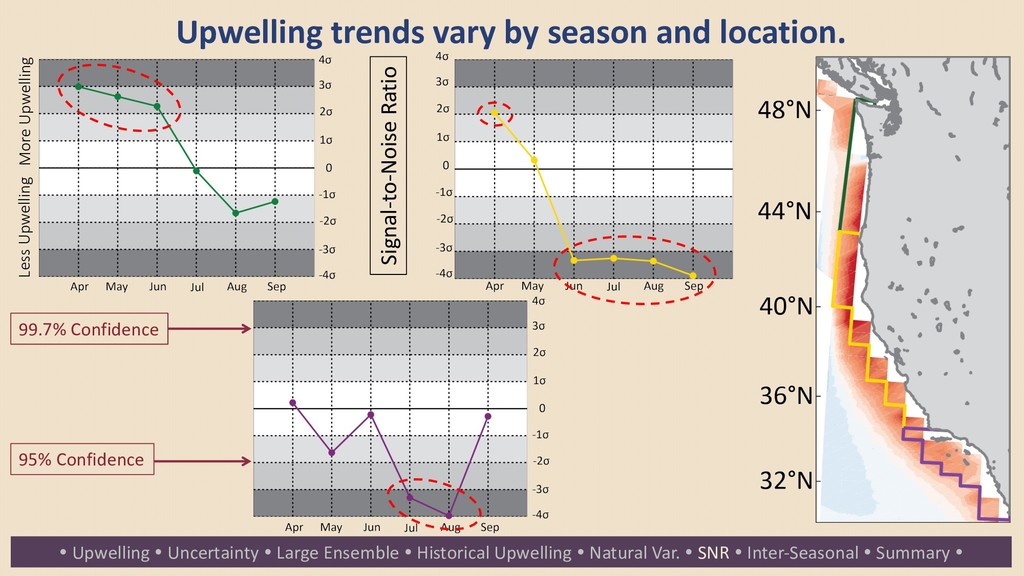
Natural Var. SNR Inter-Seasonal Summary Upwelling trends vary by season and location. Signal-to-Noise Ratio 95% Confidence 99.7% Confidence More Upwelling Less Upwelling
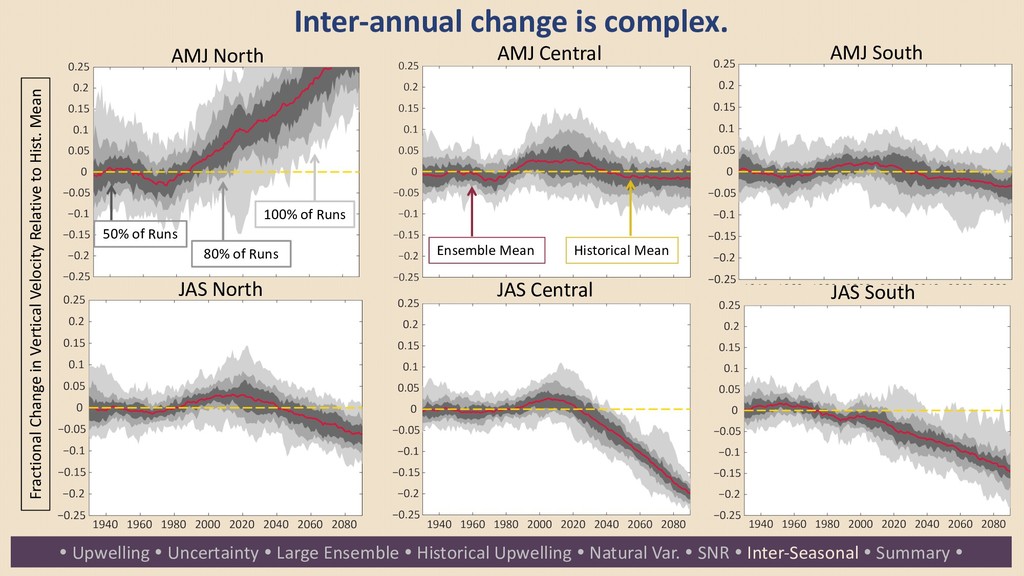
Natural Var. SNR Inter-Seasonal Summary Inter-annual change is complex. Fractional Change in Vertical Velocity Relative to Hist. Mean AMJ Central JAS Central AMJ North AMJ South JAS North JAS South 100% of Runs 80% of Runs 50% of Runs Historical Mean Ensemble Mean
in an upwelling system. Upwelling Uncertainty Large Ensemble Historical Upwelling Natural Var. SNR Inter-Seasonal Summary The sign of change in upwelling may vary meridionally and seasonally. Decadal changes are not necessarily indicative of long-term trends.
poleward shift in the North Pacific High? Upwelling Uncertainty Large Ensemble Historical Upwelling Natural Var. SNR Inter-Seasonal Summary Are differences between individual runs attributable to known natural climate oscillations?