Upgrade to Pro — share decks privately, control downloads, hide ads and more …

Why Data Science is a Science

Avatar for canagnos canagnos
October 01, 2015

Why Data Science is a Science

A Science is distinct from a trade or an art in that decisions and processes are guided by theoretical principles and the objective is to gain knowledge and understanding. In the last few years, Data Science is coming together as a distinct science encompassing elements of Statistics, Computer Science and other disciplines. In the era of "Big Data" we critically review the state-of-the-art and offer our view of what it means to be a Data Scientist in 2015. This talk was presented in the inaugural meeting of the Athens Data Science meetup, to mark the start of a hub of innovation in Data Science in Athens, Greece.

Avatar for canagnos

canagnos

October 01, 2015

Other Decks in Technology

Transcript

  1. Why Data Science is a Science Dr. Christoforos Anagnostopoulos Founder
    and Chief Data Scientist, Mentat Innovations Lecturer in Statistics (on leave), Imperial College London Mentat Innovations
  2. Credentials BA Mathematics at Cambridge University MSc Machine Learning at

    Edinburgh University MSc Logic and Computer Science at Athens University PhD in Machine Learning for Data Streams at Imperial Postdoc Fellow at Statistical Laboratory, Cambridge Uni. Lecturer in Statistics at Imperial College Founder and Chief Scientist of Mentat Innovations
  3. Credentials PhD in Machine Learning for Data Streams at Imperial

    Postdoc Fellow at Statistical Laboratory, Cambridge Uni. Lecturer in Statistics at Imperial College Founder and Chief Scientist of Mentat Innovations Numerous consulting projects in real-time data analysis: • social media analysis, sensor network telemetry, online RTB advertising, cybersecurity and fraud, retail banking • engaged with data journalism on several occasions (The Independent, The Guardian, BBC, …) Mentat Innovations is pioneering real-time anomaly detection on network, application and telemetry data
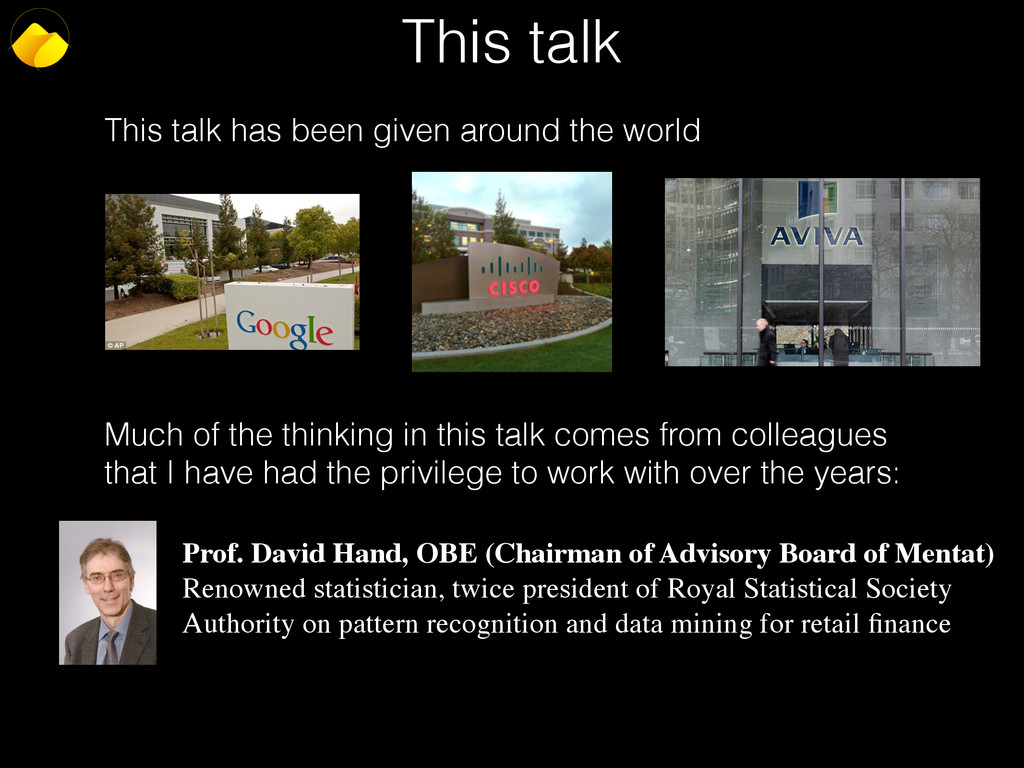
  4. This talk This talk has been given around the world

    Much of the thinking in this talk comes from colleagues that I have had the privilege to work with over the years: Prof. David Hand, OBE (Chairman of Advisory Board of Mentat) Renowned statistician, twice president of Royal Statistical Society Authority on pattern recognition and data mining for retail finance
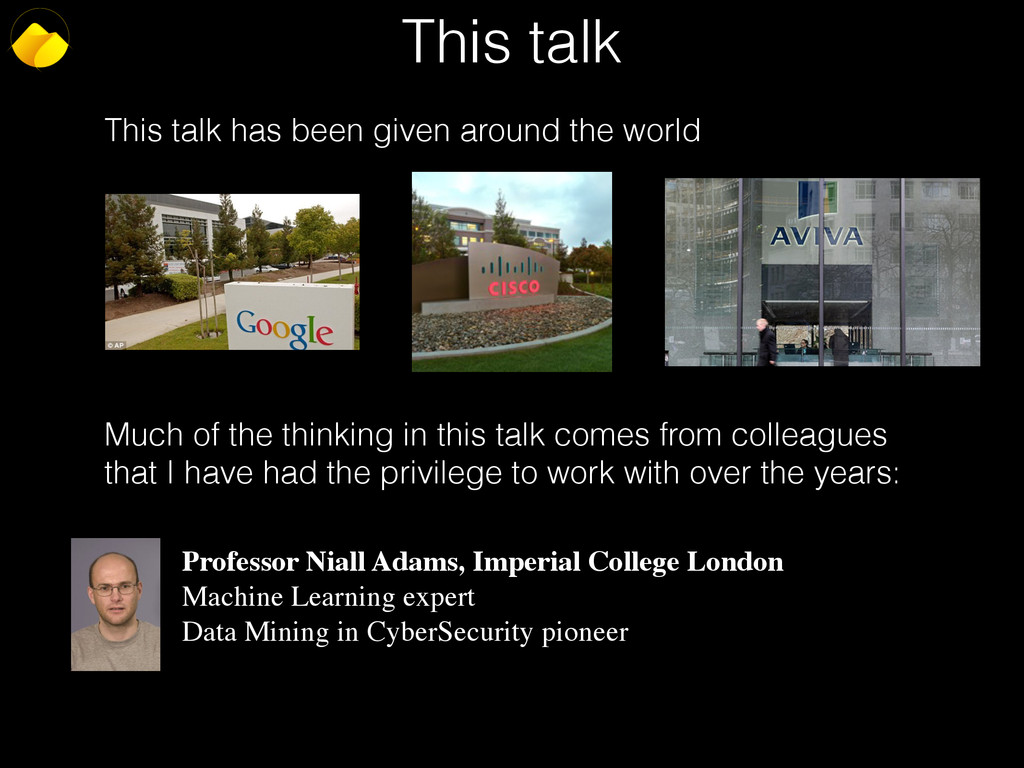
  5. This talk This talk has been given around the world

    Much of the thinking in this talk comes from colleagues that I have had the privilege to work with over the years: Professor Niall Adams, Imperial College London Machine Learning expert Data Mining in CyberSecurity pioneer
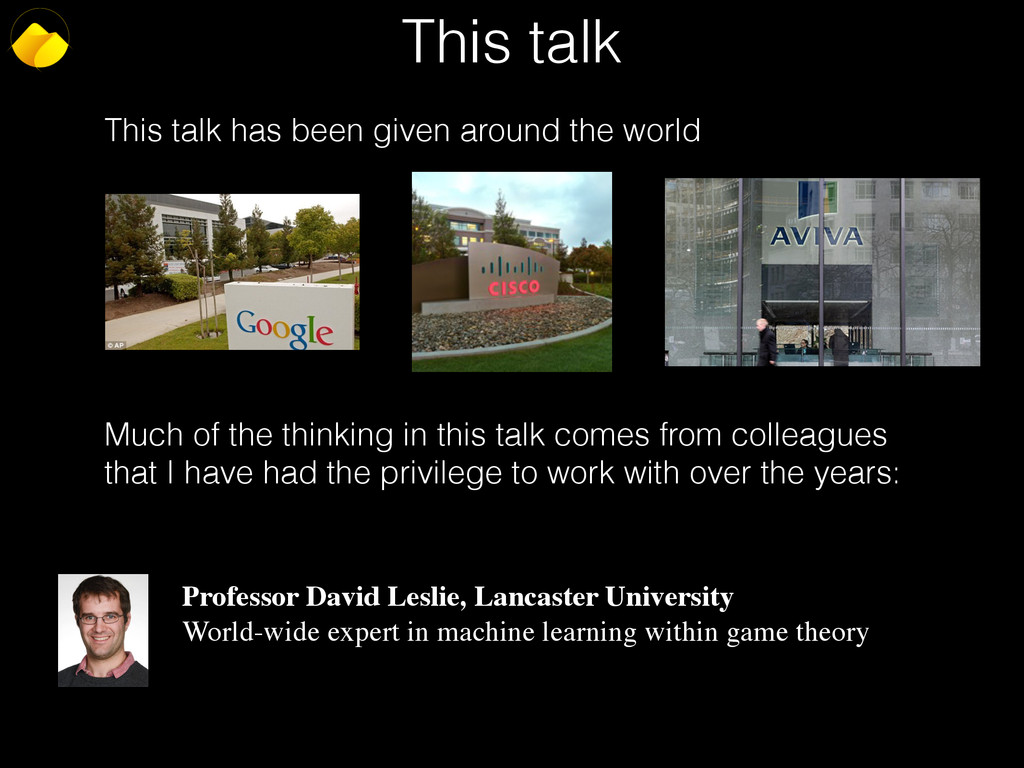
  6. This talk This talk has been given around the world

    Much of the thinking in this talk comes from colleagues that I have had the privilege to work with over the years: Professor David Leslie, Lancaster University World-wide expert in machine learning within game theory
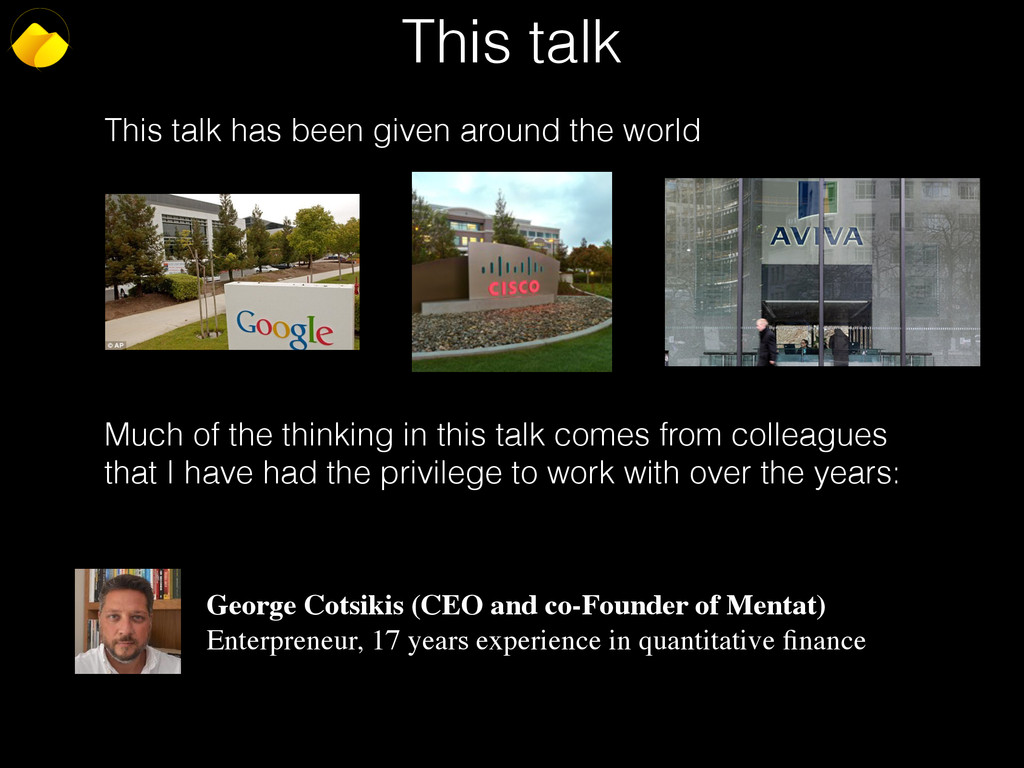
  7. This talk This talk has been given around the world

    Much of the thinking in this talk comes from colleagues that I have had the privilege to work with over the years: George Cotsikis (CEO and co-Founder of Mentat) Enterpreneur, 17 years experience in quantitative finance
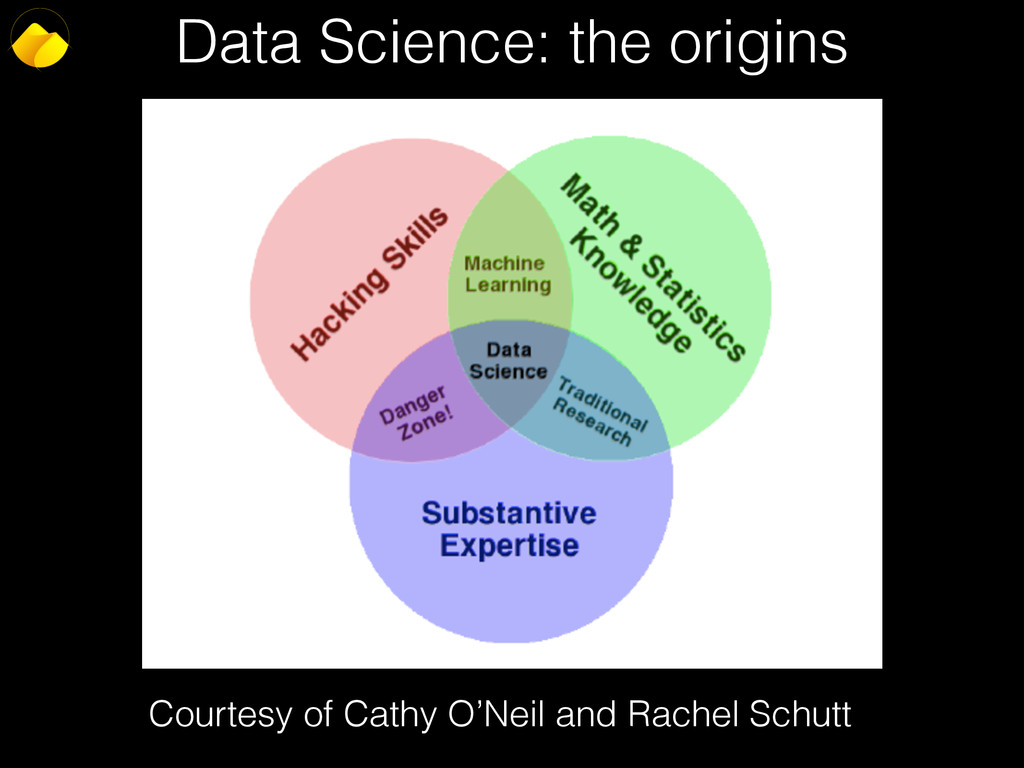
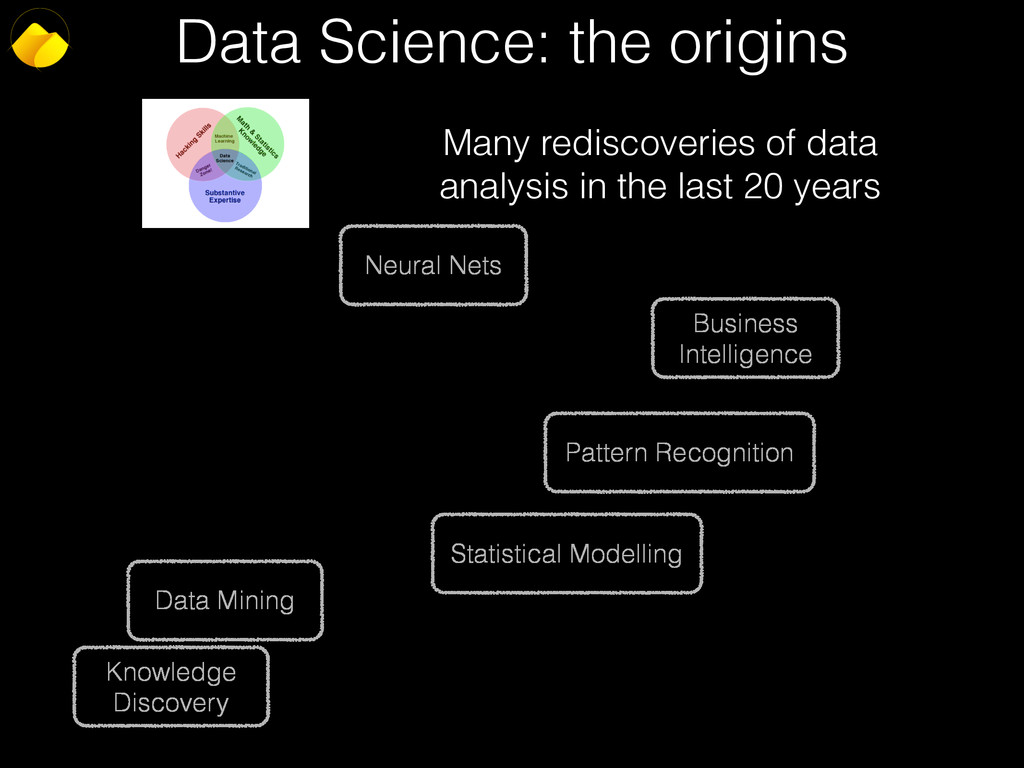
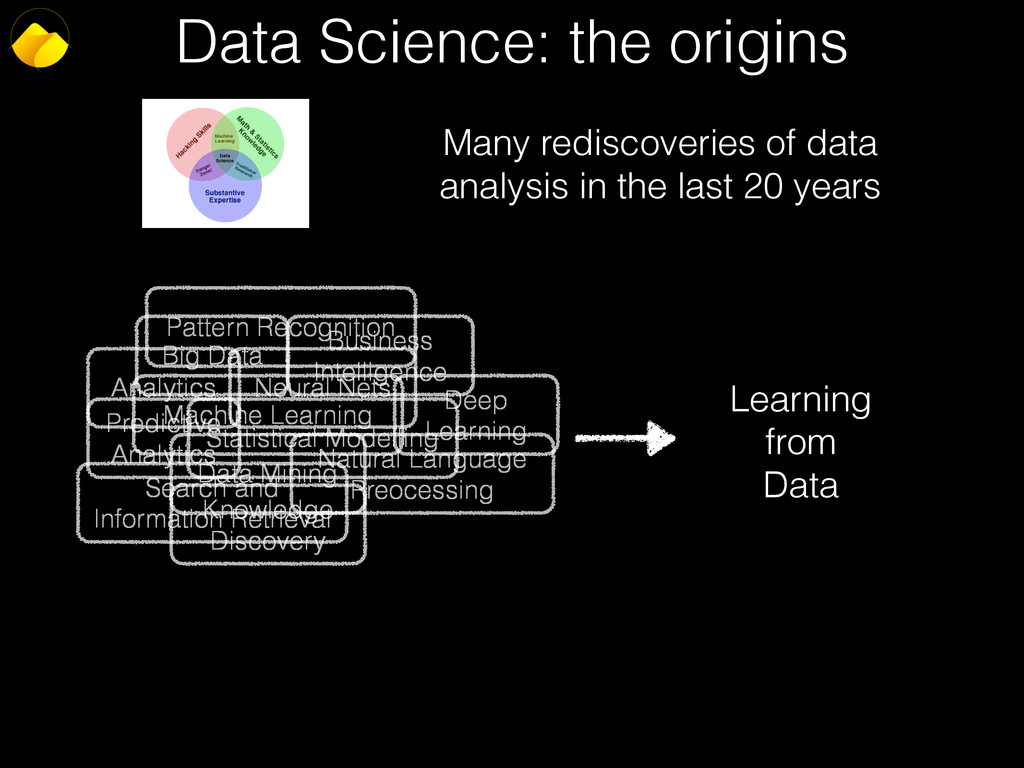
  8. Data Science: the origins Data Mining Pattern Recognition Statistical Modelling

    Business Intelligence Many rediscoveries of data analysis in the last 20 years Neural Nets Knowledge Discovery
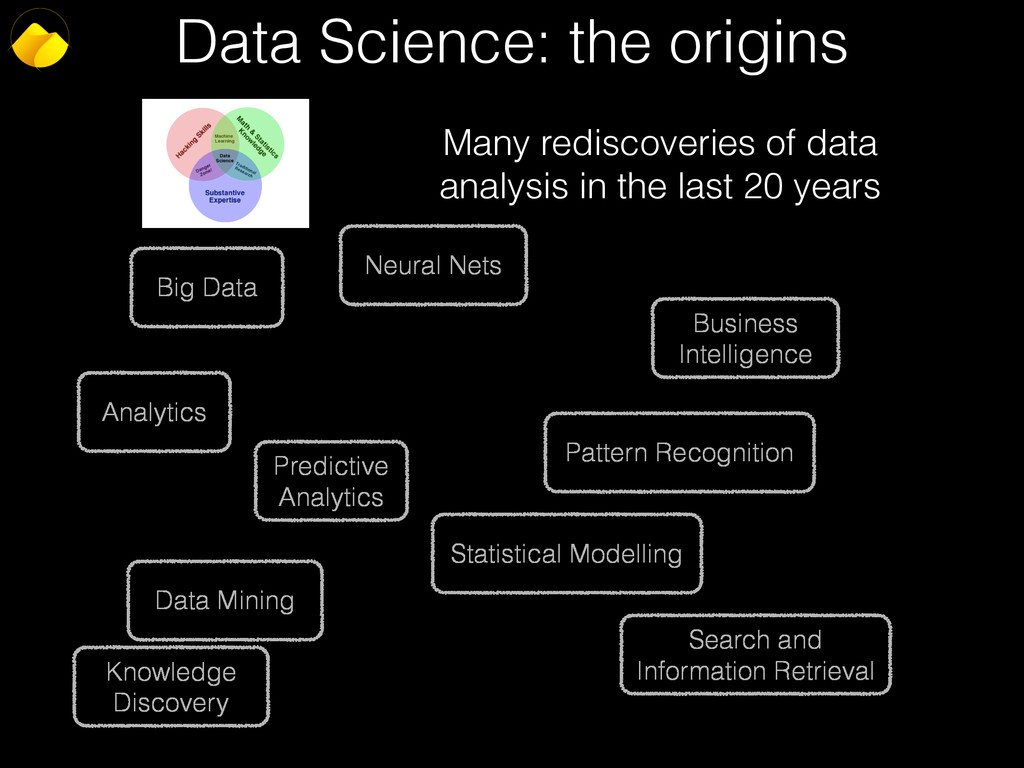
  9. Data Science: the origins Data Mining Pattern Recognition Statistical Modelling

    Analytics Business Intelligence Predictive Analytics Many rediscoveries of data analysis in the last 20 years Big Data Search and Information Retrieval Neural Nets Knowledge Discovery
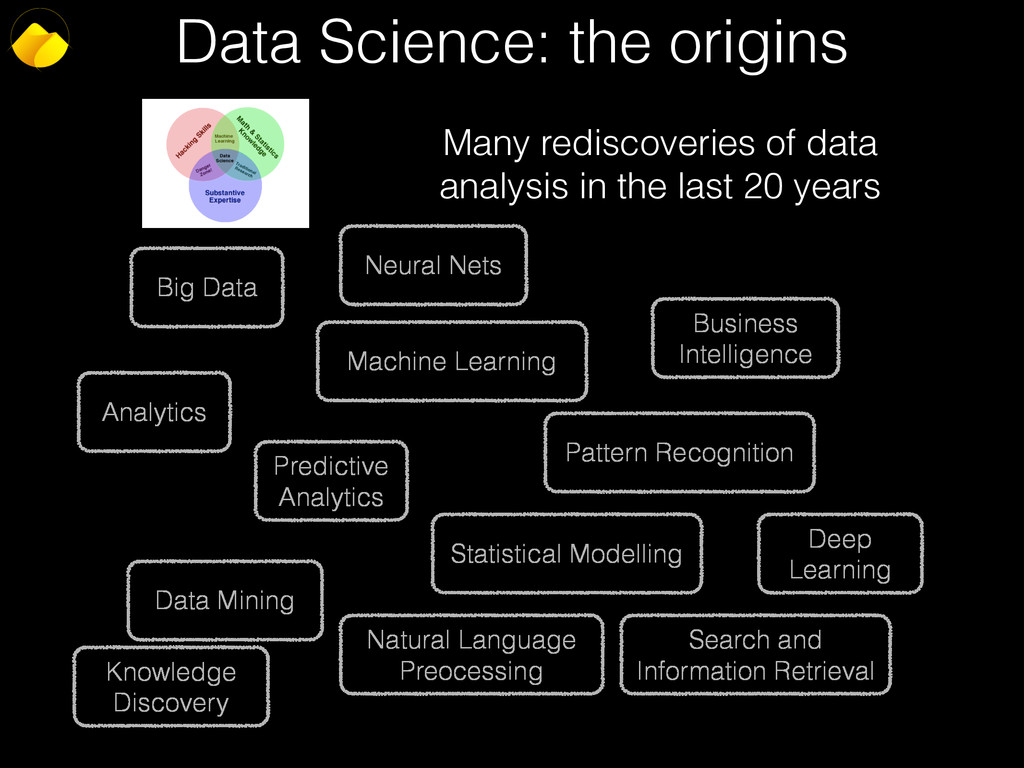
  10. Data Science: the origins Data Mining Pattern Recognition Machine Learning

    Statistical Modelling Analytics Business Intelligence Predictive Analytics Many rediscoveries of data analysis in the last 20 years Big Data Search and Information Retrieval Natural Language Preocessing Neural Nets Deep Learning Knowledge Discovery
  11. Data Science: the origins Data Mining Pattern Recognition Machine Learning

    Statistical Modelling Analytics Business Intelligence Predictive Analytics Many rediscoveries of data analysis in the last 20 years Big Data Search and Information Retrieval Natural Language Preocessing Neural Nets Deep Learning Learning from Data Knowledge Discovery
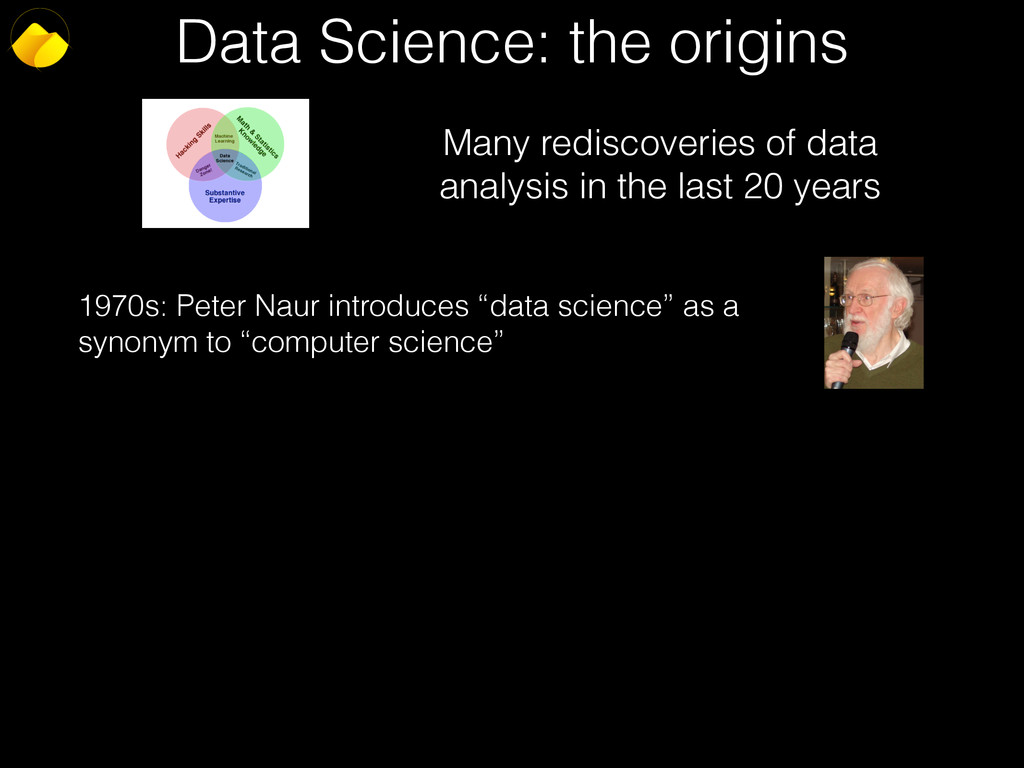
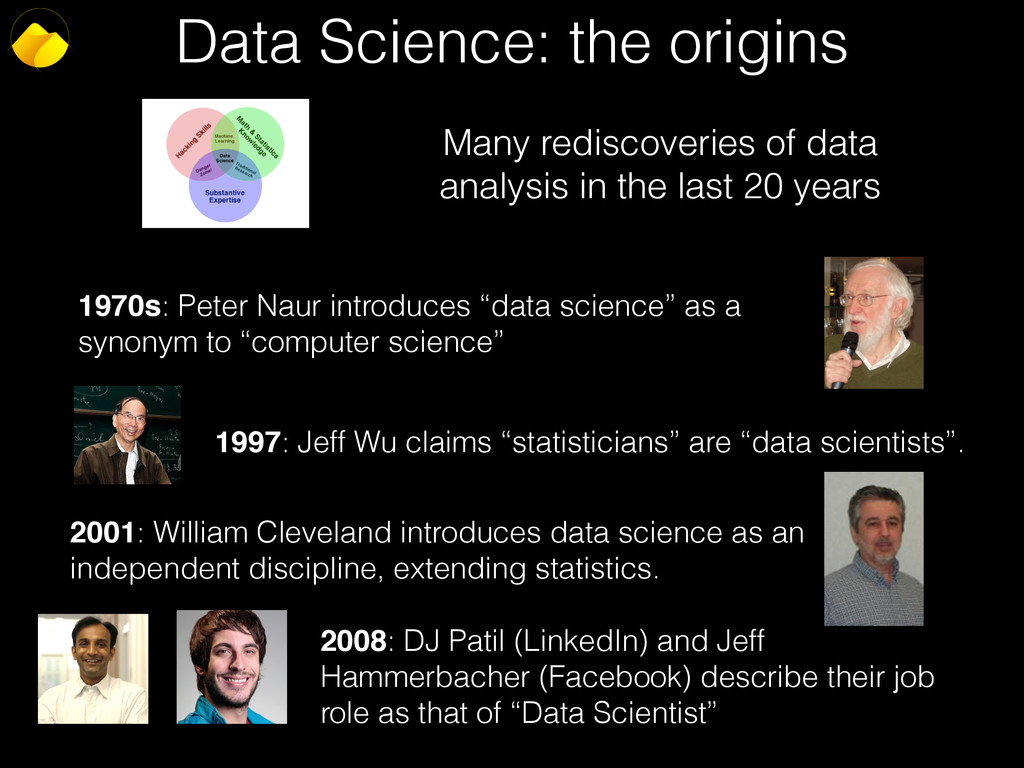
  12. Data Science: the origins Many rediscoveries of data analysis in

    the last 20 years 1970s: Peter Naur introduces “data science” as a synonym to “computer science”
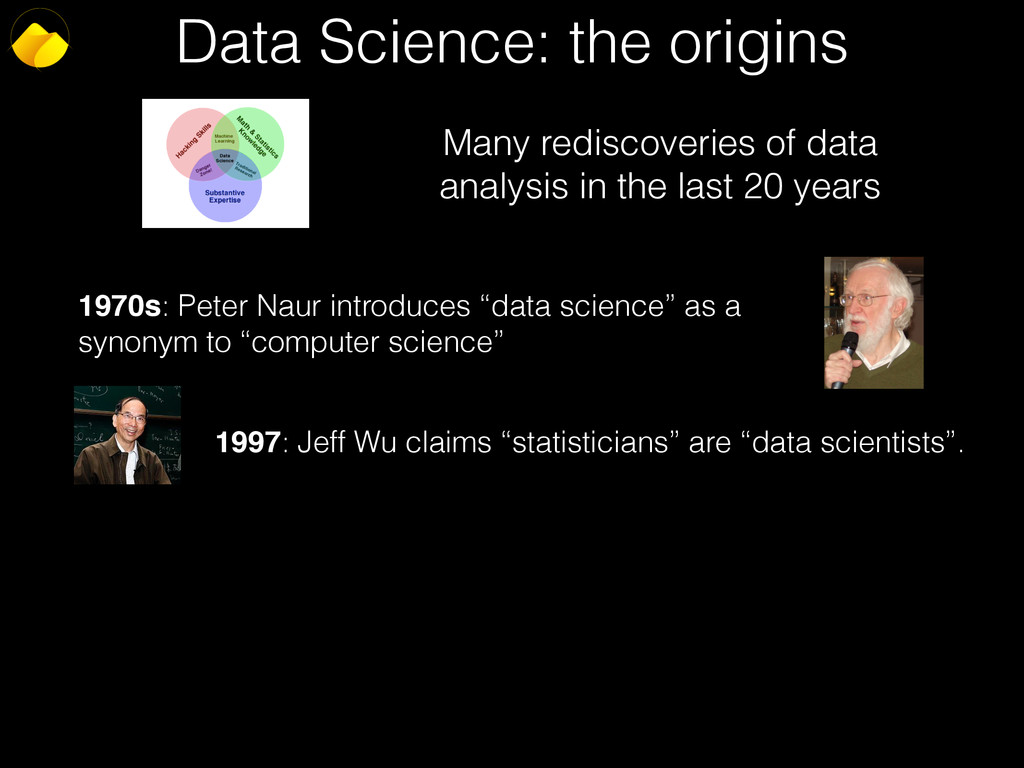
  13. Data Science: the origins Many rediscoveries of data analysis in

    the last 20 years 1970s: Peter Naur introduces “data science” as a synonym to “computer science” 1997: Jeff Wu claims “statisticians” are “data scientists”.
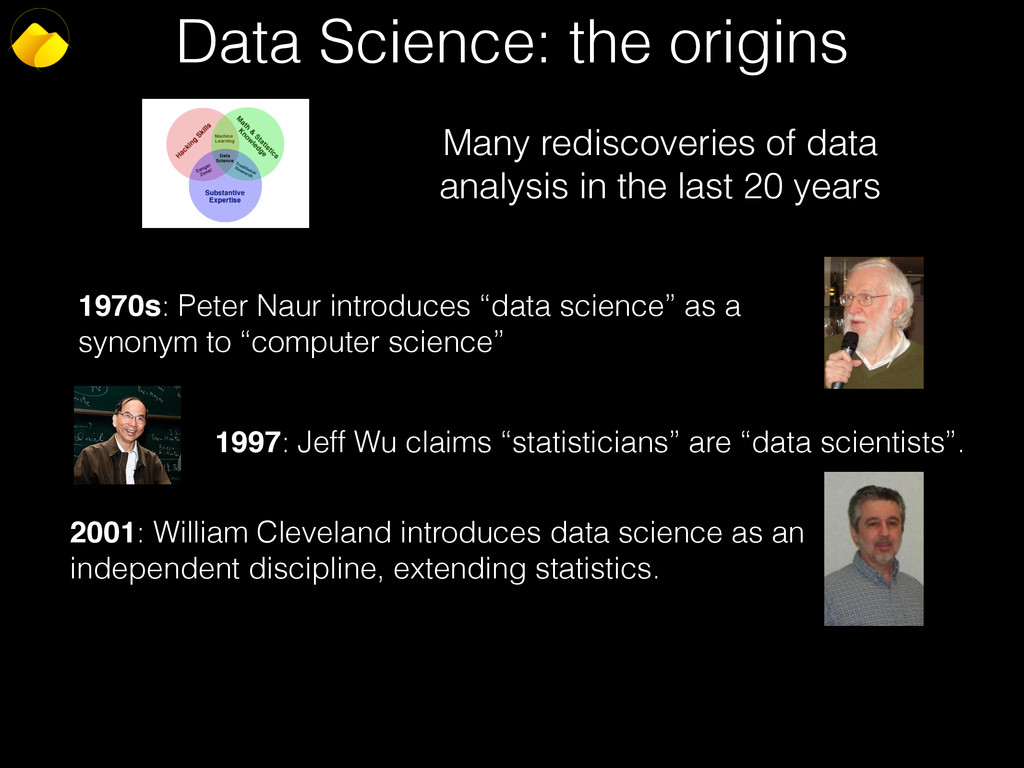
  14. Data Science: the origins Many rediscoveries of data analysis in

    the last 20 years 1970s: Peter Naur introduces “data science” as a synonym to “computer science” 1997: Jeff Wu claims “statisticians” are “data scientists”. 2001: William Cleveland introduces data science as an independent discipline, extending statistics.
  15. Data Science: the origins Many rediscoveries of data analysis in

    the last 20 years 1970s: Peter Naur introduces “data science” as a synonym to “computer science” 1997: Jeff Wu claims “statisticians” are “data scientists”. 2001: William Cleveland introduces data science as an independent discipline, extending statistics. 2008: DJ Patil (LinkedIn) and Jeff Hammerbacher (Facebook) describe their job role as that of “Data Scientist”
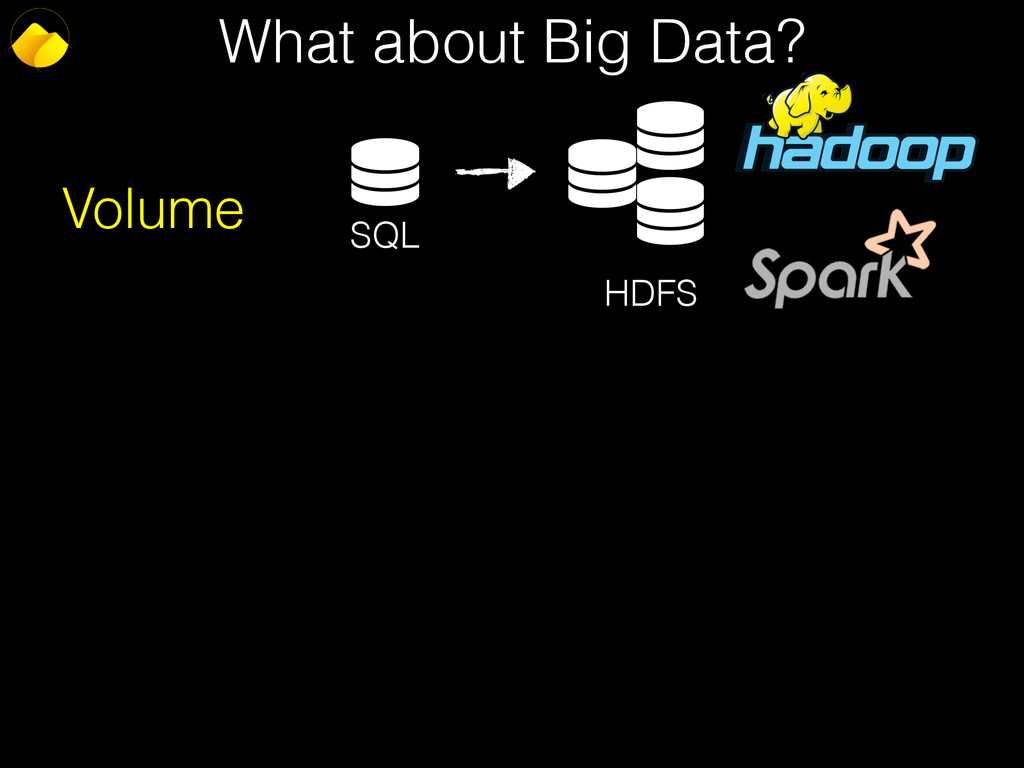
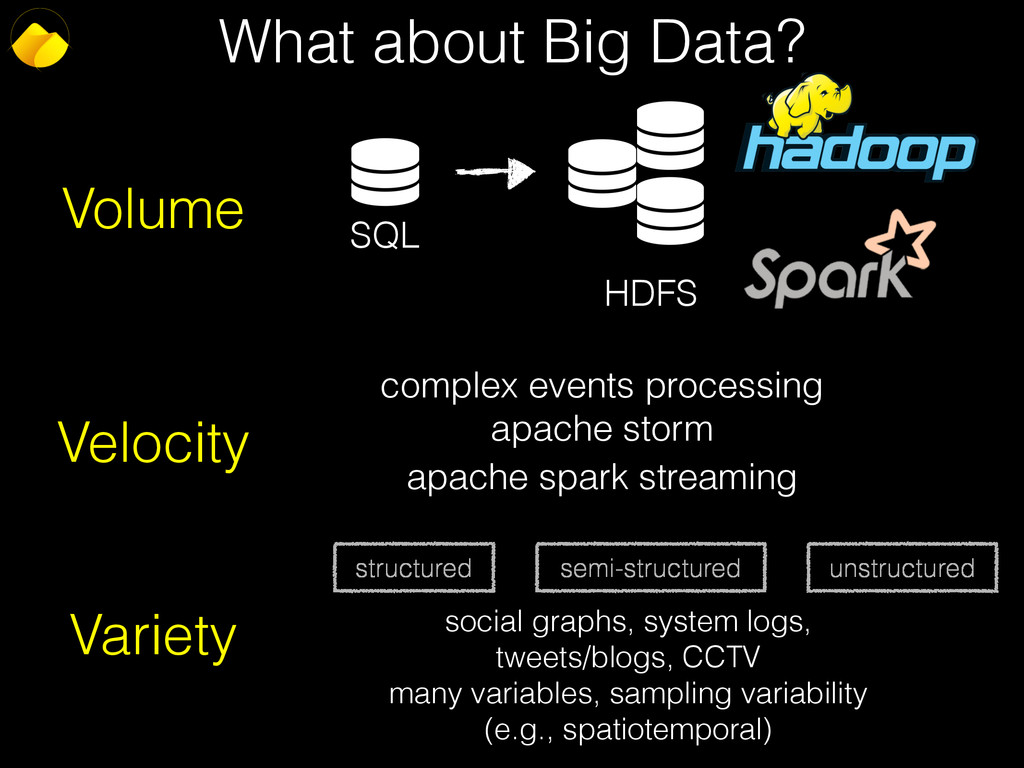
  16. What about Big Data? Volume SQL HDFS Velocity complex events

    processing apache storm apache spark streaming
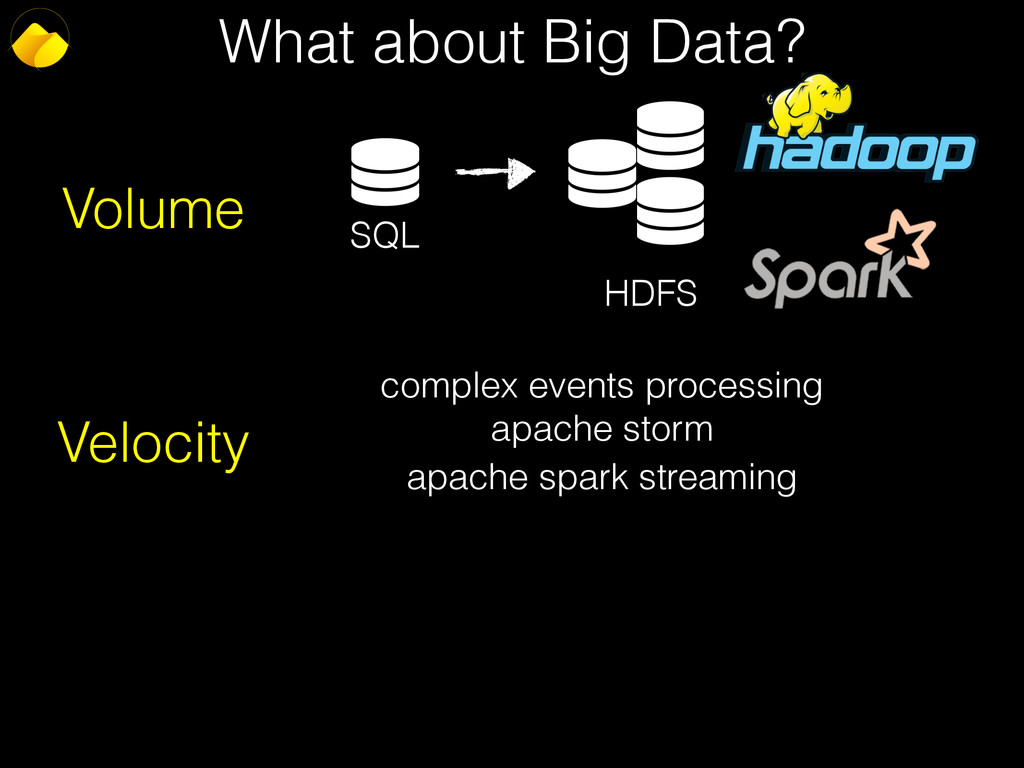
  17. What about Big Data? Volume SQL HDFS Velocity complex events

    processing apache storm apache spark streaming Variety structured semi-structured unstructured social graphs, system logs, tweets/blogs, CCTV many variables, sampling variability (e.g., spatiotemporal)
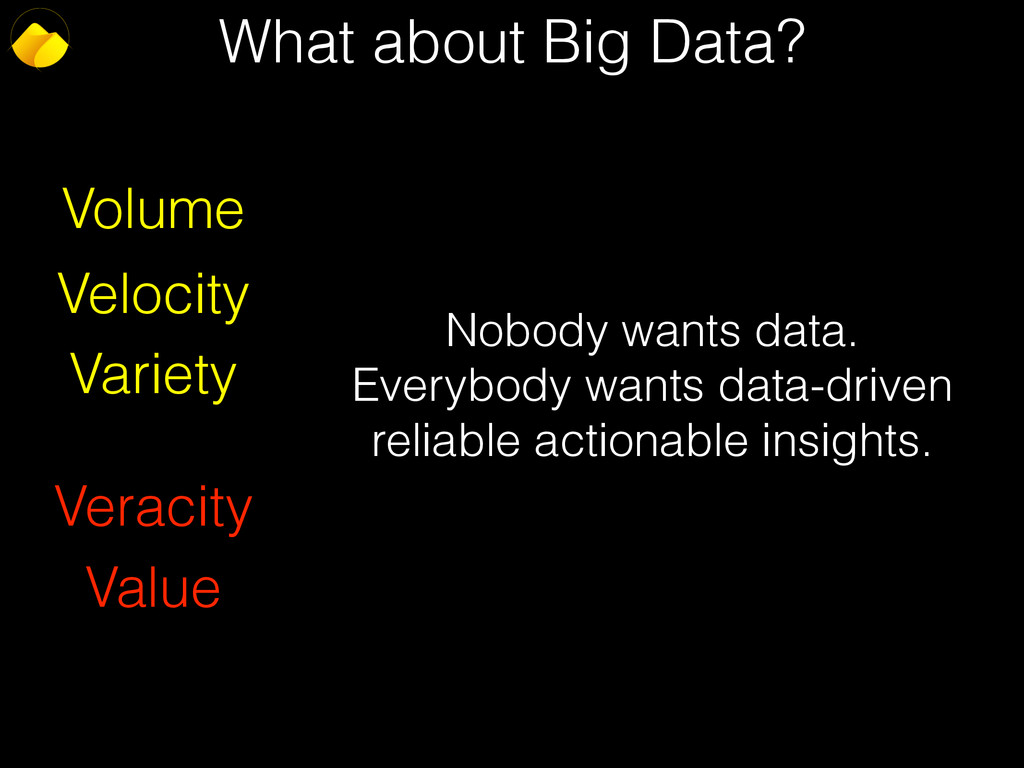
  18. What about Big Data? Volume Velocity Variety Veracity Value Nobody

    wants data. Everybody wants data-driven reliable actionable insights.
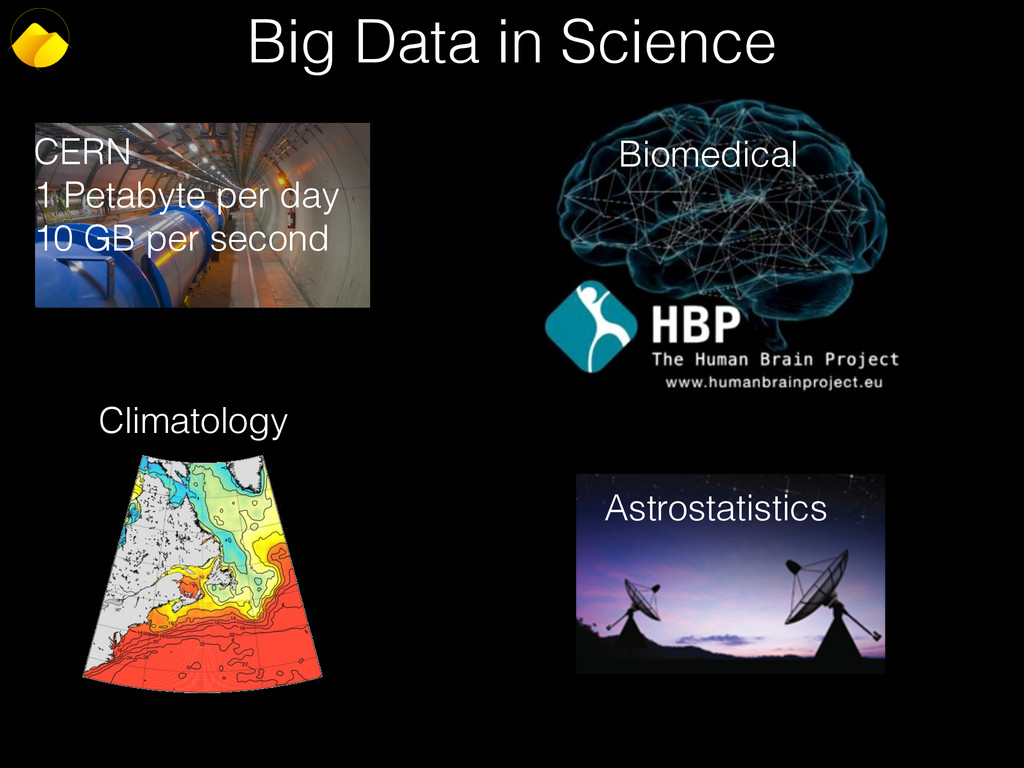
  19. Big Data in Science CERN 1 Petabyte per day 10

    GB per second Astrostatistics Biomedical Climatology
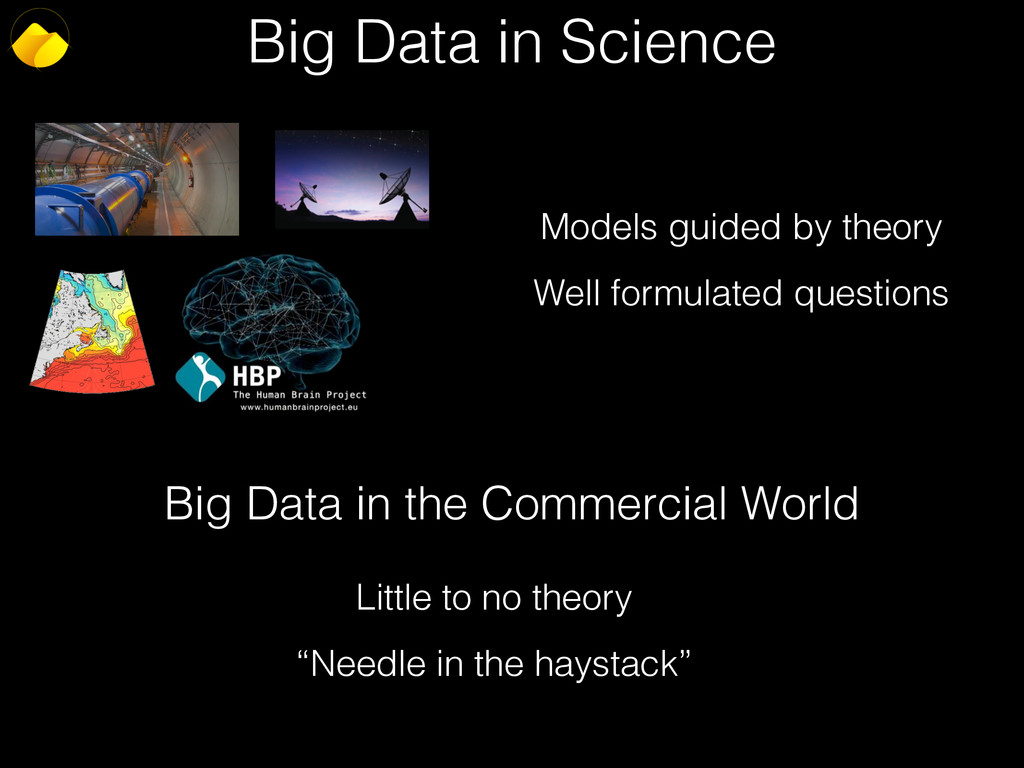
  20. Big Data in Science Models guided by theory Well formulated

    questions Big Data in the Commercial World Little to no theory “Needle in the haystack”
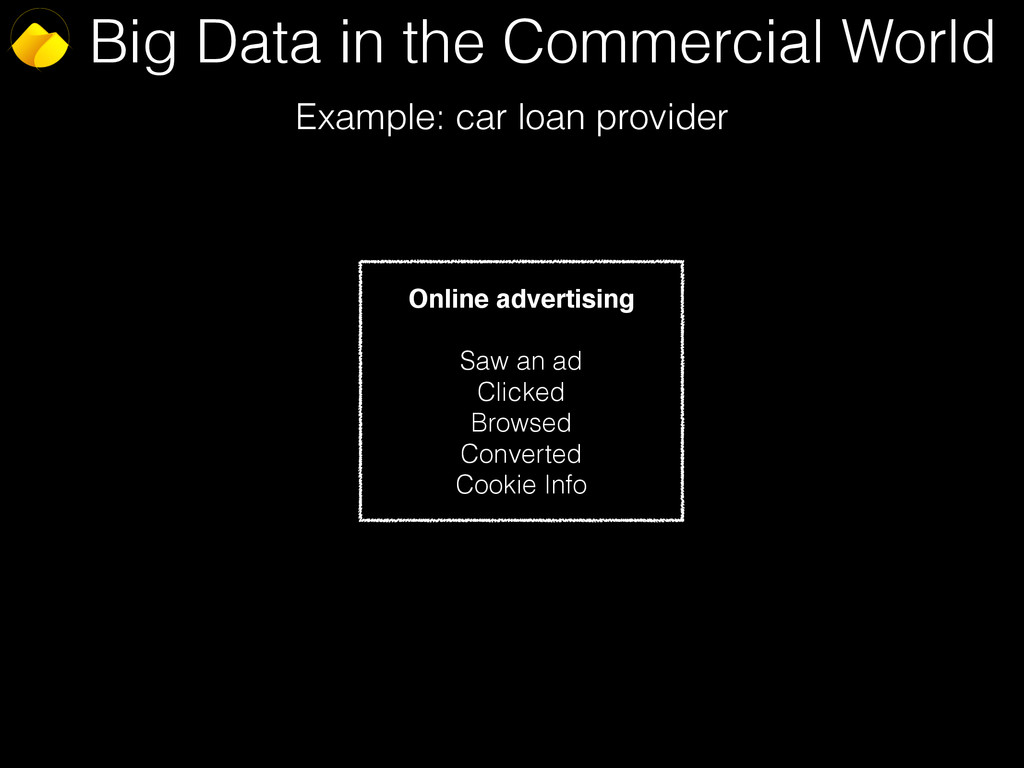
  21. Big Data in the Commercial World Example: car loan provider

    Online advertising Saw an ad Clicked Browsed Converted Cookie Info
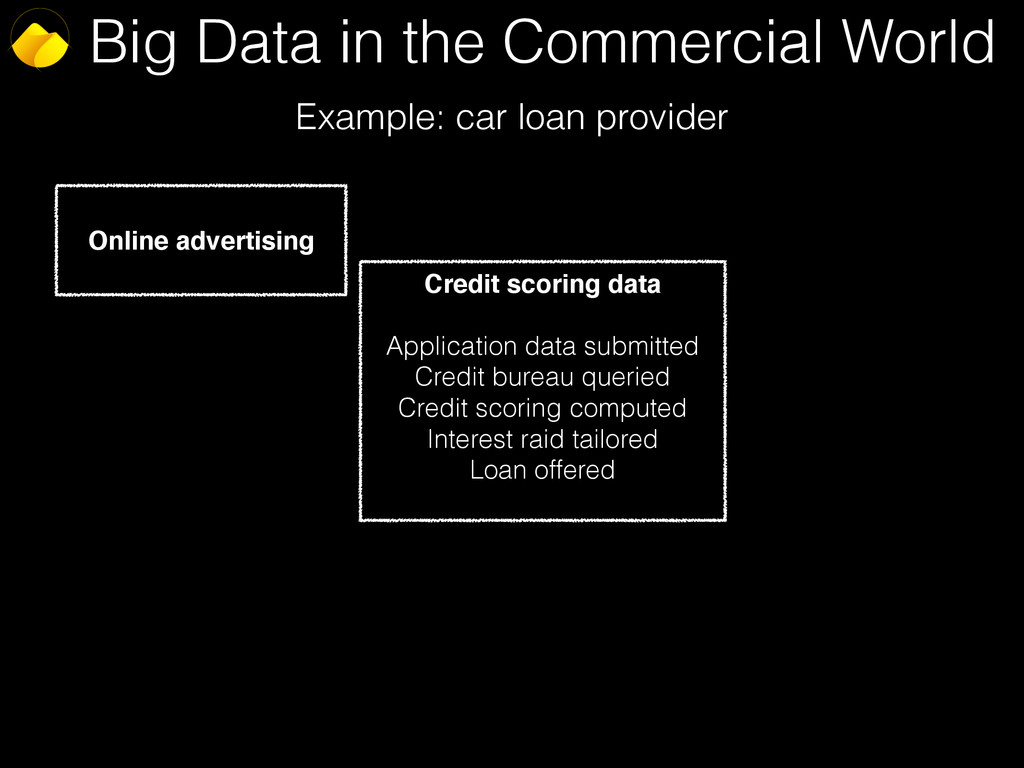
  22. Big Data in the Commercial World Example: car loan provider

    Online advertising Credit scoring data Application data submitted Credit bureau queried Credit scoring computed Interest raid tailored Loan offered
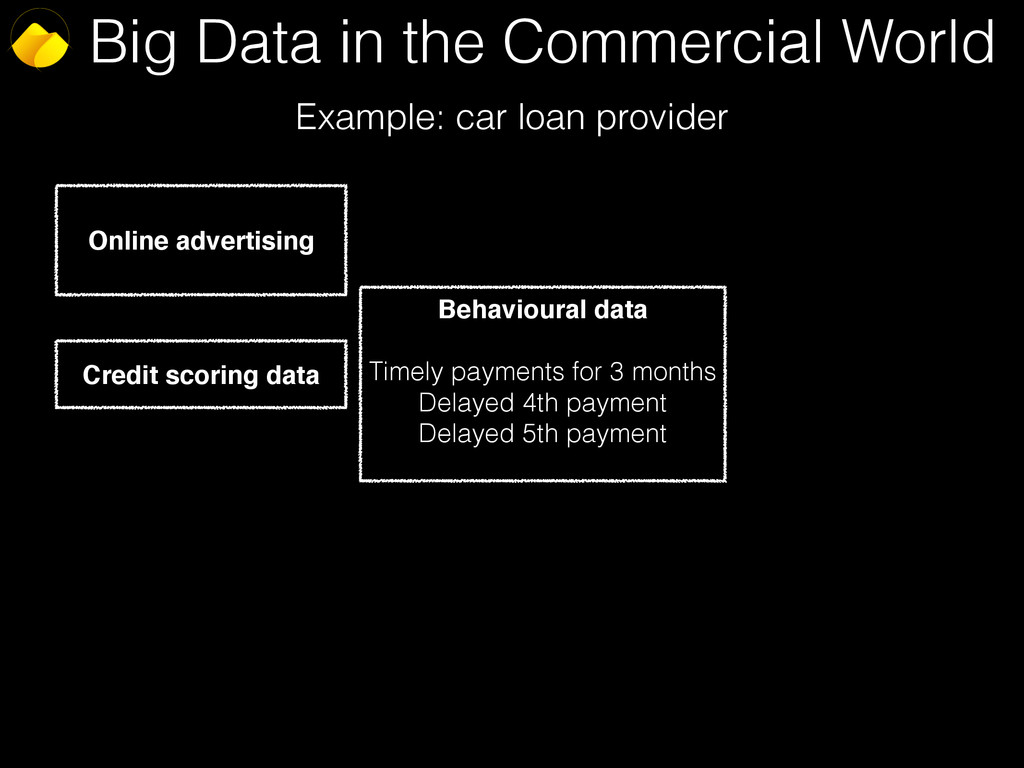
  23. Big Data in the Commercial World Example: car loan provider

    Online advertising Credit scoring data Behavioural data Timely payments for 3 months Delayed 4th payment Delayed 5th payment
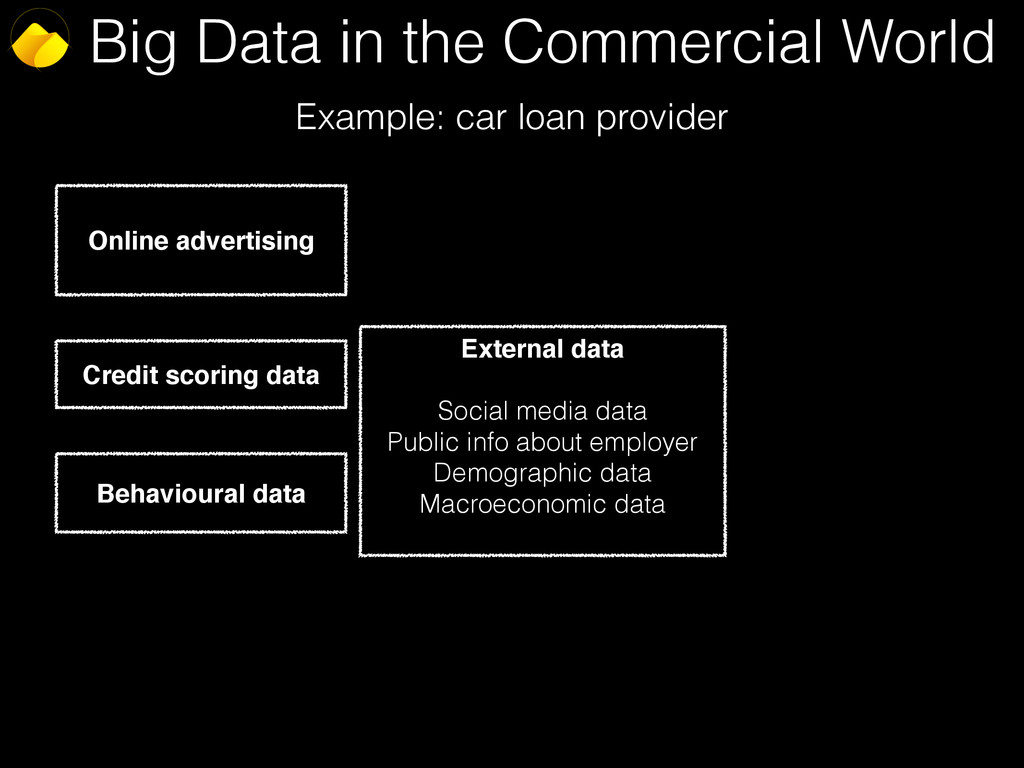
  24. Big Data in the Commercial World Example: car loan provider

    Online advertising Credit scoring data Behavioural data External data Social media data Public info about employer Demographic data Macroeconomic data
  25. Big Data in the Commercial World Example: car loan provider

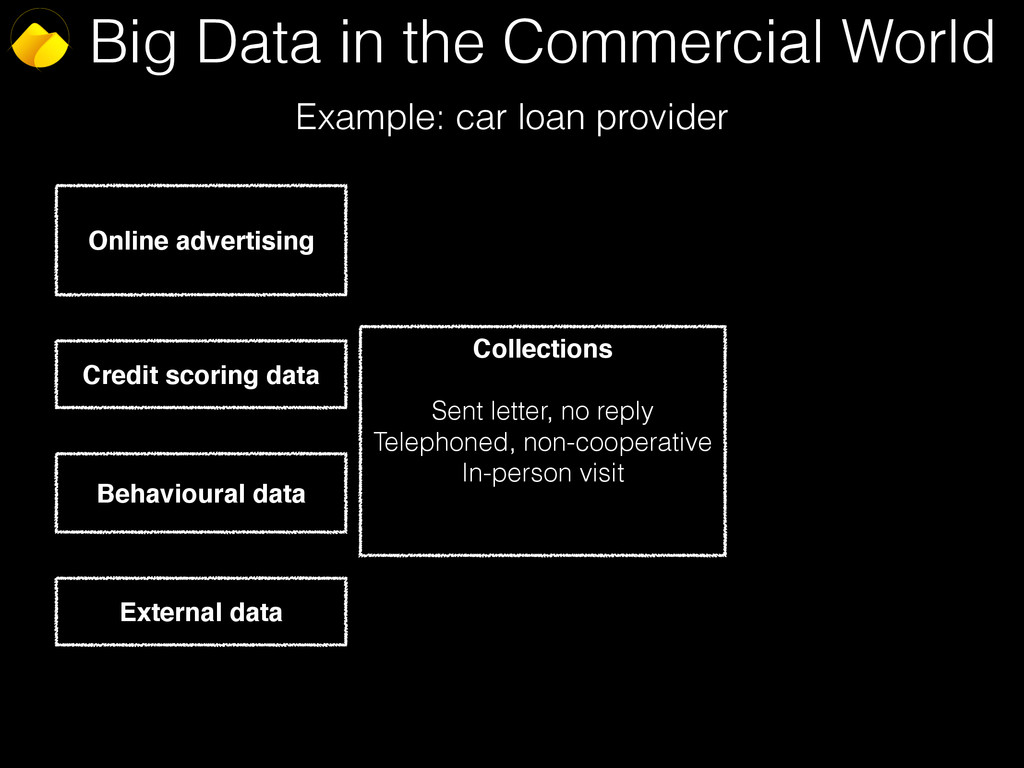
    Online advertising Credit scoring data Behavioural data External data Collections Sent letter, no reply Telephoned, non-cooperative In-person visit
  26. Big Data in the Commercial World Example: car loan provider

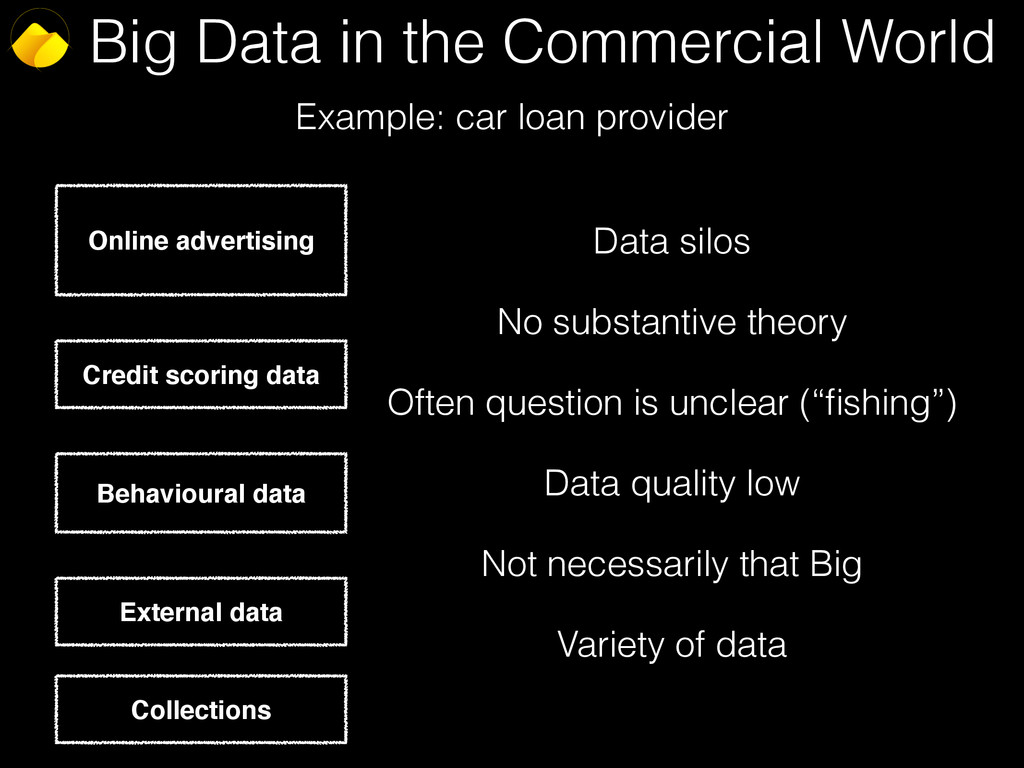
    Online advertising Credit scoring data Behavioural data External data Collections Data silos No substantive theory Often question is unclear (“fishing”) Data quality low Not necessarily that Big Variety of data
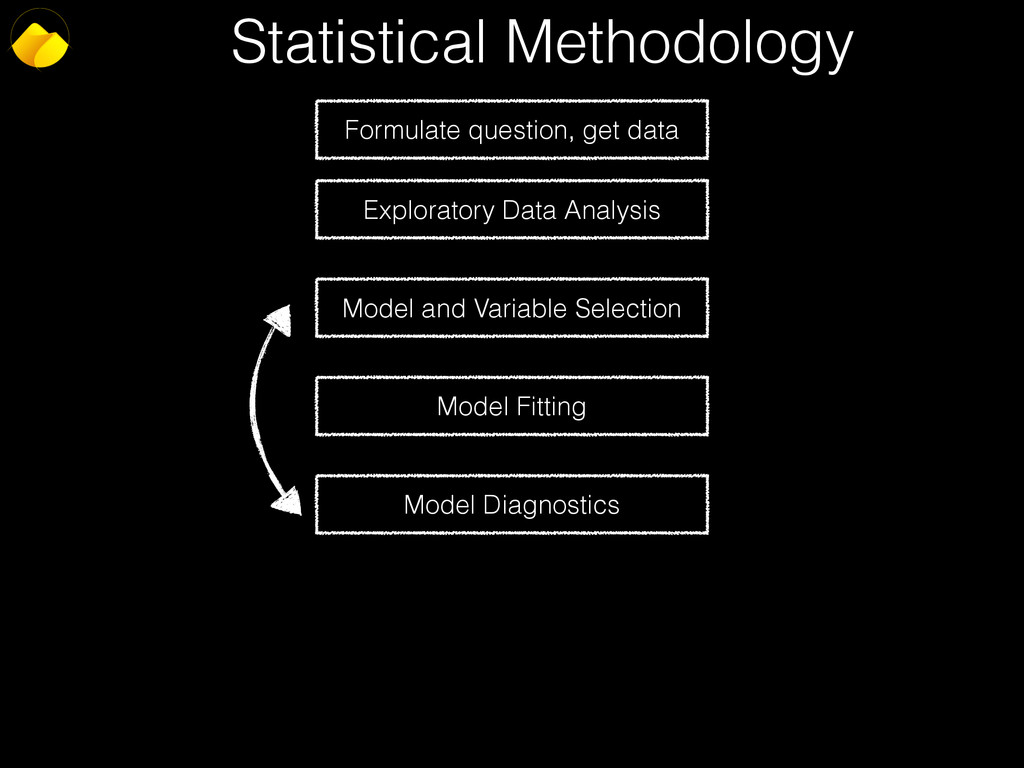
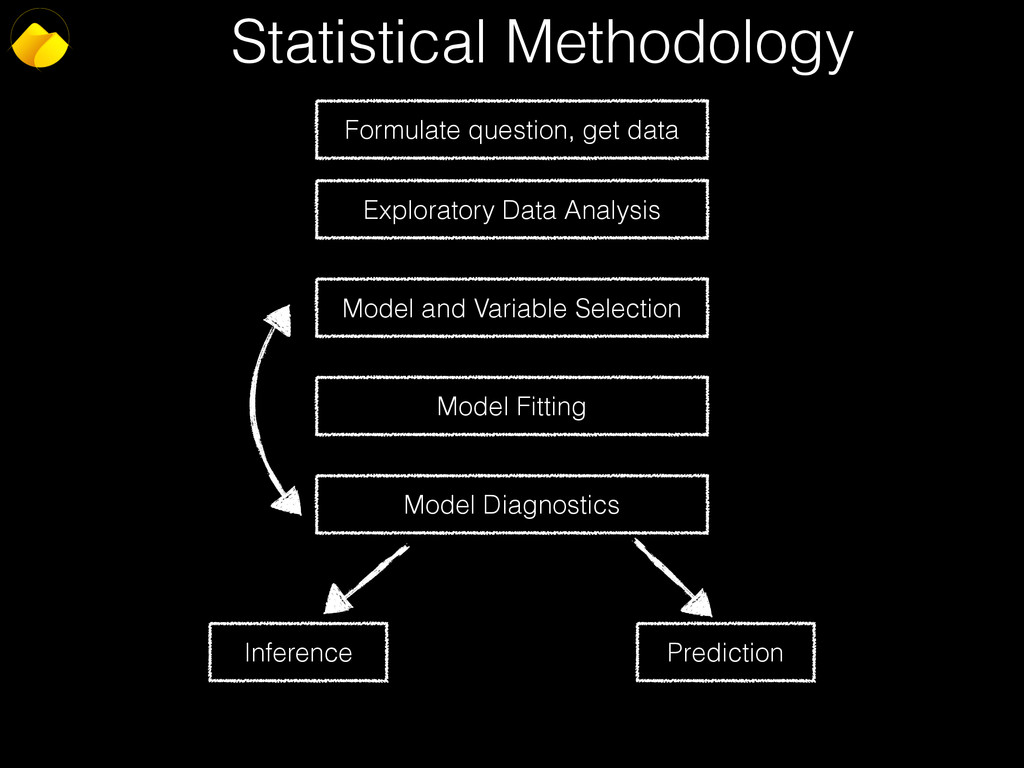
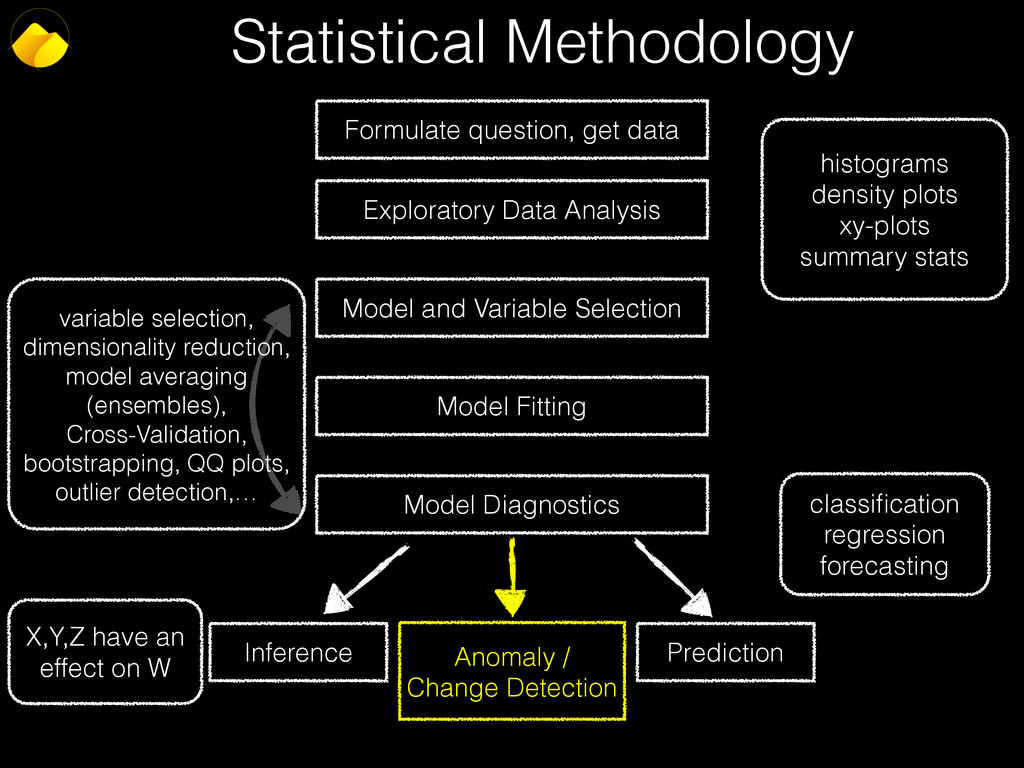
  27. Exploratory Data Analysis Model and Variable Selection Model Fitting Model

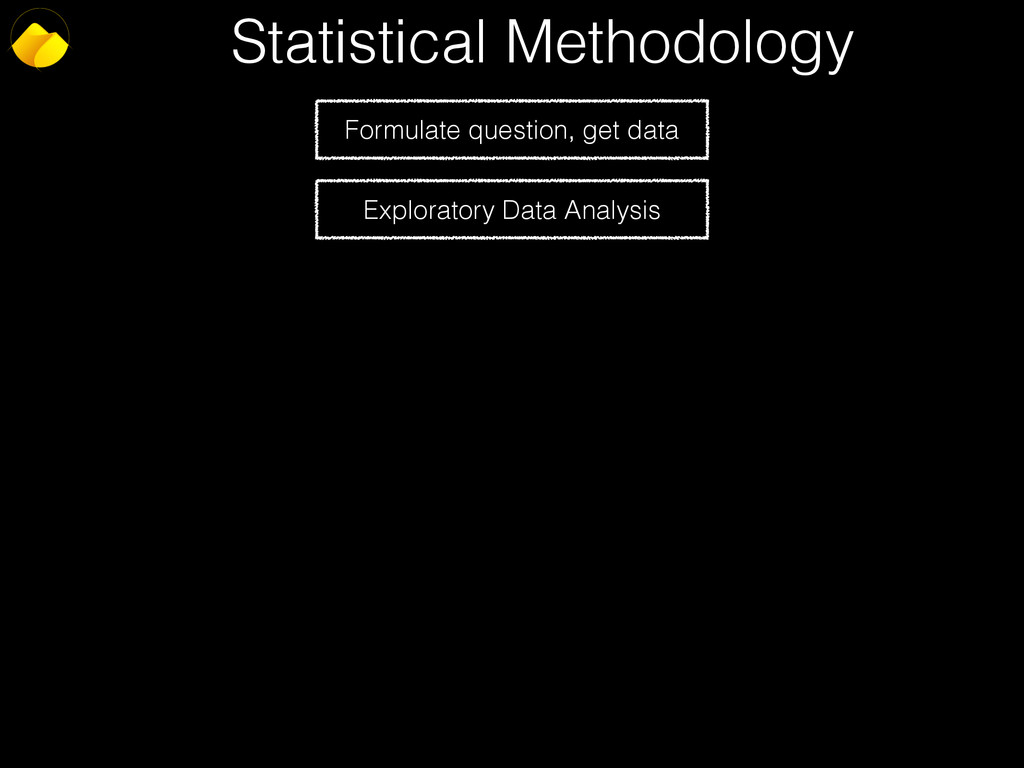
    Diagnostics Statistical Methodology Formulate question, get data
  28. Exploratory Data Analysis Model and Variable Selection Model Fitting Model

    Diagnostics Inference Prediction Statistical Methodology Formulate question, get data
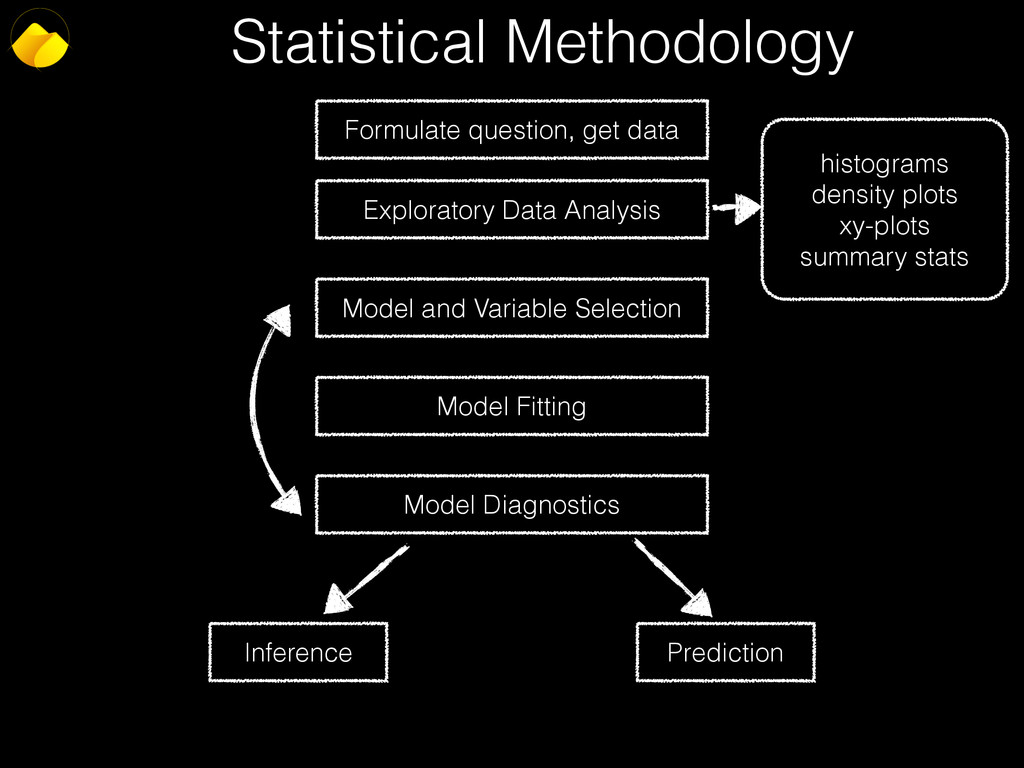
  29. Exploratory Data Analysis Model and Variable Selection Model Fitting Model

    Diagnostics Inference Prediction Statistical Methodology Formulate question, get data histograms density plots xy-plots summary stats
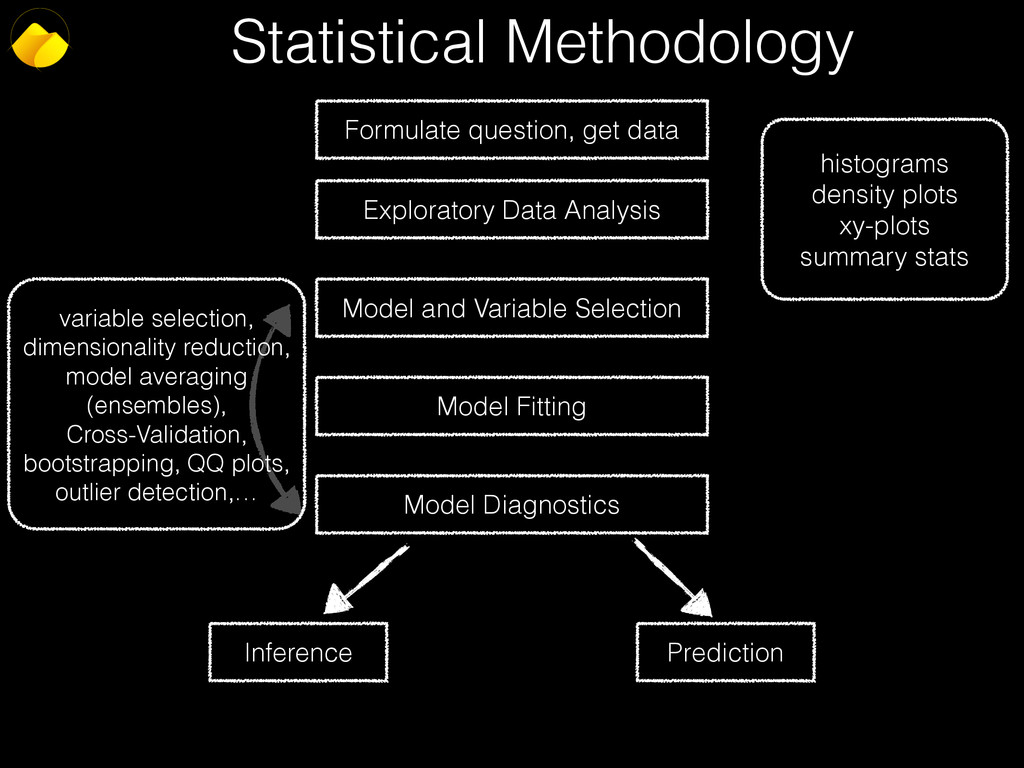
  30. Exploratory Data Analysis Model and Variable Selection Model Fitting Model

    Diagnostics Inference Prediction Statistical Methodology Formulate question, get data histograms density plots xy-plots summary stats variable selection, dimensionality reduction, model averaging (ensembles), Cross-Validation, bootstrapping, QQ plots, outlier detection,…
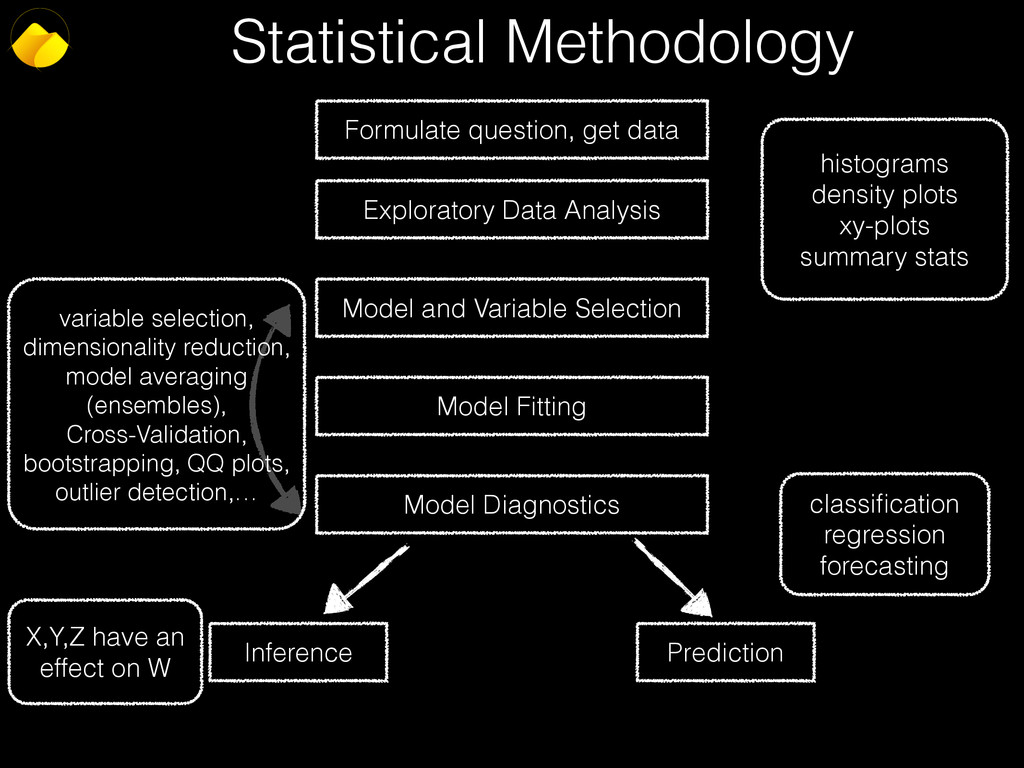
  31. Exploratory Data Analysis Model and Variable Selection Model Fitting Model

    Diagnostics Inference Prediction Statistical Methodology Formulate question, get data histograms density plots xy-plots summary stats variable selection, dimensionality reduction, model averaging (ensembles), Cross-Validation, bootstrapping, QQ plots, outlier detection,… classification regression forecasting X,Y,Z have an effect on W
  32. Exploratory Data Analysis Model and Variable Selection Model Fitting Model

    Diagnostics Inference Prediction Statistical Methodology Formulate question, get data histograms density plots xy-plots summary stats variable selection, dimensionality reduction, model averaging (ensembles), Cross-Validation, bootstrapping, QQ plots, outlier detection,… classification regression forecasting X,Y,Z have an effect on W Anomaly / Change Detection
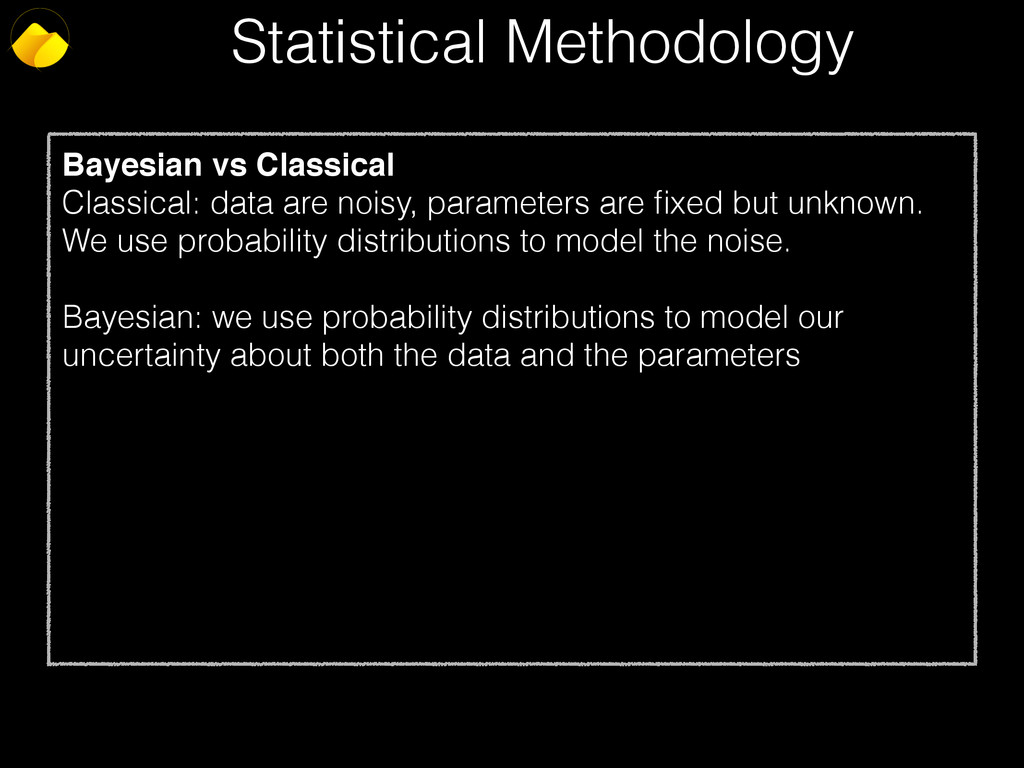
  33. Statistical Methodology Bayesian vs Classical Classical: data are noisy, parameters

    are fixed but unknown. We use probability distributions to model the noise. Bayesian: we use probability distributions to model our uncertainty about both the data and the parameters
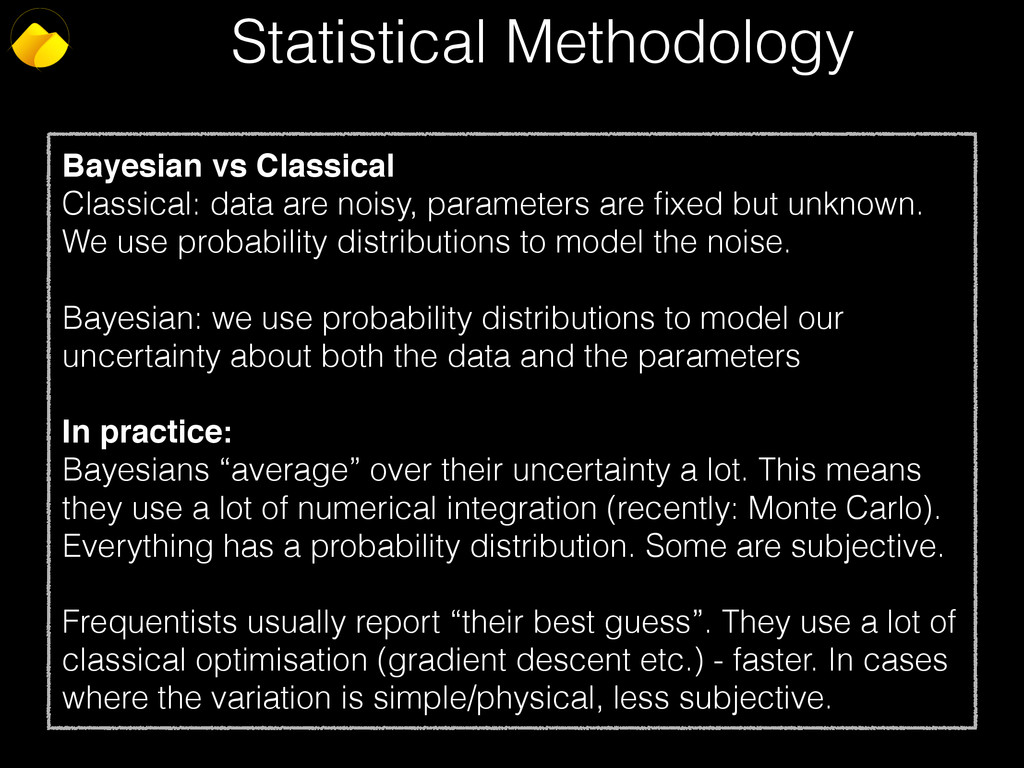
  34. Statistical Methodology Bayesian vs Classical Classical: data are noisy, parameters

    are fixed but unknown. We use probability distributions to model the noise. Bayesian: we use probability distributions to model our uncertainty about both the data and the parameters In practice: Bayesians “average” over their uncertainty a lot. This means they use a lot of numerical integration (recently: Monte Carlo). Everything has a probability distribution. Some are subjective. Frequentists usually report “their best guess”. They use a lot of classical optimisation (gradient descent etc.) - faster. In cases where the variation is simple/physical, less subjective.
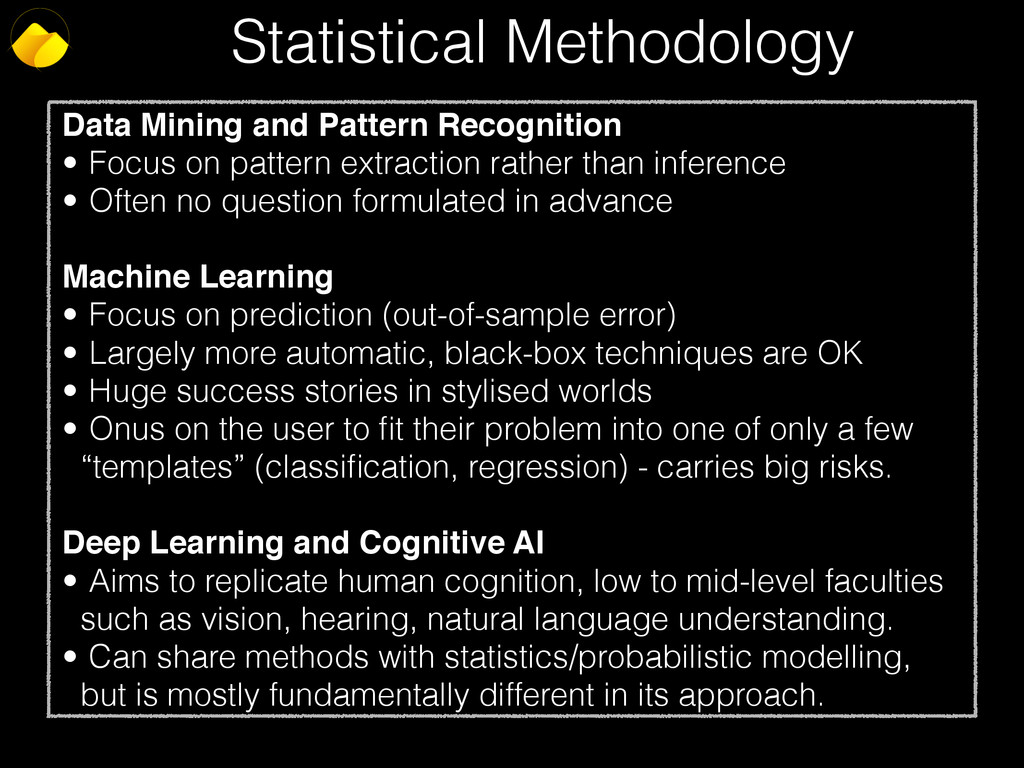
  35. Statistical Methodology Data Mining and Pattern Recognition • Focus on

    pattern extraction rather than inference • Often no question formulated in advance Machine Learning • Focus on prediction (out-of-sample error) • Largely more automatic, black-box techniques are OK • Huge success stories in stylised worlds • Onus on the user to fit their problem into one of only a few “templates” (classification, regression) - carries big risks. Deep Learning and Cognitive AI • Aims to replicate human cognition, low to mid-level faculties such as vision, hearing, natural language understanding. • Can share methods with statistics/probabilistic modelling, but is mostly fundamentally different in its approach.
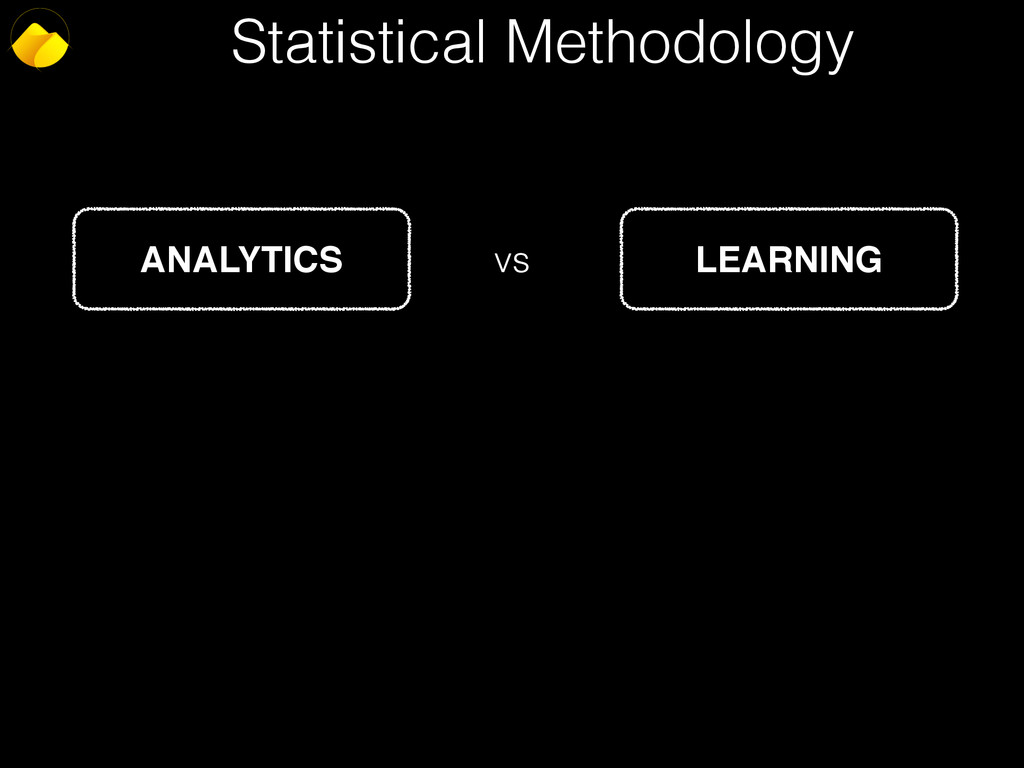
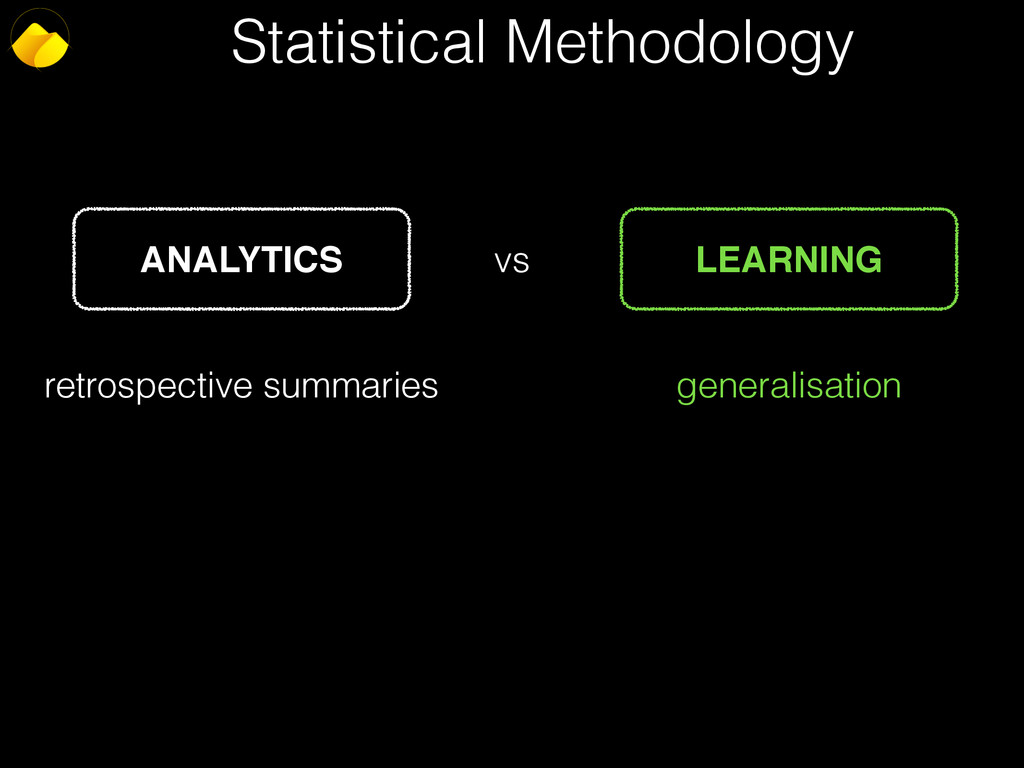
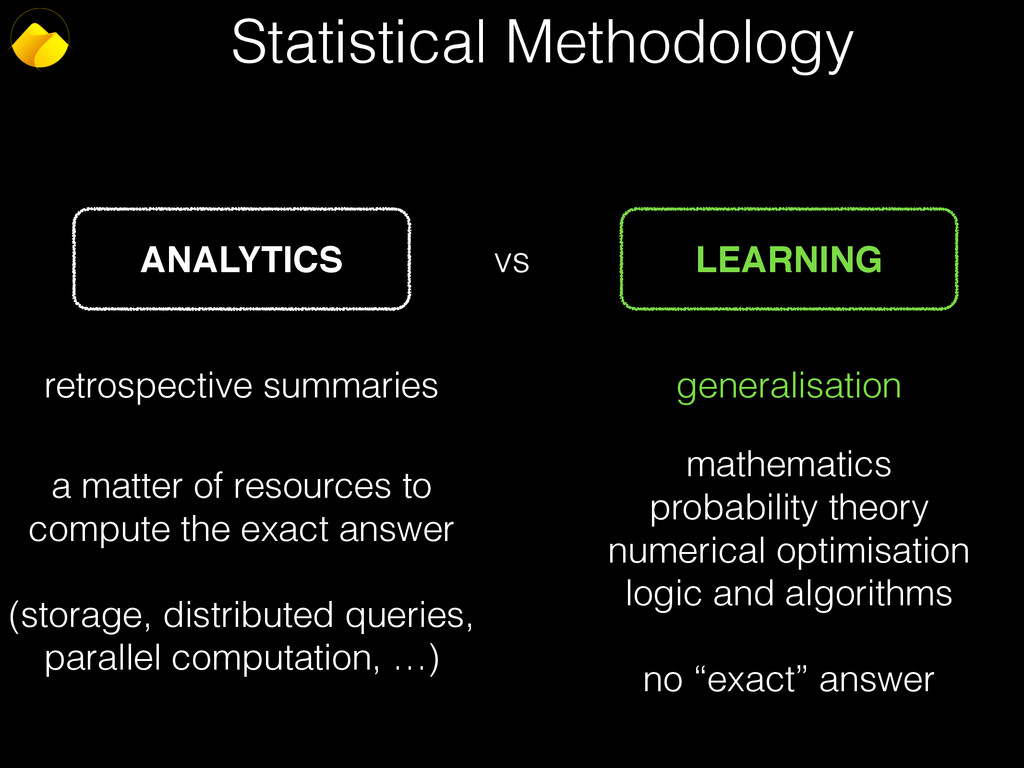
  36. Statistical Methodology ANALYTICS LEARNING vs retrospective summaries generalisation a matter

    of resources to compute the exact answer (storage, distributed queries, parallel computation, …) mathematics probability theory numerical optimisation logic and algorithms no “exact” answer
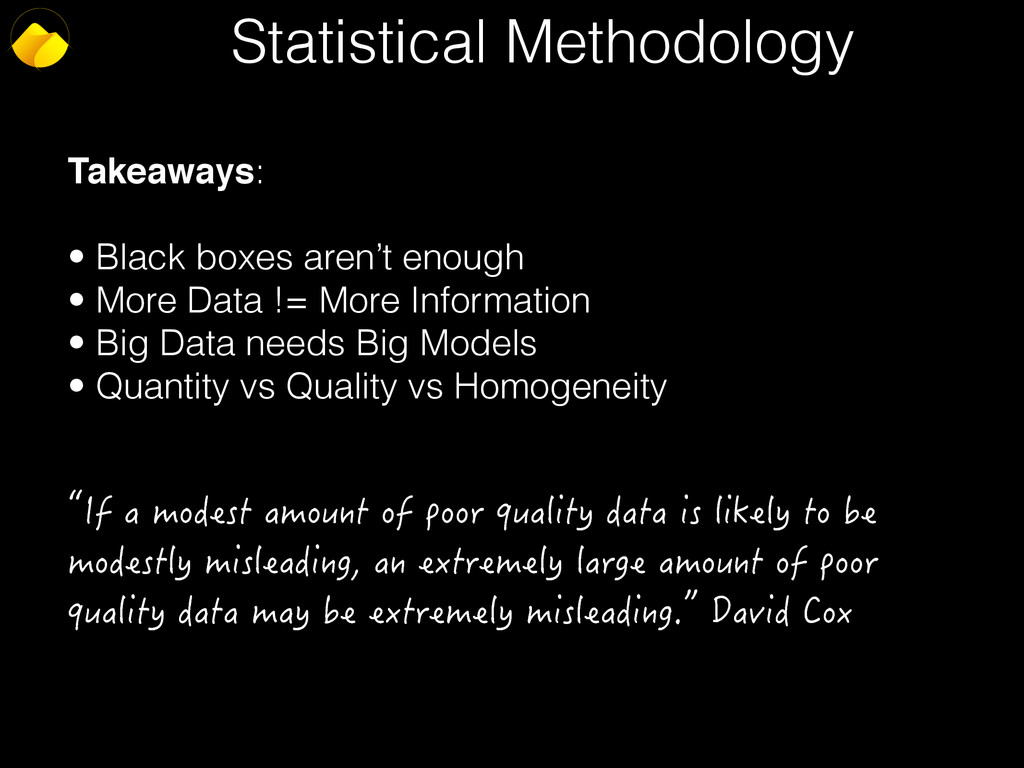
  37. Statistical Methodology Takeaways: • Black boxes aren’t enough • More

    Data != More Information • Big Data needs Big Models • Quantity vs Quality vs Homogeneity ň+HCOQFGUVCOQWPVQHRQQTSWCNKV[FCVCKUNKMGN[VQDG OQFGUVN[OKUNGCFKPICPGZVTGOGN[NCTIGCOQWPVQHRQQT SWCNKV[FCVCOC[DGGZVTGOGN[OKUNGCFKPIʼn&CXKF%QZ 

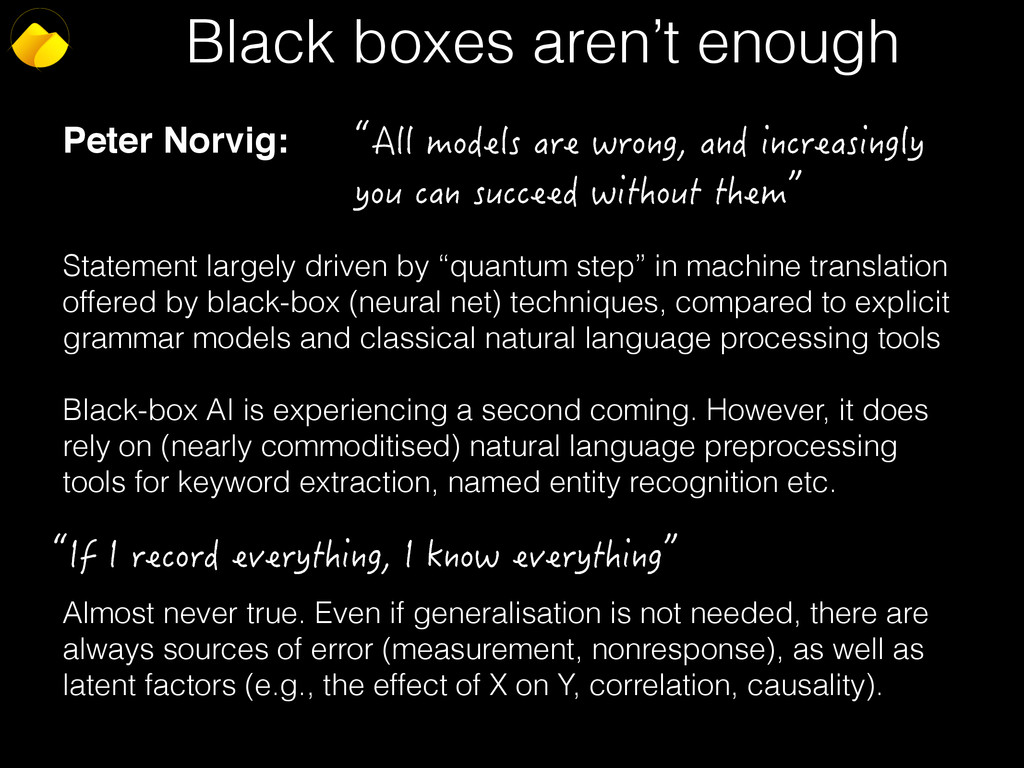
  38. Black boxes aren’t enough Peter Norvig: Statement largely driven by

    “quantum step” in machine translation offered by black-box (neural net) techniques, compared to explicit grammar models and classical natural language processing tools Black-box AI is experiencing a second coming. However, it does rely on (nearly commoditised) natural language preprocessing tools for keyword extraction, named entity recognition etc. ň#NNOQFGNUCTGYTQPICPFKPETGCUKPIN[ [QWECPUWEEGGFYKVJQWVVJGOʼn 
 ň+H+TGEQTFGXGT[VJKPI+MPQYGXGT[VJKPIʼn 
 Almost never true. Even if generalisation is not needed, there are always sources of error (measurement, nonresponse), as well as latent factors (e.g., the effect of X on Y, correlation, causality).
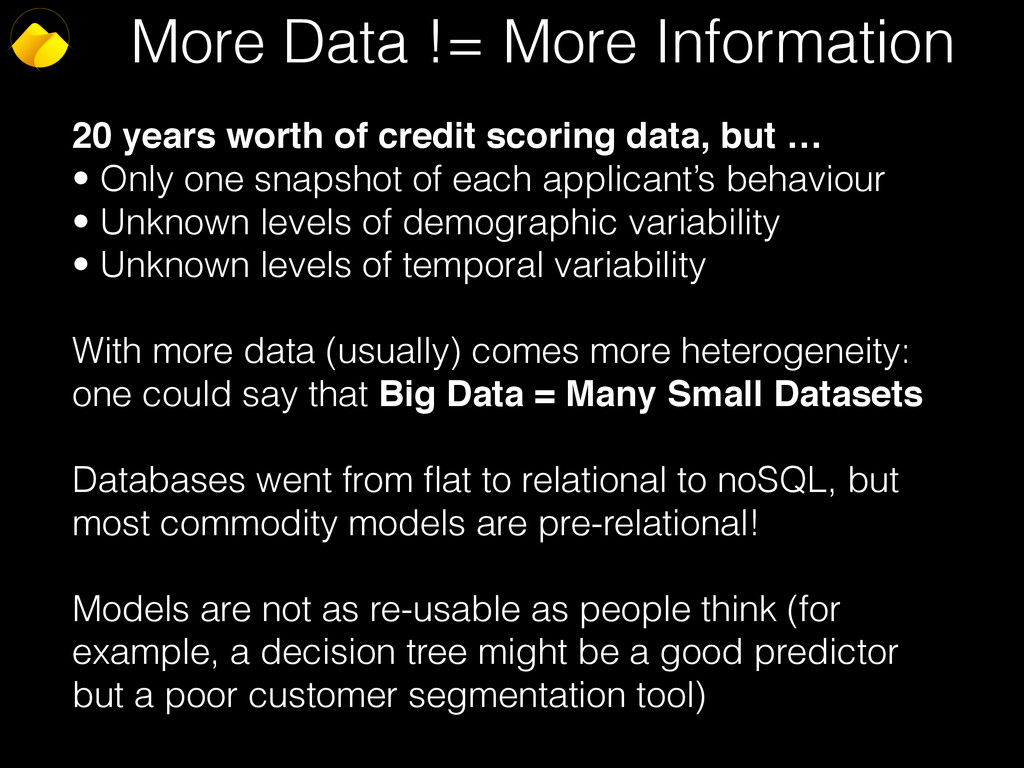
  39. More Data != More Information 20 years worth of credit

    scoring data, but … • Only one snapshot of each applicant’s behaviour • Unknown levels of demographic variability • Unknown levels of temporal variability With more data (usually) comes more heterogeneity: one could say that Big Data = Many Small Datasets Databases went from flat to relational to noSQL, but most commodity models are pre-relational! Models are not as re-usable as people think (for example, a decision tree might be a good predictor but a poor customer segmentation tool)
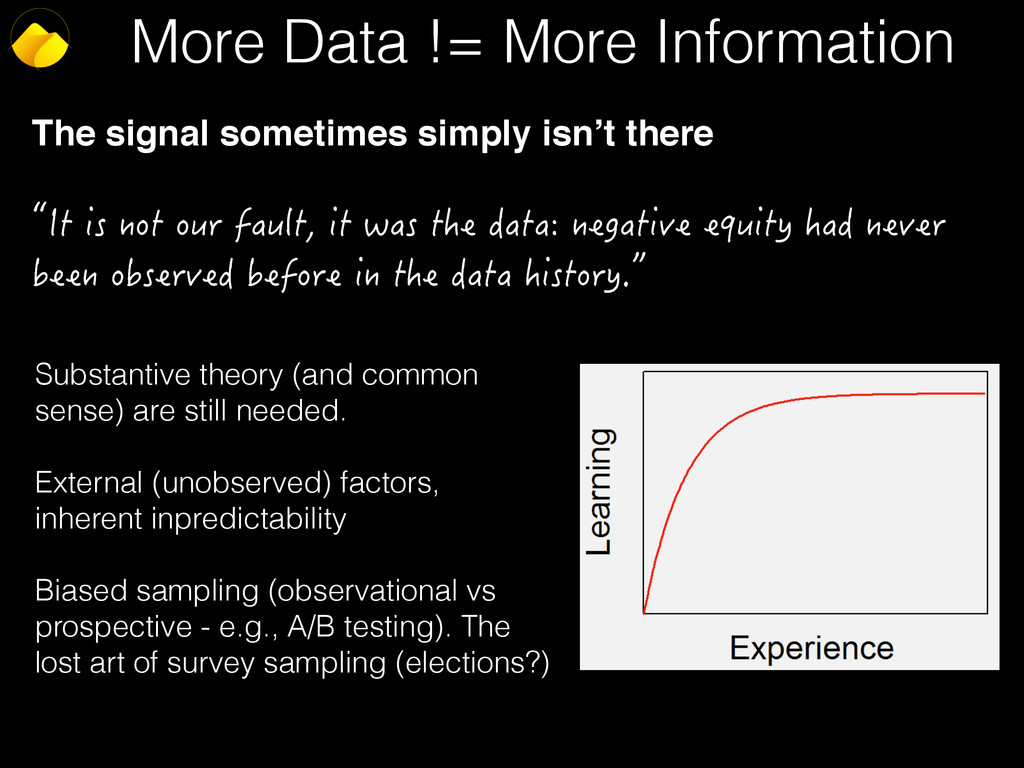
  40. More Data != More Information The signal sometimes simply isn’t

    there ň+VKUPQVQWTHCWNVKVYCUVJGFCVCPGICVKXGGSWKV[JCFPGXGT DGGPQDUGTXGFDGHQTGKPVJGFCVCJKUVQT[ʼn Substantive theory (and common sense) are still needed. External (unobserved) factors, inherent inpredictability Biased sampling (observational vs prospective - e.g., A/B testing). The lost art of survey sampling (elections?)
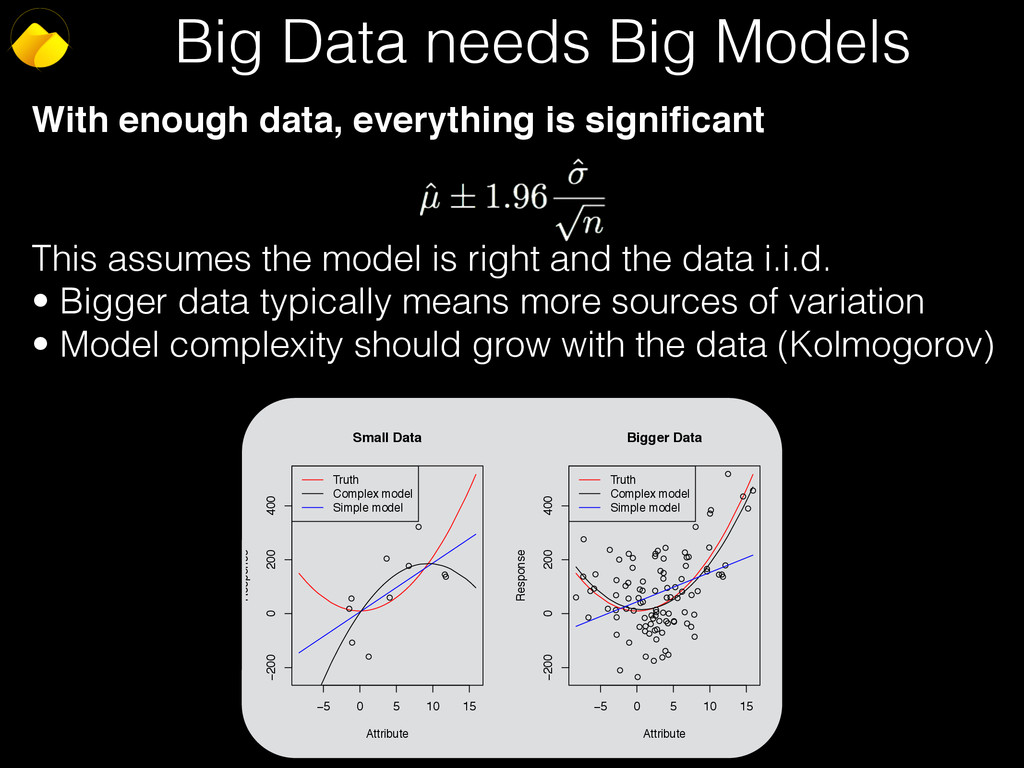
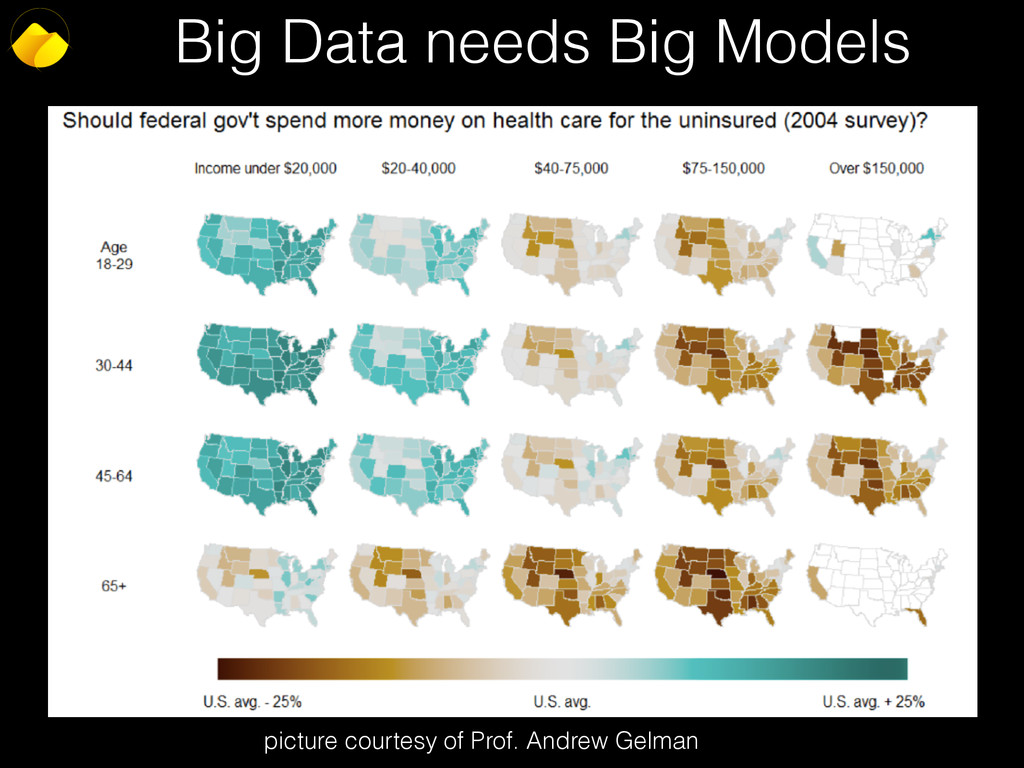
  41. Big Data needs Big Models With enough data, everything is

    significant This assumes the model is right and the data i.i.d. • Bigger data typically means more sources of variation • Model complexity should grow with the data (Kolmogorov) −5 0 5 10 15 −200 0 200 400 Small Data Attribute Response • • • • • • • • • • Truth Complex model Simple model −5 0 5 10 15 −200 0 200 400 Bigger Data Attribute Response • • • • • • • • • • • • • • • • • • • • • • • • • • • • • • • • • • • • • • • • • • • • • • • • • • • • • • • • • • • • • • • • • • • • • • • • • • • • • • • • • • • • • • • • • • • • • • • • • • • • Truth Complex model Simple model
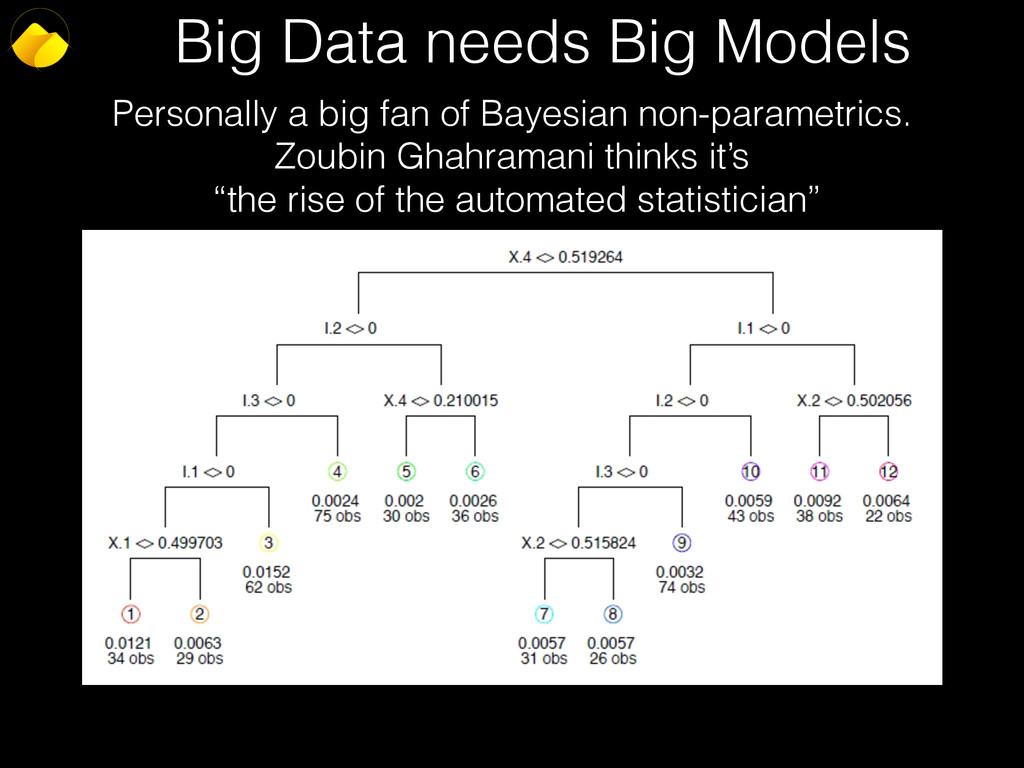
  42. Big Data needs Big Models Personally a big fan of

    Bayesian non-parametrics. Zoubin Ghahramani thinks it’s “the rise of the automated statistician”
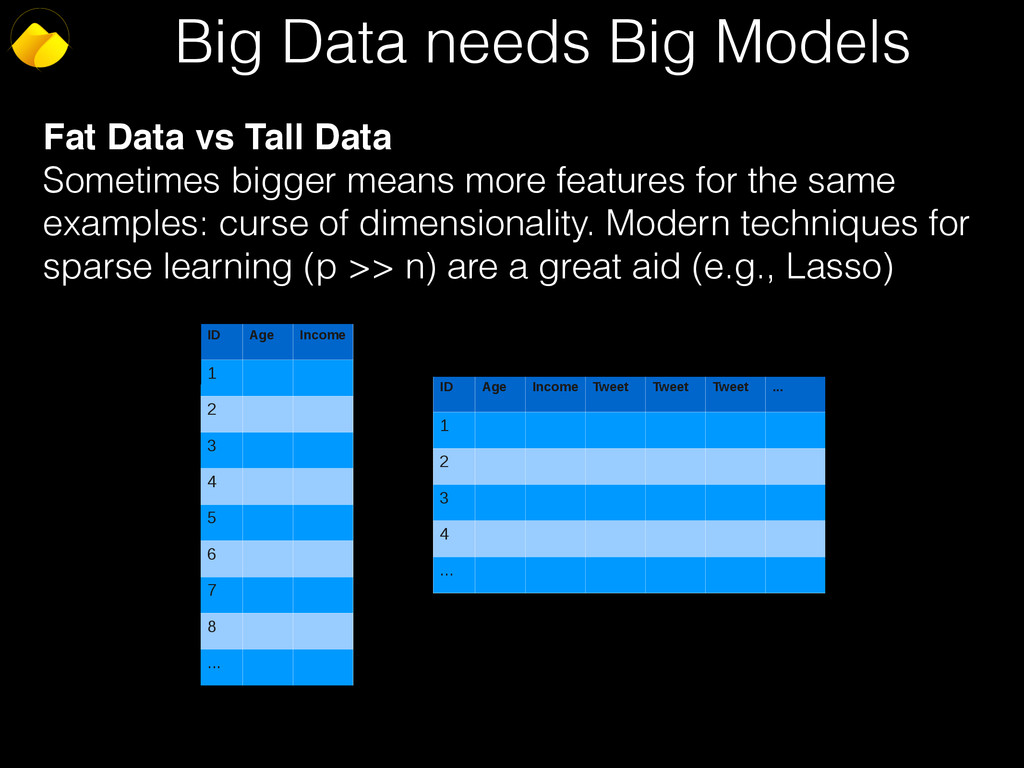
  43. Big Data needs Big Models Fat Data vs Tall Data

    Sometimes bigger means more features for the same examples: curse of dimensionality. Modern techniques for sparse learning (p >> n) are a great aid (e.g., Lasso) ID Age Income Tweet Tweet Tweet ... 1 2 3 4 ... ID Age Income 1 2 3 4 5 6 7 8 ...
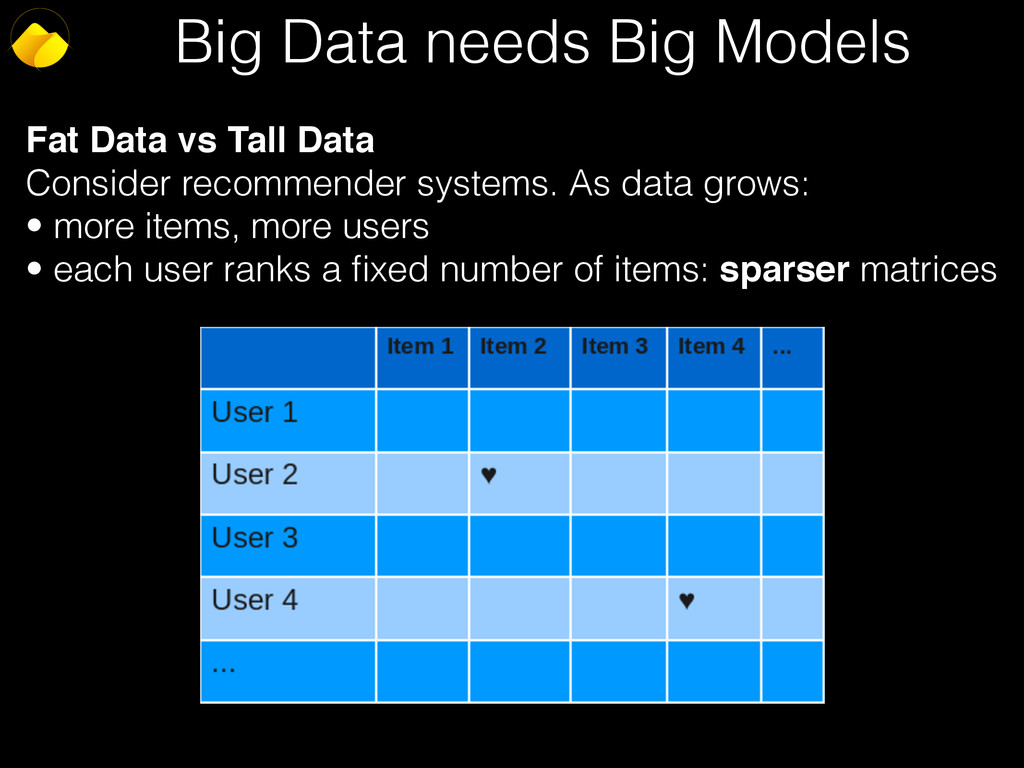
  44. Big Data needs Big Models Fat Data vs Tall Data

    Consider recommender systems. As data grows: • more items, more users • each user ranks a fixed number of items: sparser matrices
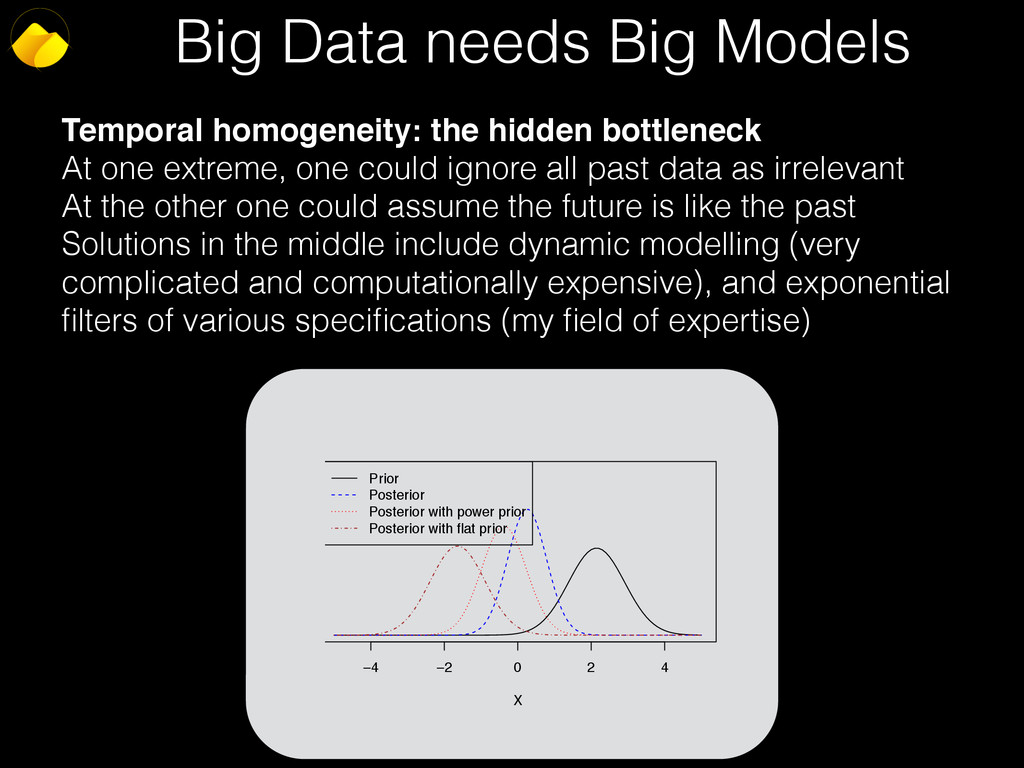
  45. Big Data needs Big Models Temporal homogeneity: the hidden bottleneck

    At one extreme, one could ignore all past data as irrelevant At the other one could assume the future is like the past Solutions in the middle include dynamic modelling (very complicated and computationally expensive), and exponential filters of various specifications (my field of expertise) −4 −2 0 2 4 0.0 0.2 0.4 0.6 0.8 1.0 X Density Prior Posterior Posterior with power prior Posterior with flat prior
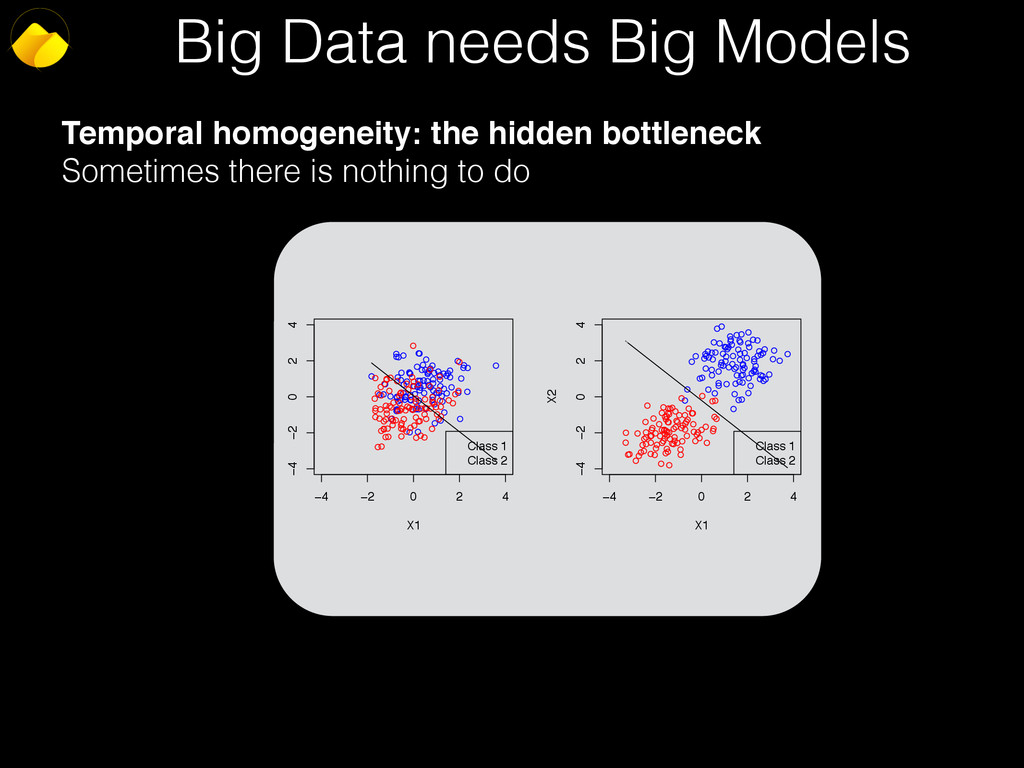
  46. Big Data needs Big Models Temporal homogeneity: the hidden bottleneck

    Sometimes there is nothing to do • • • • • • • • • • • • • • • • • • • • • • • • • • • • • • • • • • • • • • • • • • • • • • • • • • • • • • • • • • • • • • • • • • • • • • • • • • • • • • • • • • • • • • • • • • • • • • • • • • • • −4 −2 0 2 4 −4 −2 0 2 4 X1 X2 • • • • • • • • • • • • • • • • • • • • • • • • • • • • • • • • • • • • • • • • • • • • • • • • • • • • • • • • • • • • • • • • • • • • • • • • • • • • • • • • • • • • • • • • • • • • • • • • • • • • Class 1 Class 2 • • • • • • • • • • • • • • • • • • • • • • • • • • • • • • • • • • • • • • • • • • • • • • • • • • • • • • • • • • • • • • • • • • • • • • • • • • • • • • • • • • • • • • • • • • • • • • • • • • • • −4 −2 0 2 4 −4 −2 0 2 4 X1 X2 • • • • • • • • • • • • • • • • • • • • • • • • • • • • • • • • • • • • • • • • • • • • • • • • • • • • • • • • • • • • • • • • • • • • • • • • • • • • • • • • • • • • • • • • • • • • • • • • • • • • Class 1 Class 2
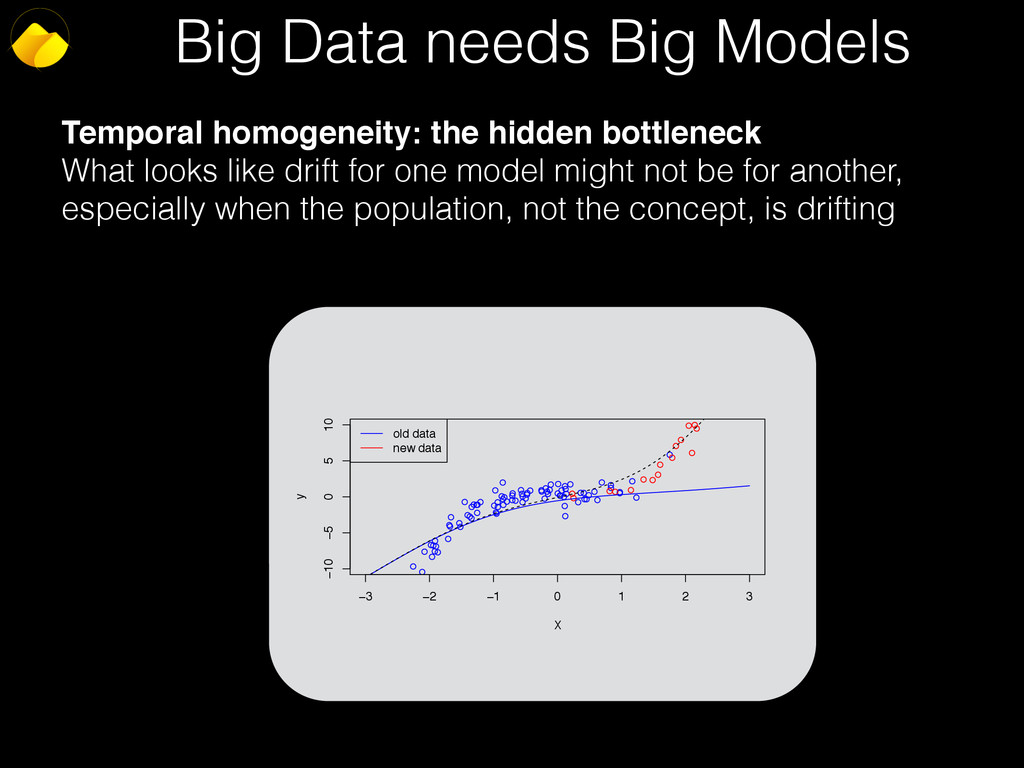
  47. Big Data needs Big Models Temporal homogeneity: the hidden bottleneck

    What looks like drift for one model might not be for another, especially when the population, not the concept, is drifting • • • • • • • • • • • • • • • • • • • • • • • • • • • • • • • • • • • • • • • • • • • • • • • • • • • • • • • • • • • • • • • • • • • • • • • • • • • • • • • • • • • • • • • • • • • • • • • −3 −2 −1 0 1 2 3 −10 −5 0 5 10 X y • • • • • • • • • • • • • • • • • • • • • • old data new data
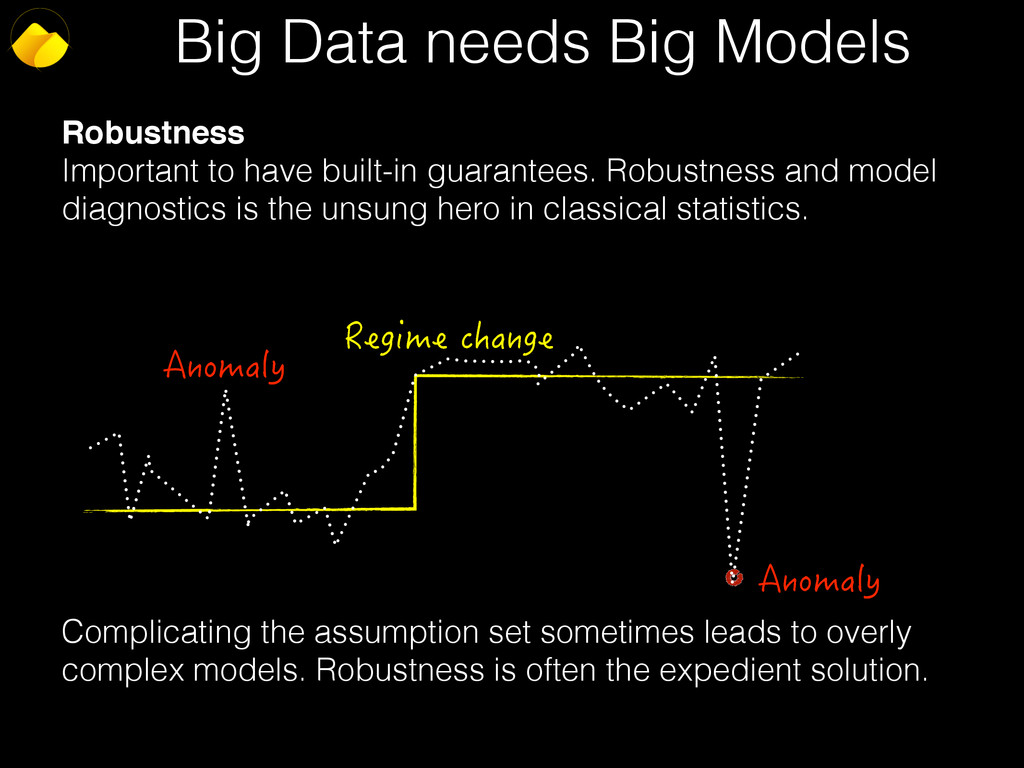
  48. Big Data needs Big Models Robustness Important to have built-in

    guarantees. Robustness and model diagnostics is the unsung hero in classical statistics. #PQOCN[ #PQOCN[ 4GIKOGEJCPIG Complicating the assumption set sometimes leads to overly complex models. Robustness is often the expedient solution.
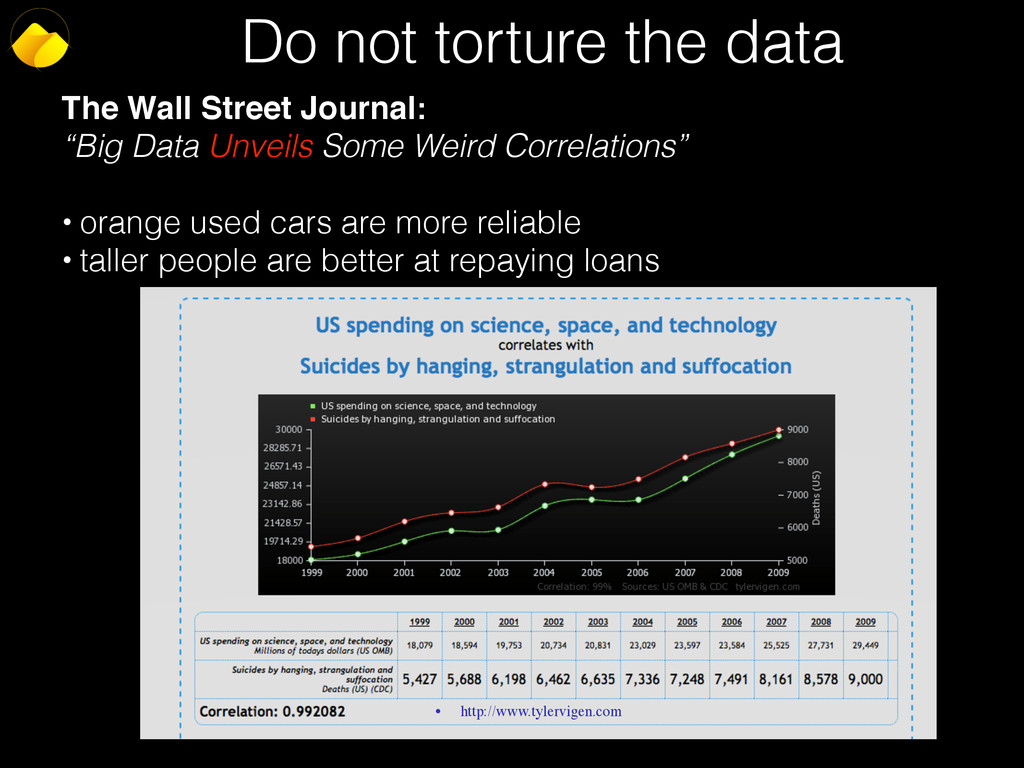
  49. Do not torture the data The Wall Street Journal: “Big

    Data Unveils Some Weird Correlations” • orange used cars are more reliable • taller people are better at repaying loans −4 −2 0 2 4 0.0 0.2 0.4 0.6 0.8 1.0 X Density Prior Posterior Posterior with power prior Posterior with flat prior • http://www.tylervigen.com 

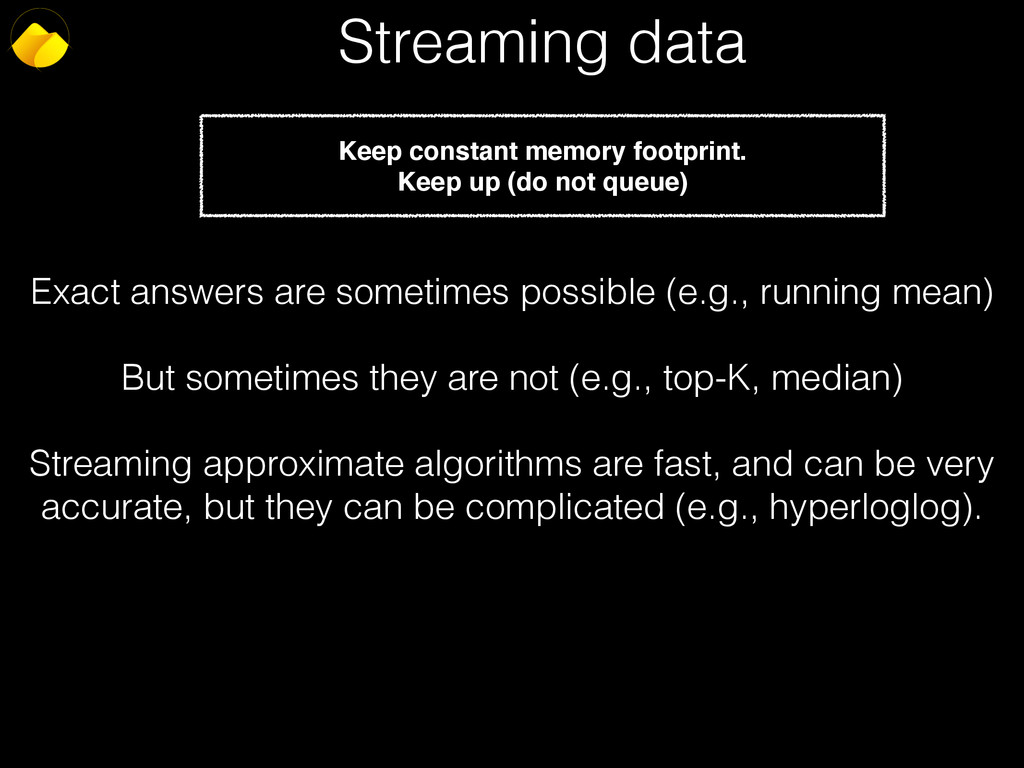
  50. Streaming data Exact answers are sometimes possible (e.g., running mean)

    But sometimes they are not (e.g., top-K, median) Streaming approximate algorithms are fast, and can be very accurate, but they can be complicated (e.g., hyperloglog). Keep constant memory footprint. Keep up (do not queue)
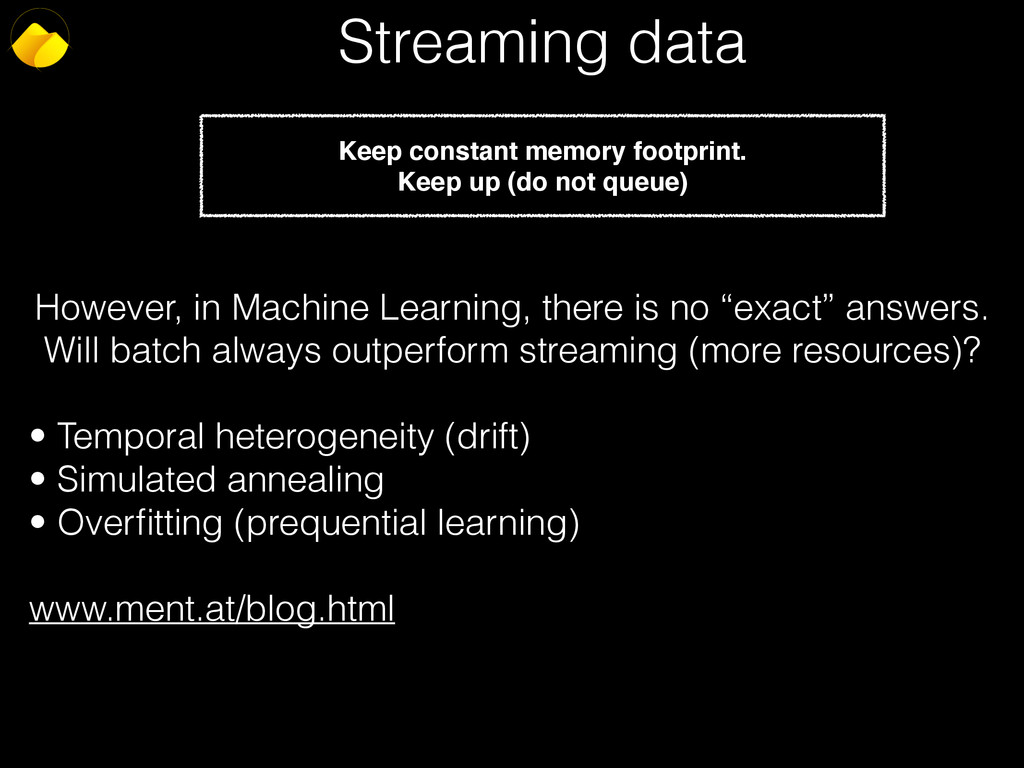
  51. Streaming data However, in Machine Learning, there is no “exact”

    answers. Will batch always outperform streaming (more resources)? • Temporal heterogeneity (drift) • Simulated annealing • Overfitting (prequential learning) www.ment.at/blog.html Keep constant memory footprint. Keep up (do not queue)
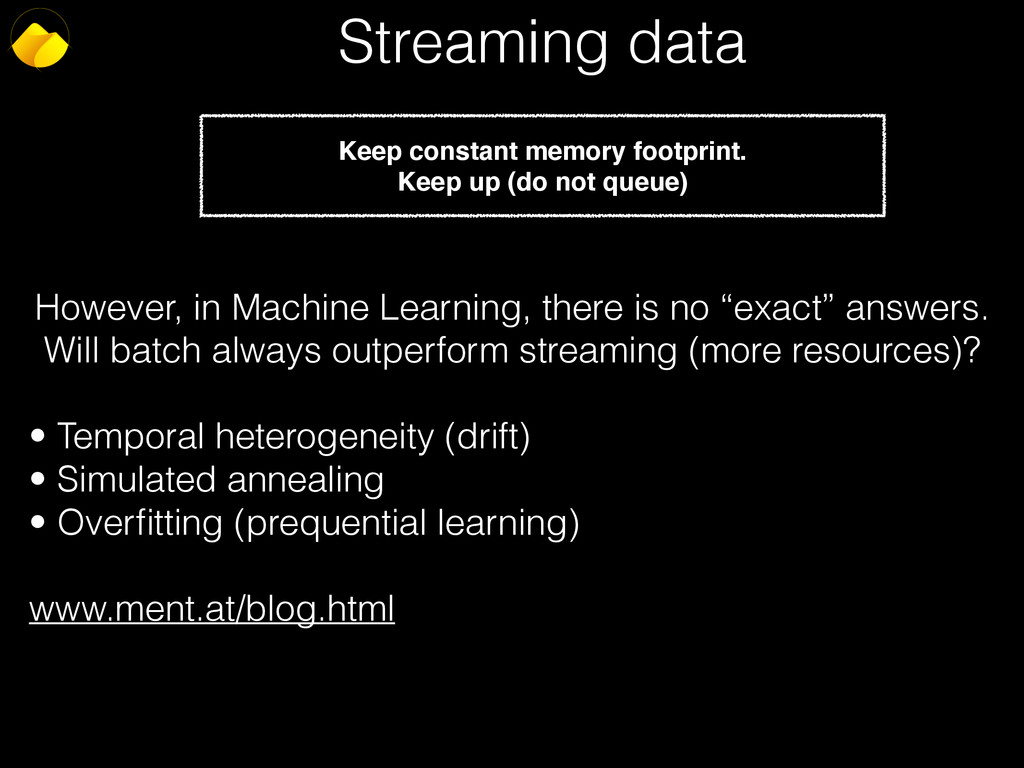
  52. Streaming data However, in Machine Learning, there is no “exact”

    answers. Will batch always outperform streaming (more resources)? • Temporal heterogeneity (drift) • Simulated annealing • Overfitting (prequential learning) www.ment.at/blog.html Keep constant memory footprint. Keep up (do not queue)
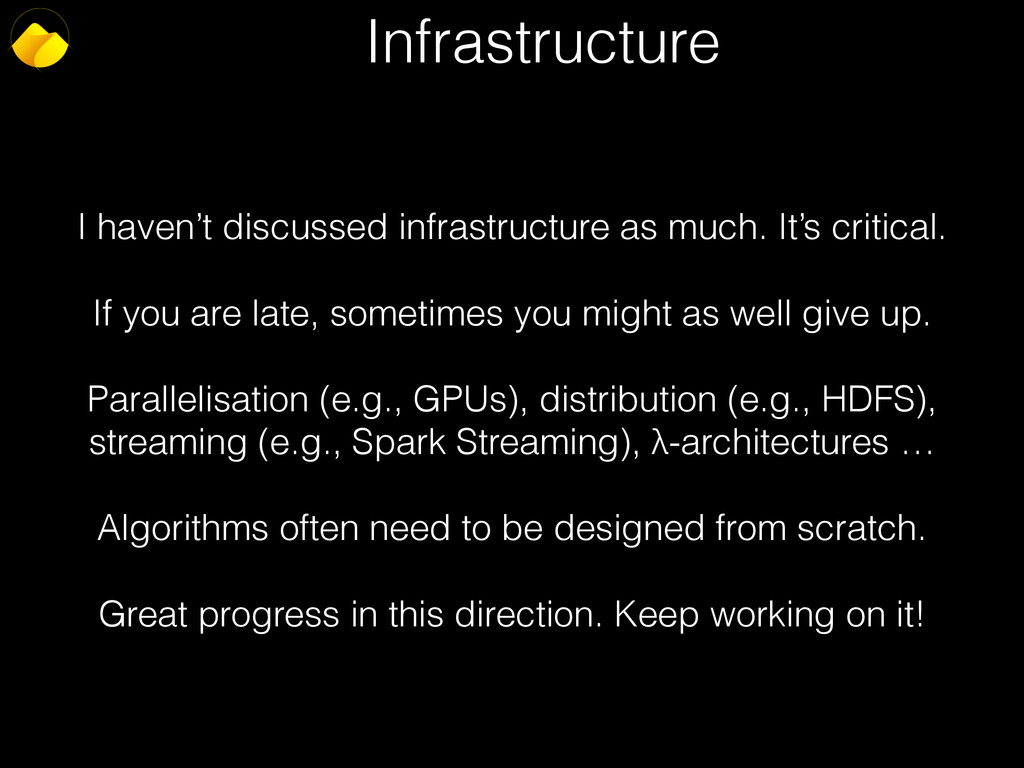
  53. Infrastructure I haven’t discussed infrastructure as much. It’s critical. If

    you are late, sometimes you might as well give up. Parallelisation (e.g., GPUs), distribution (e.g., HDFS), streaming (e.g., Spark Streaming), λ-architectures … Algorithms often need to be designed from scratch. Great progress in this direction. Keep working on it!
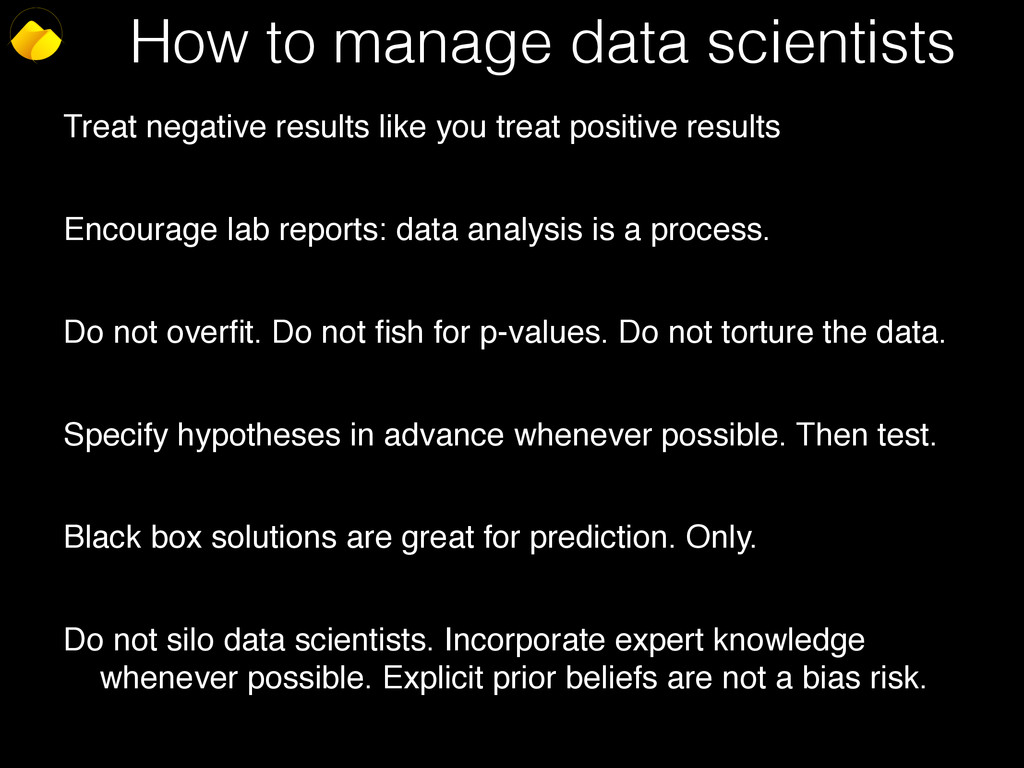
  54. How to manage data scientists Treat negative results like you

    treat positive results Encourage lab reports: data analysis is a process. Do not overfit. Do not fish for p-values. Do not torture the data. Specify hypotheses in advance whenever possible. Then test. Black box solutions are great for prediction. Only. Do not silo data scientists. Incorporate expert knowledge whenever possible. Explicit prior beliefs are not a bias risk.
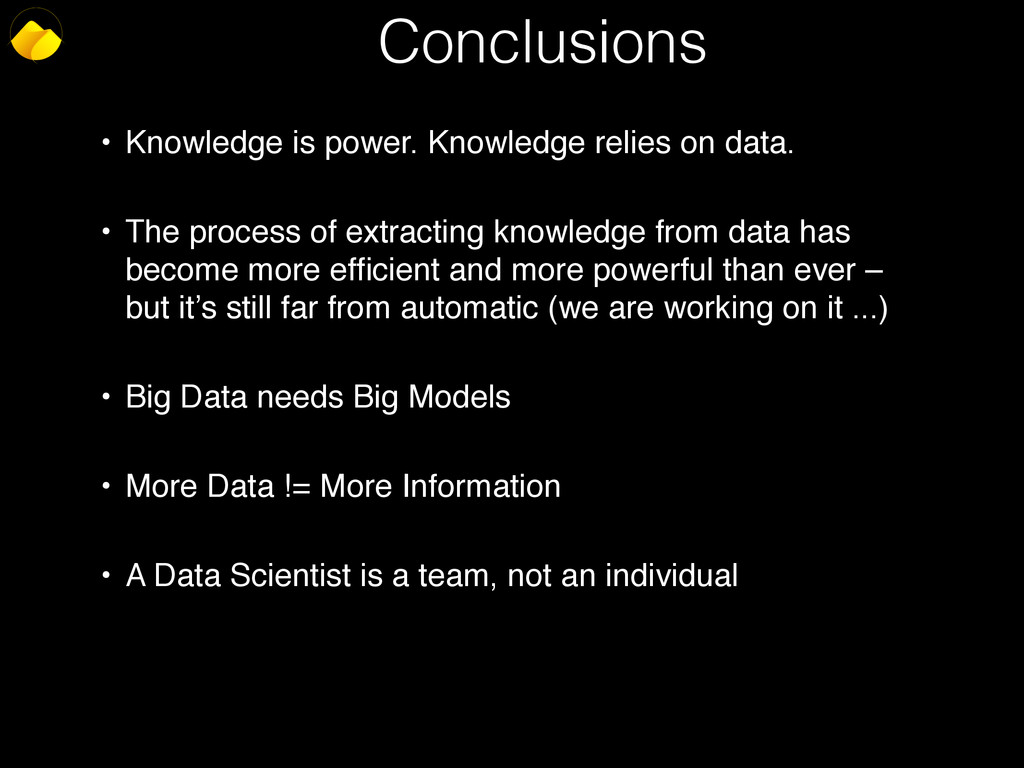
  55. Conclusions • Knowledge is power. Knowledge relies on data. 


    • The process of extracting knowledge from data has become more efficient and more powerful than ever – but it’s still far from automatic (we are working on it ...) 
 • Big Data needs Big Models 
 • More Data != More Information 
 • A Data Scientist is a team, not an individual 

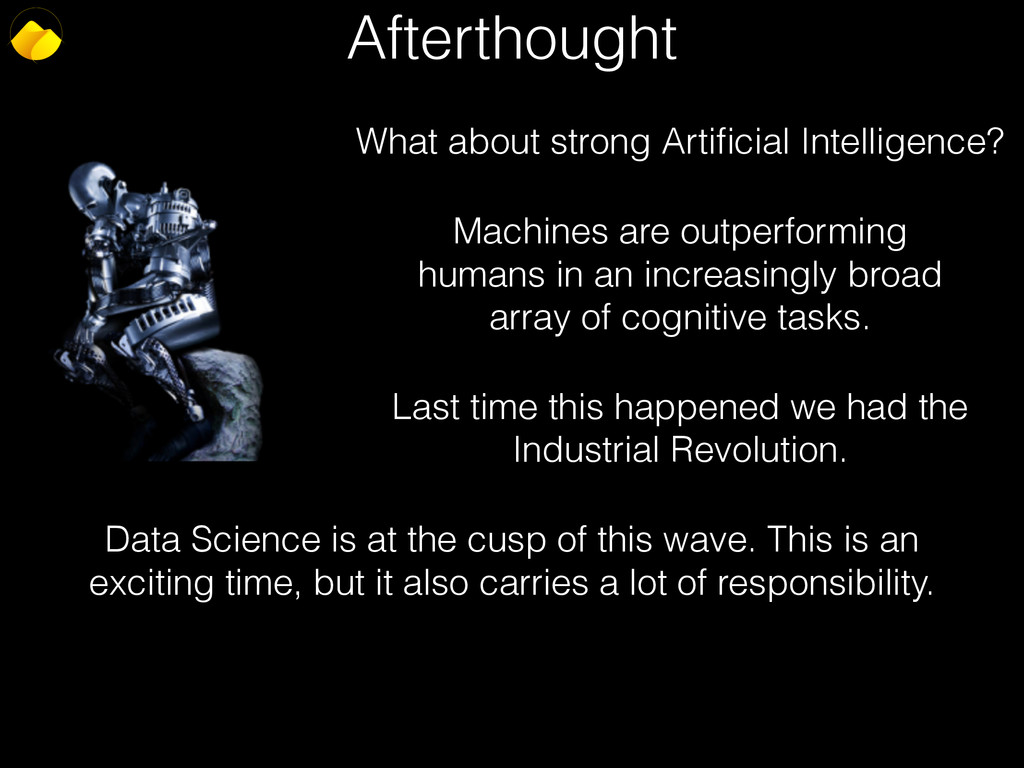
  56. Afterthought What about strong Artificial Intelligence? Machines are outperforming humans

    in an increasingly broad array of cognitive tasks. Last time this happened we had the Industrial Revolution. Data Science is at the cusp of this wave. This is an exciting time, but it also carries a lot of responsibility.
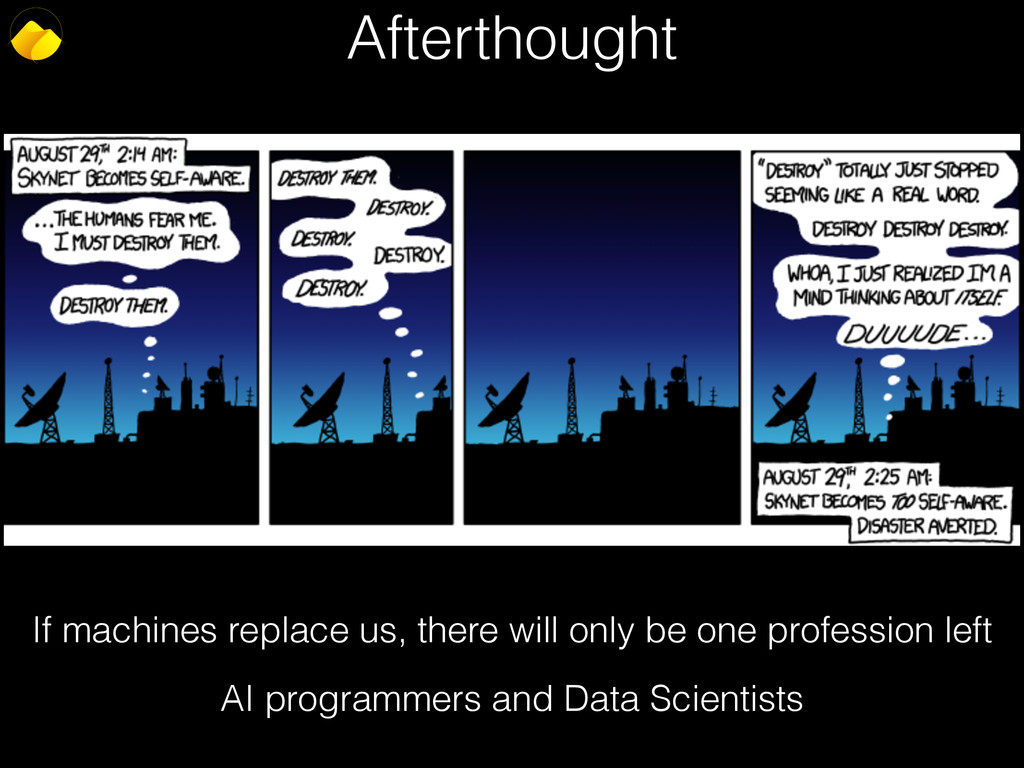
  57. Afterthought If machines replace us, there will only be one

    profession left AI programmers and Data Scientists