Upgrade to Pro — share decks privately, control downloads, hide ads and more …

Reimagining Graphs at Khan Academy

Reimagining Graphs at Khan Academy

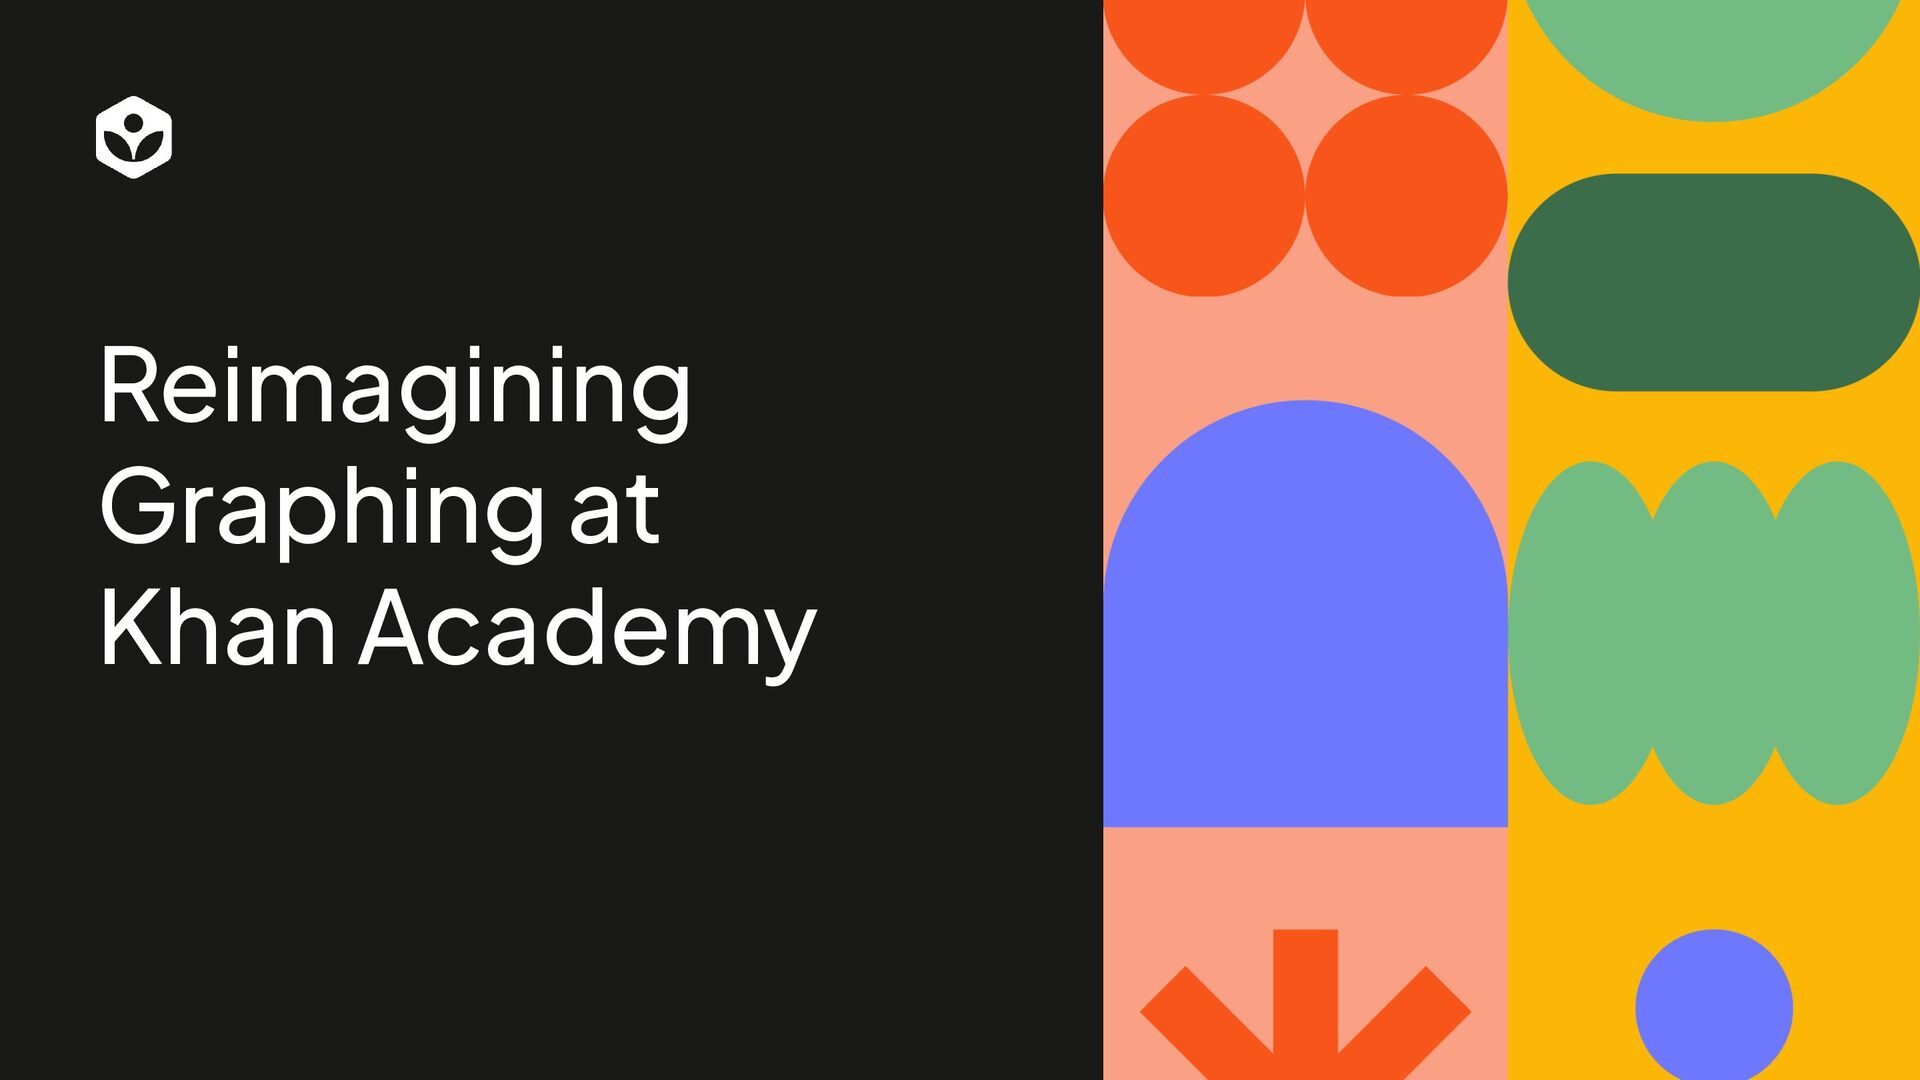
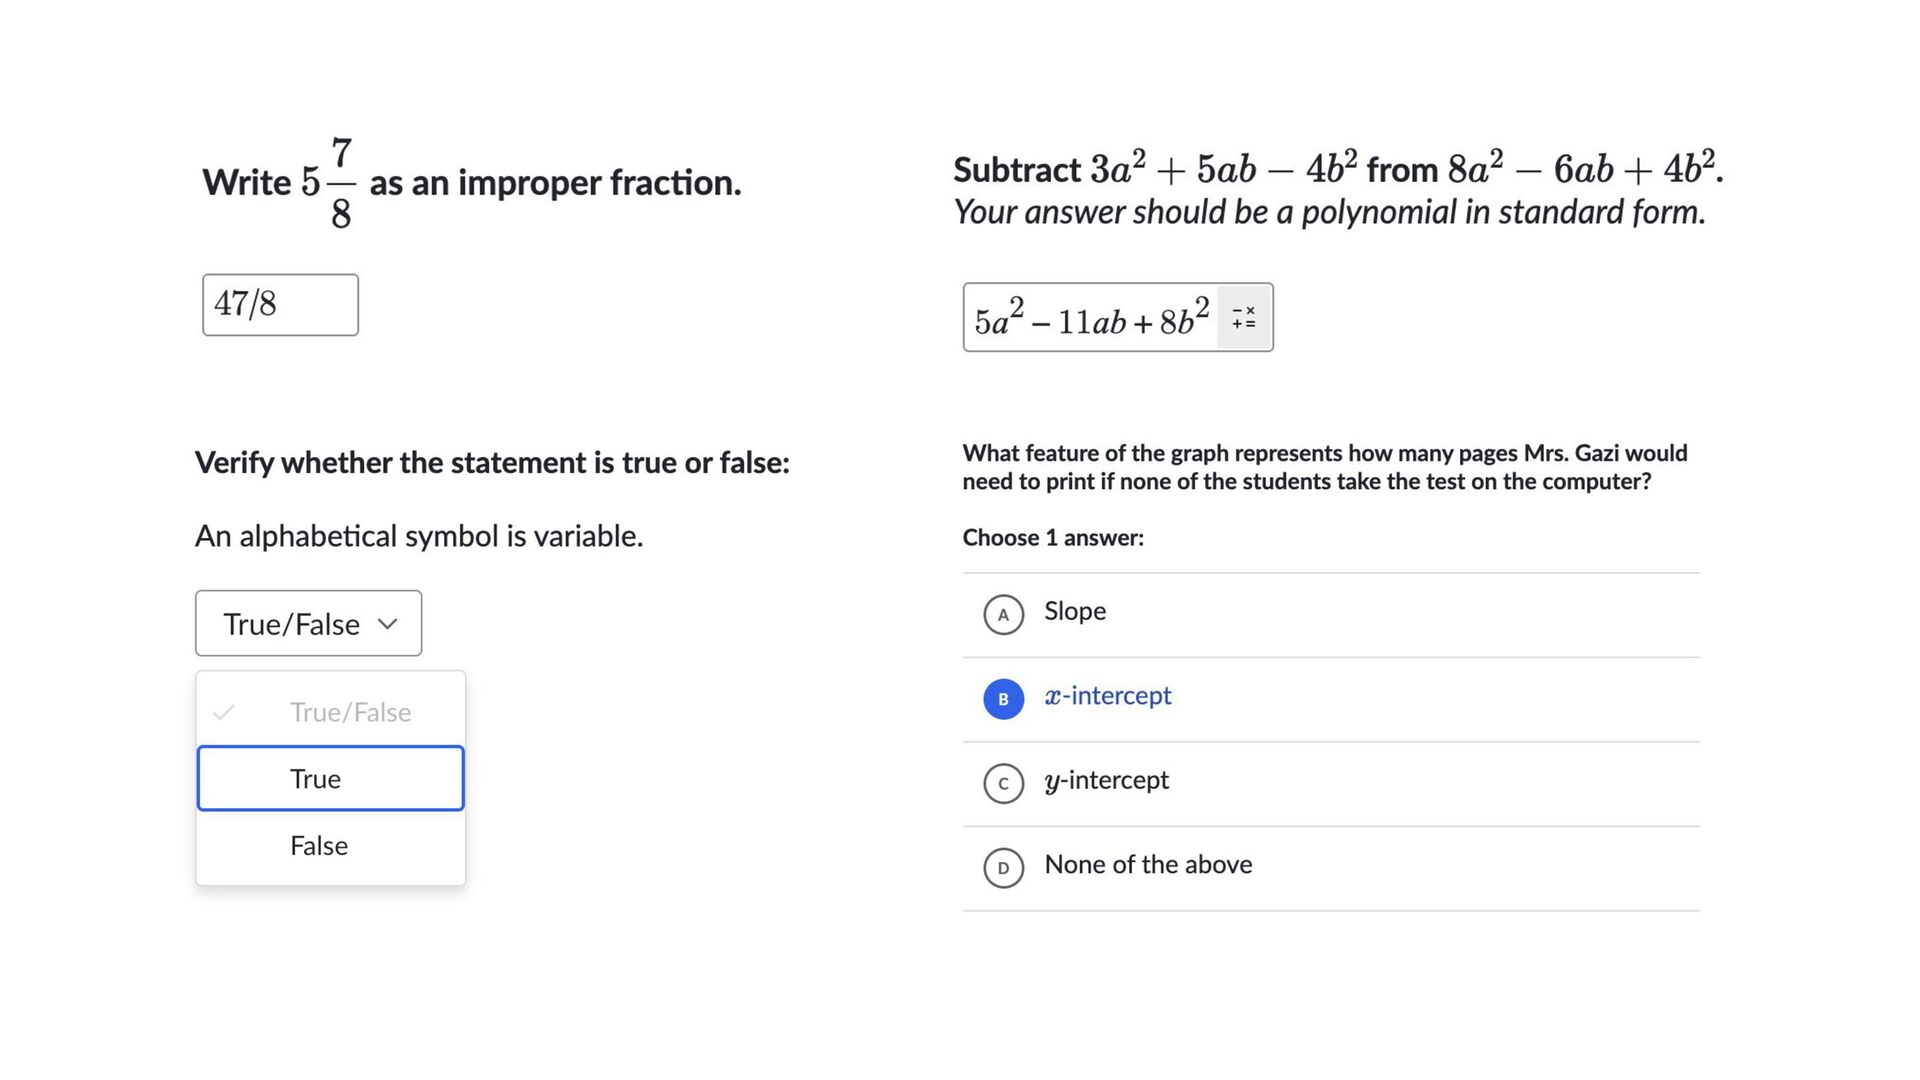
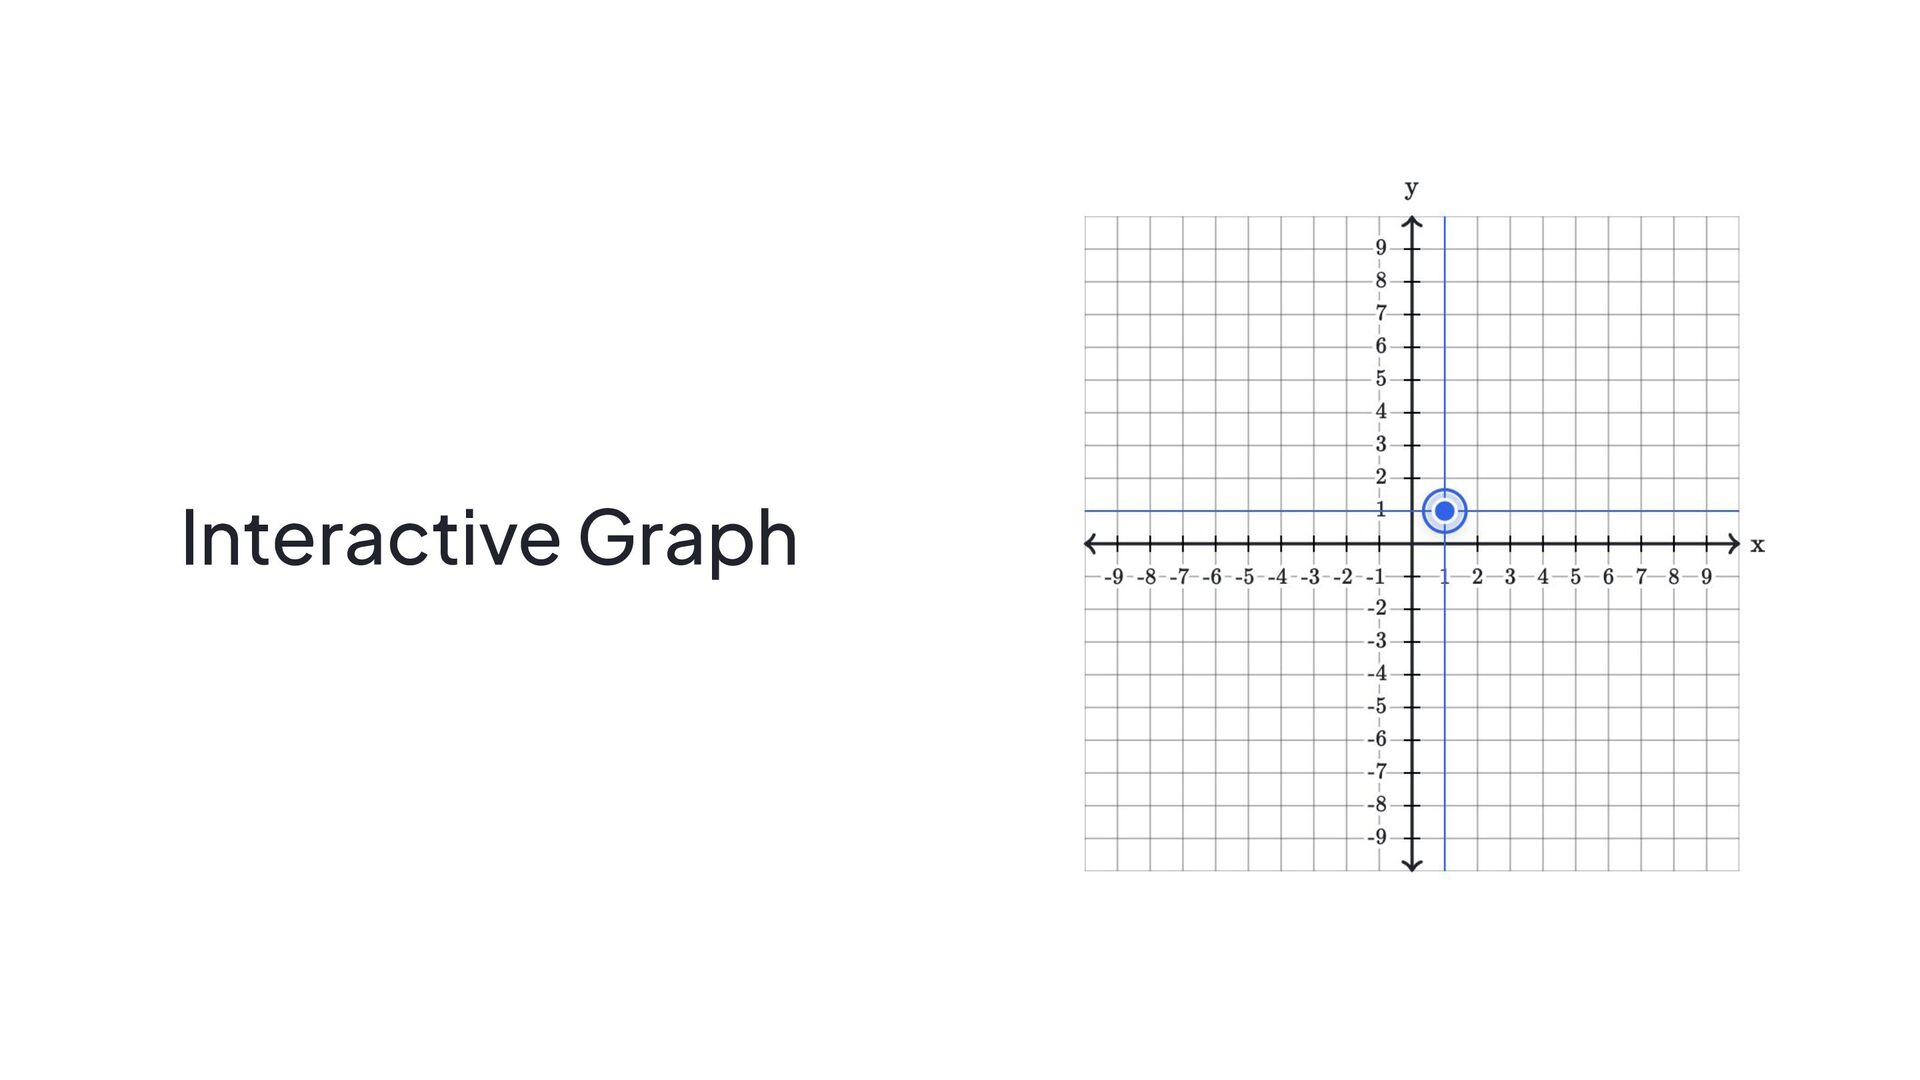
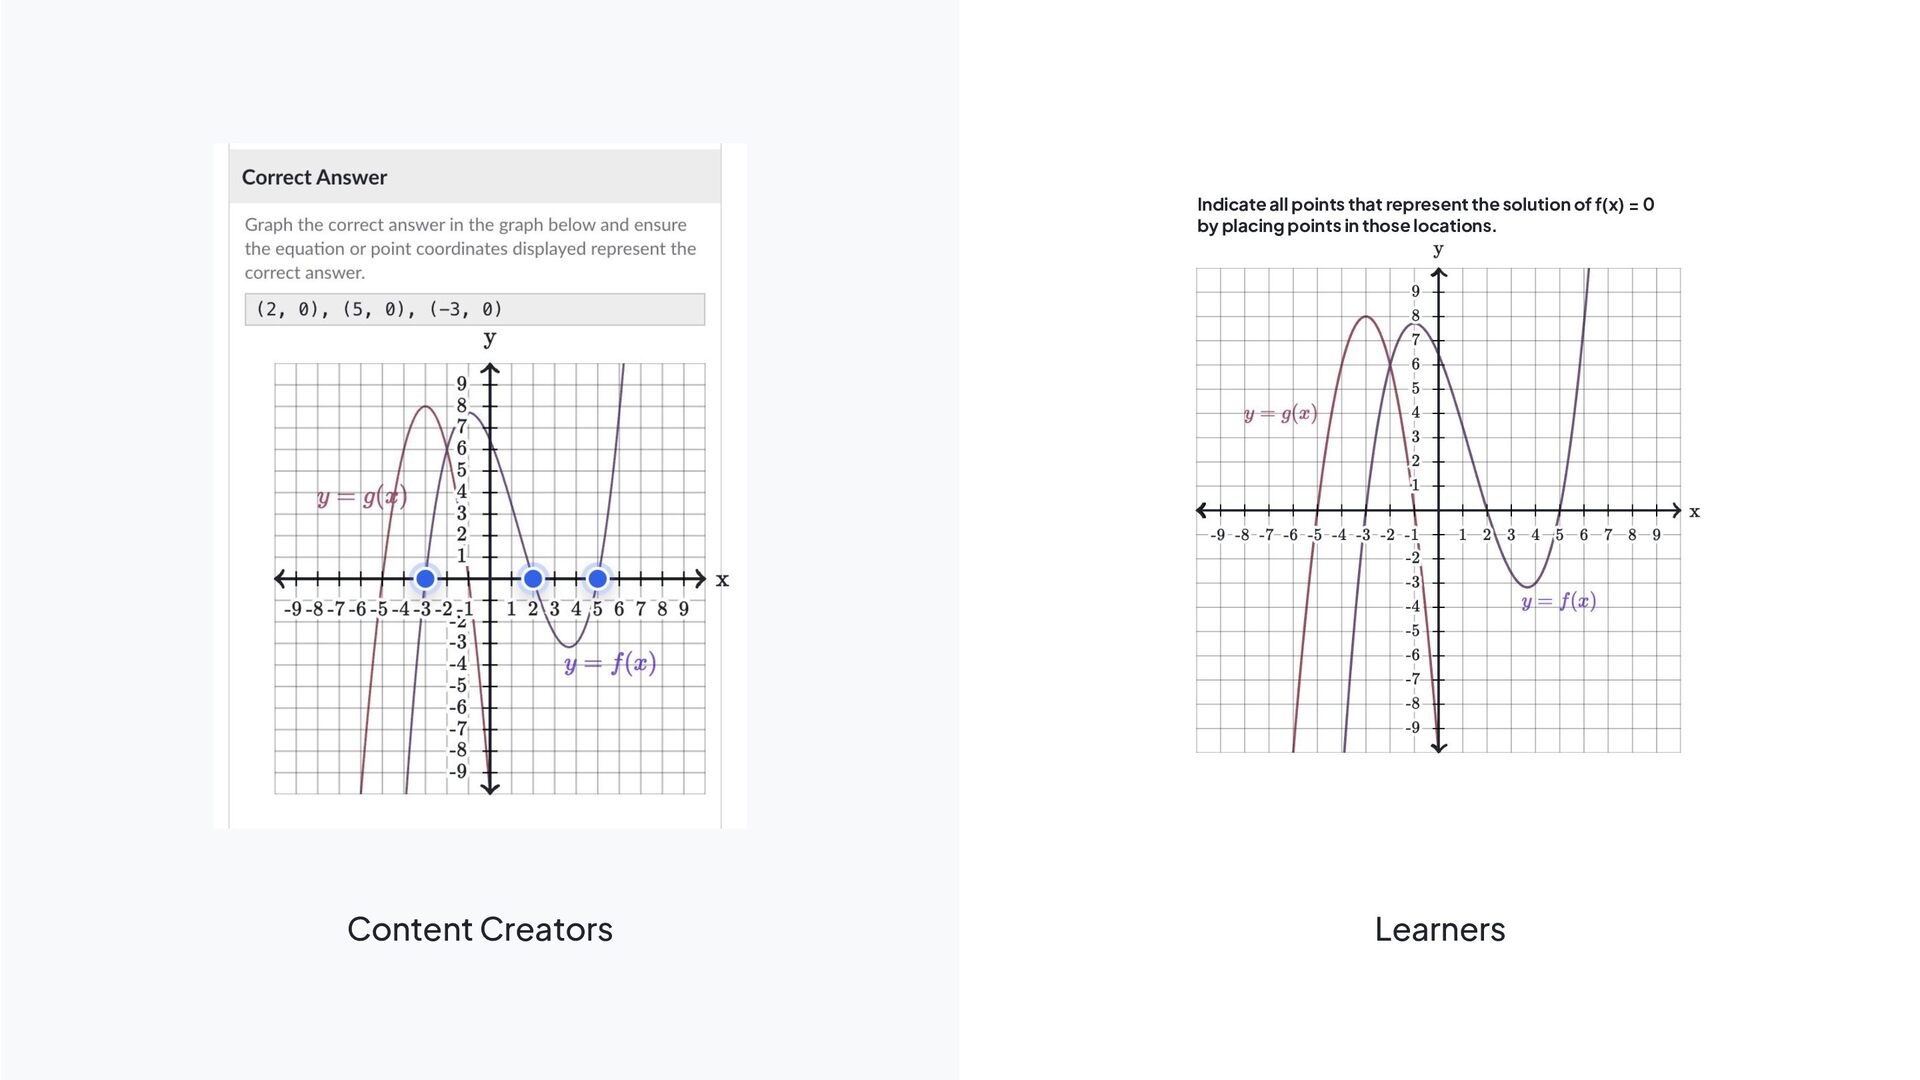
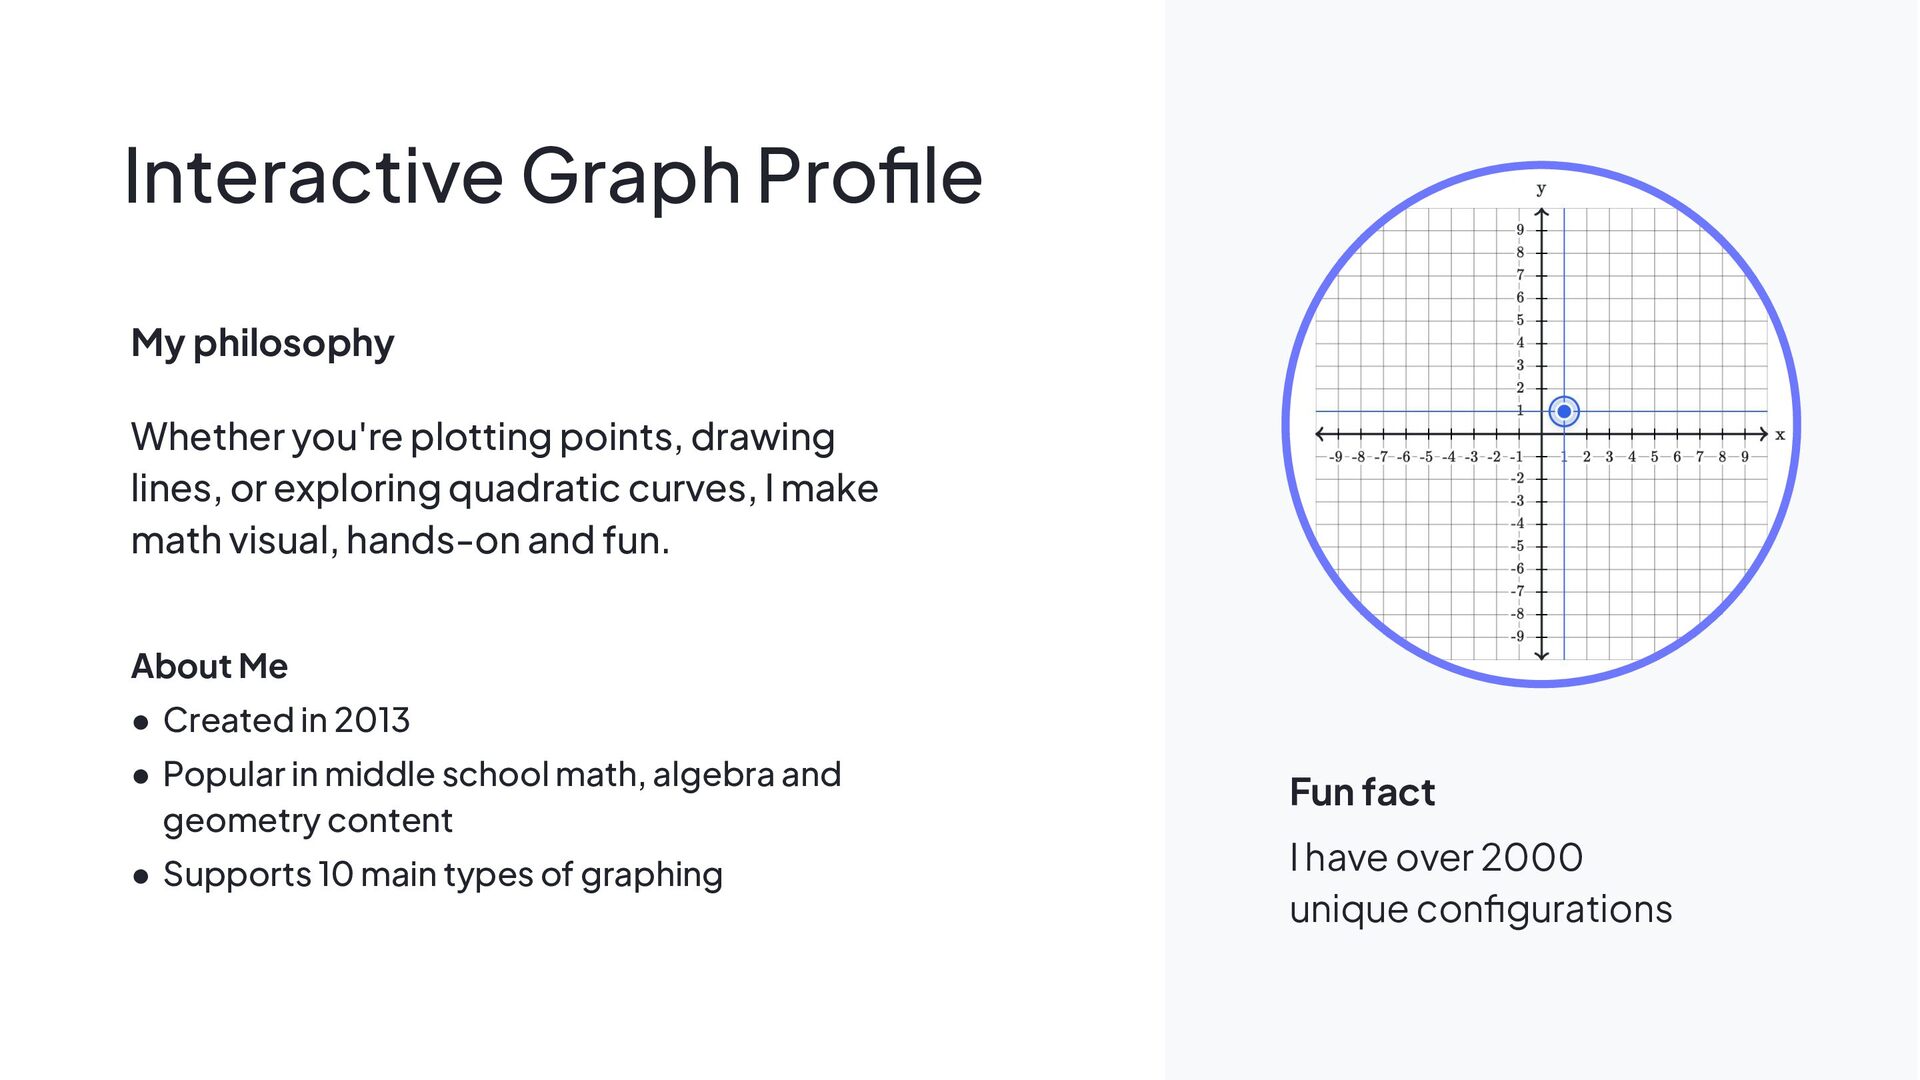
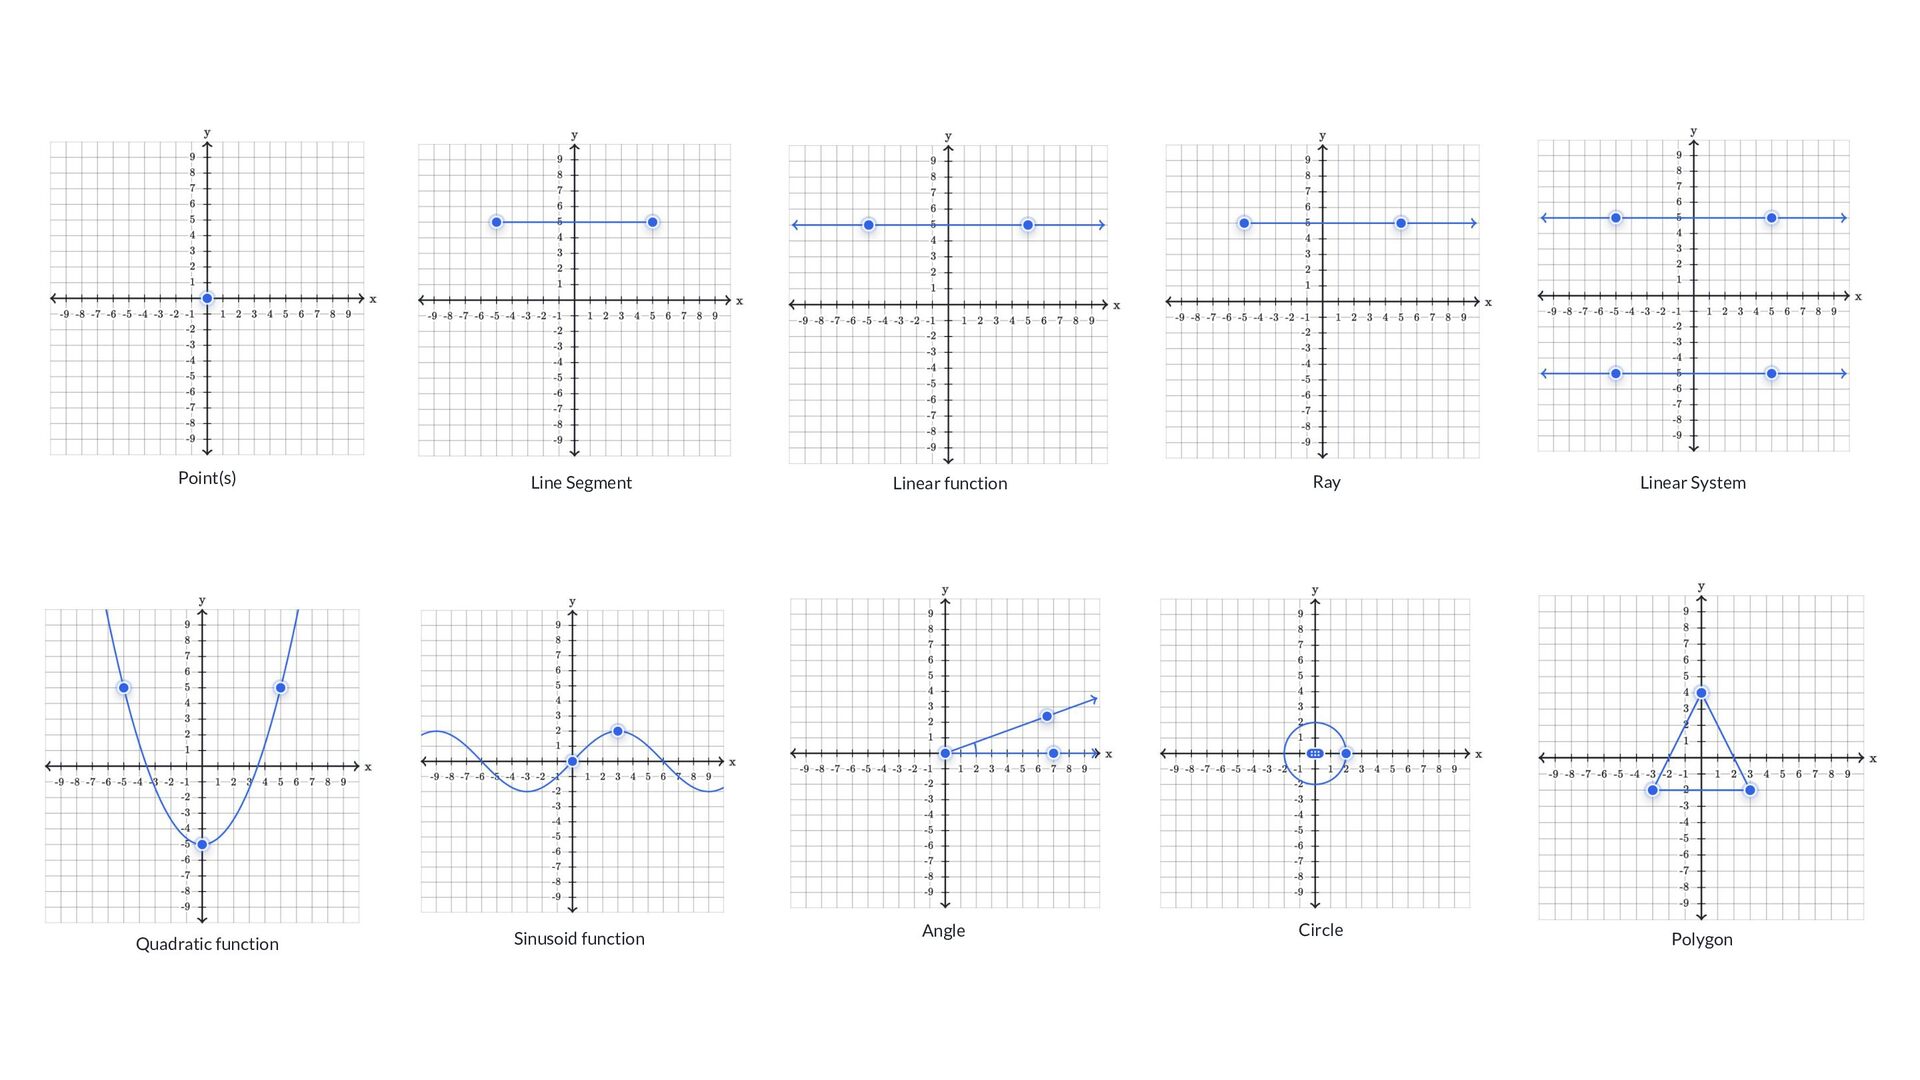
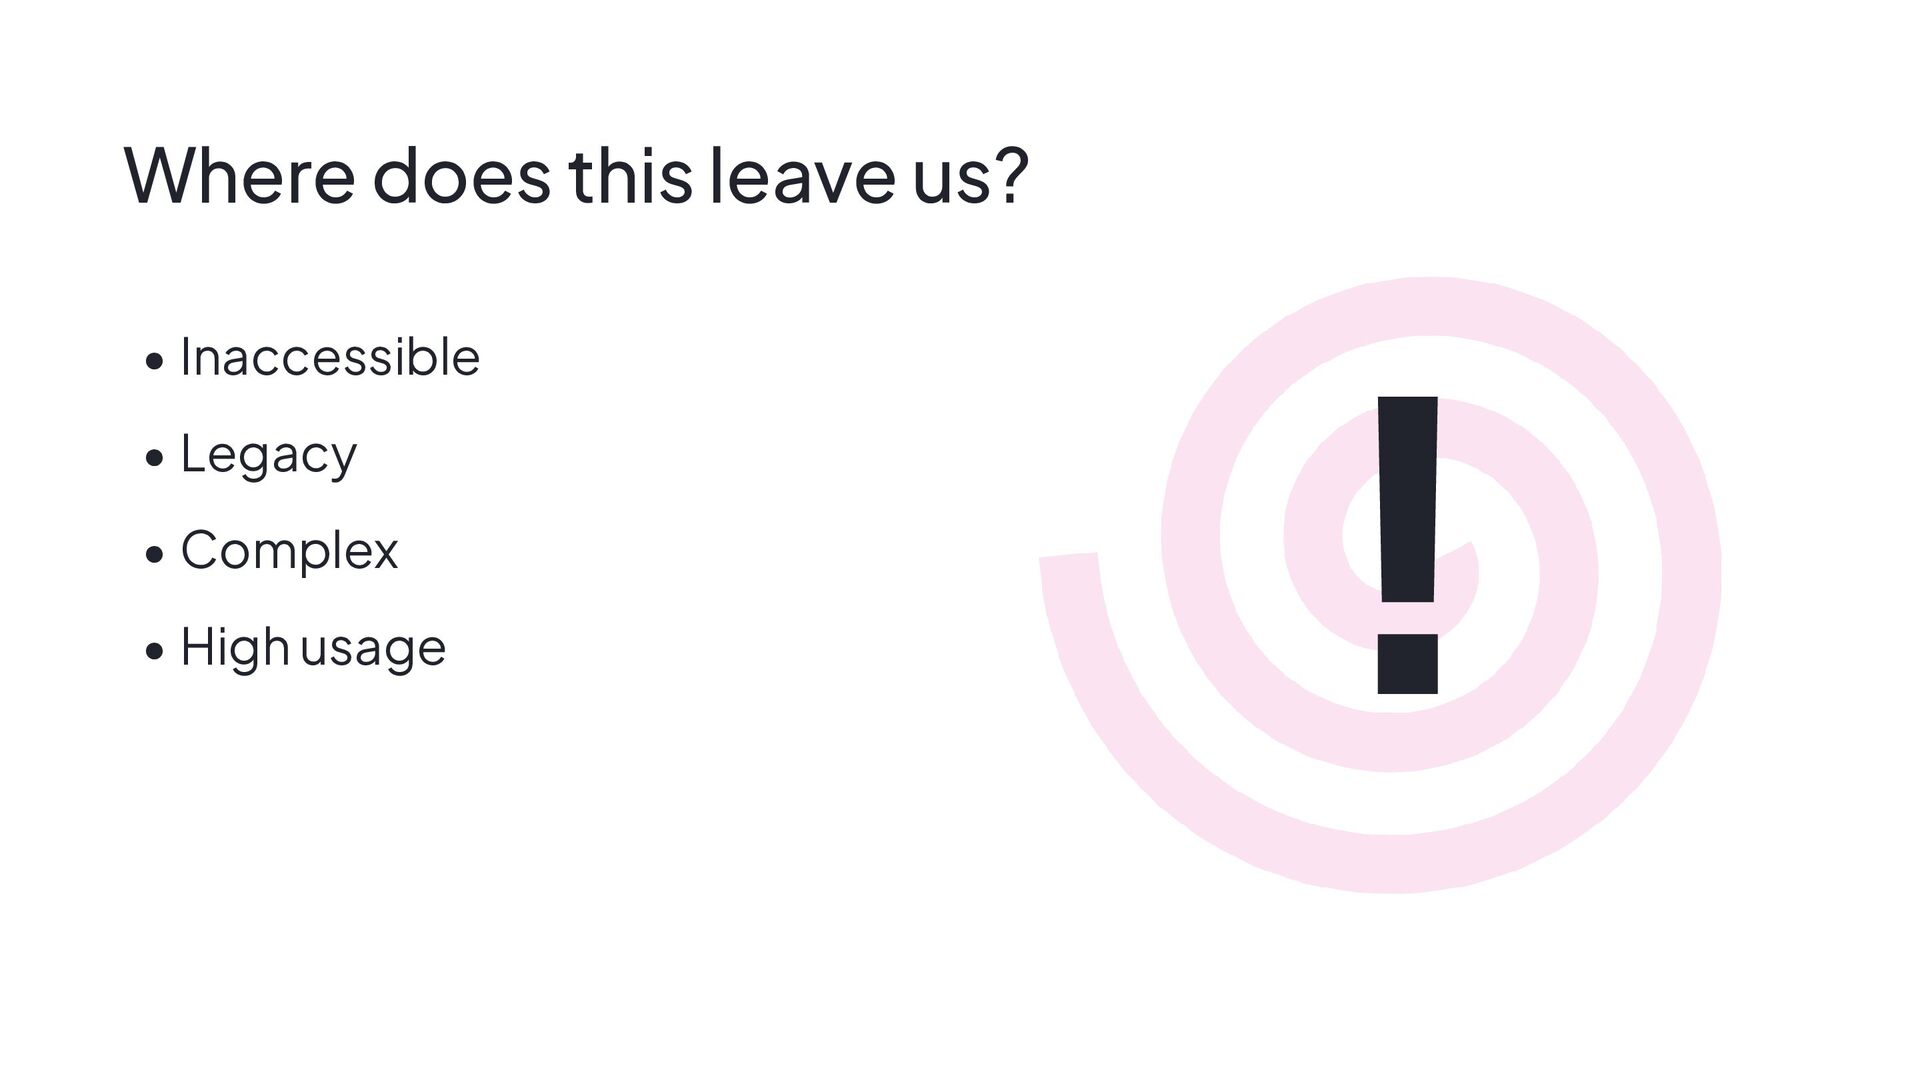
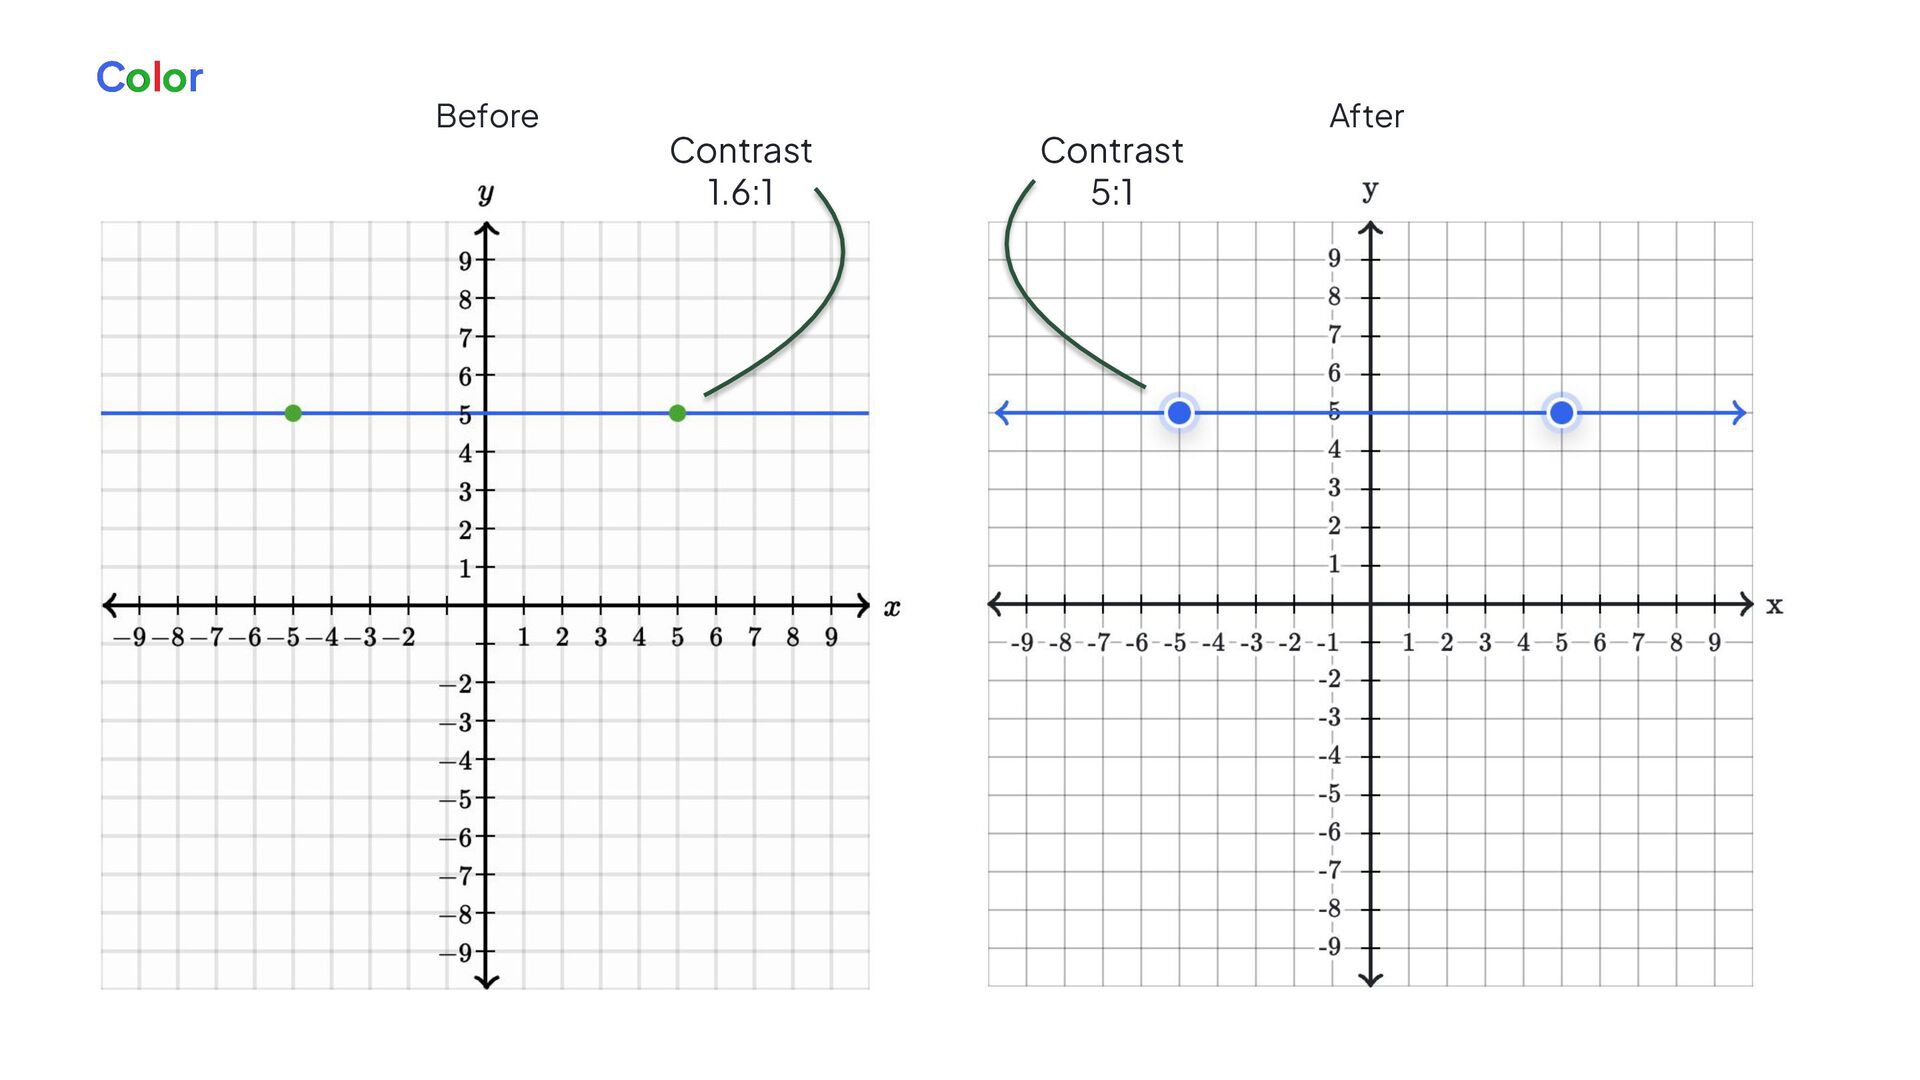
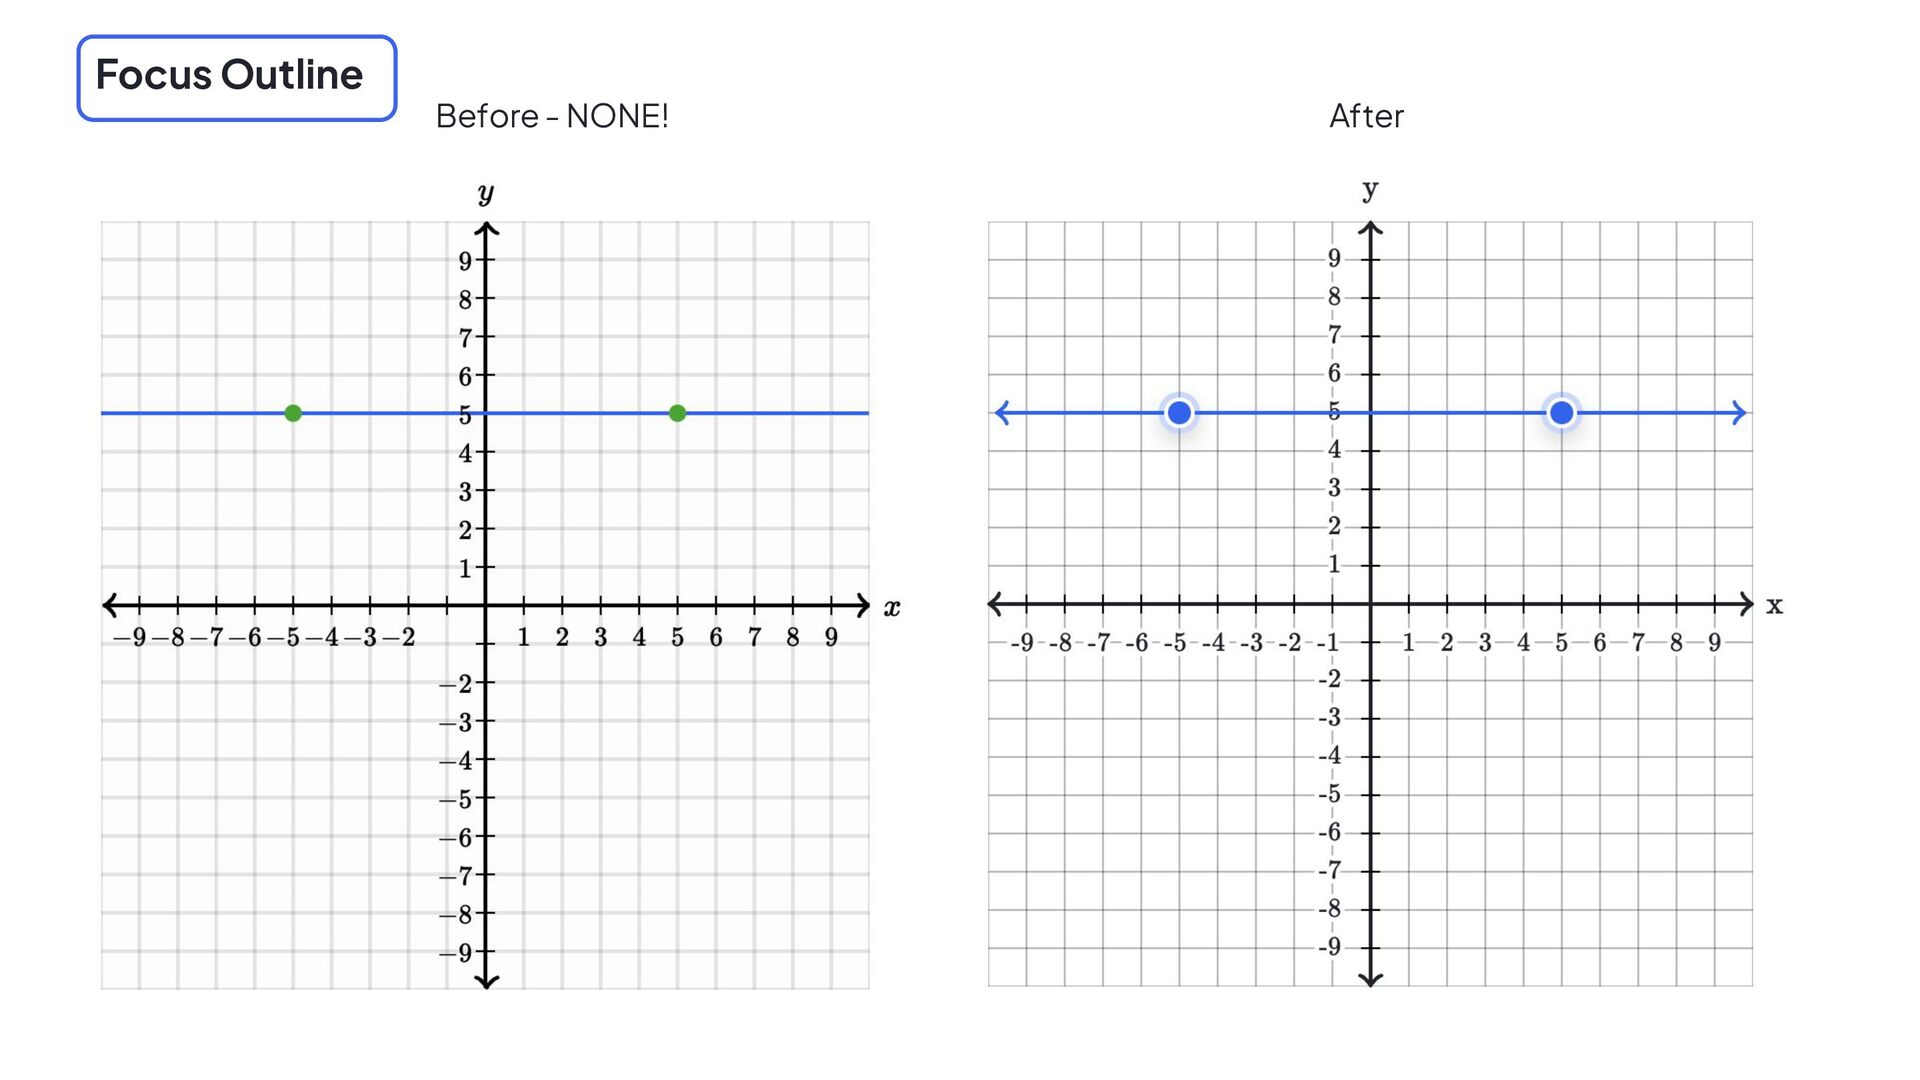
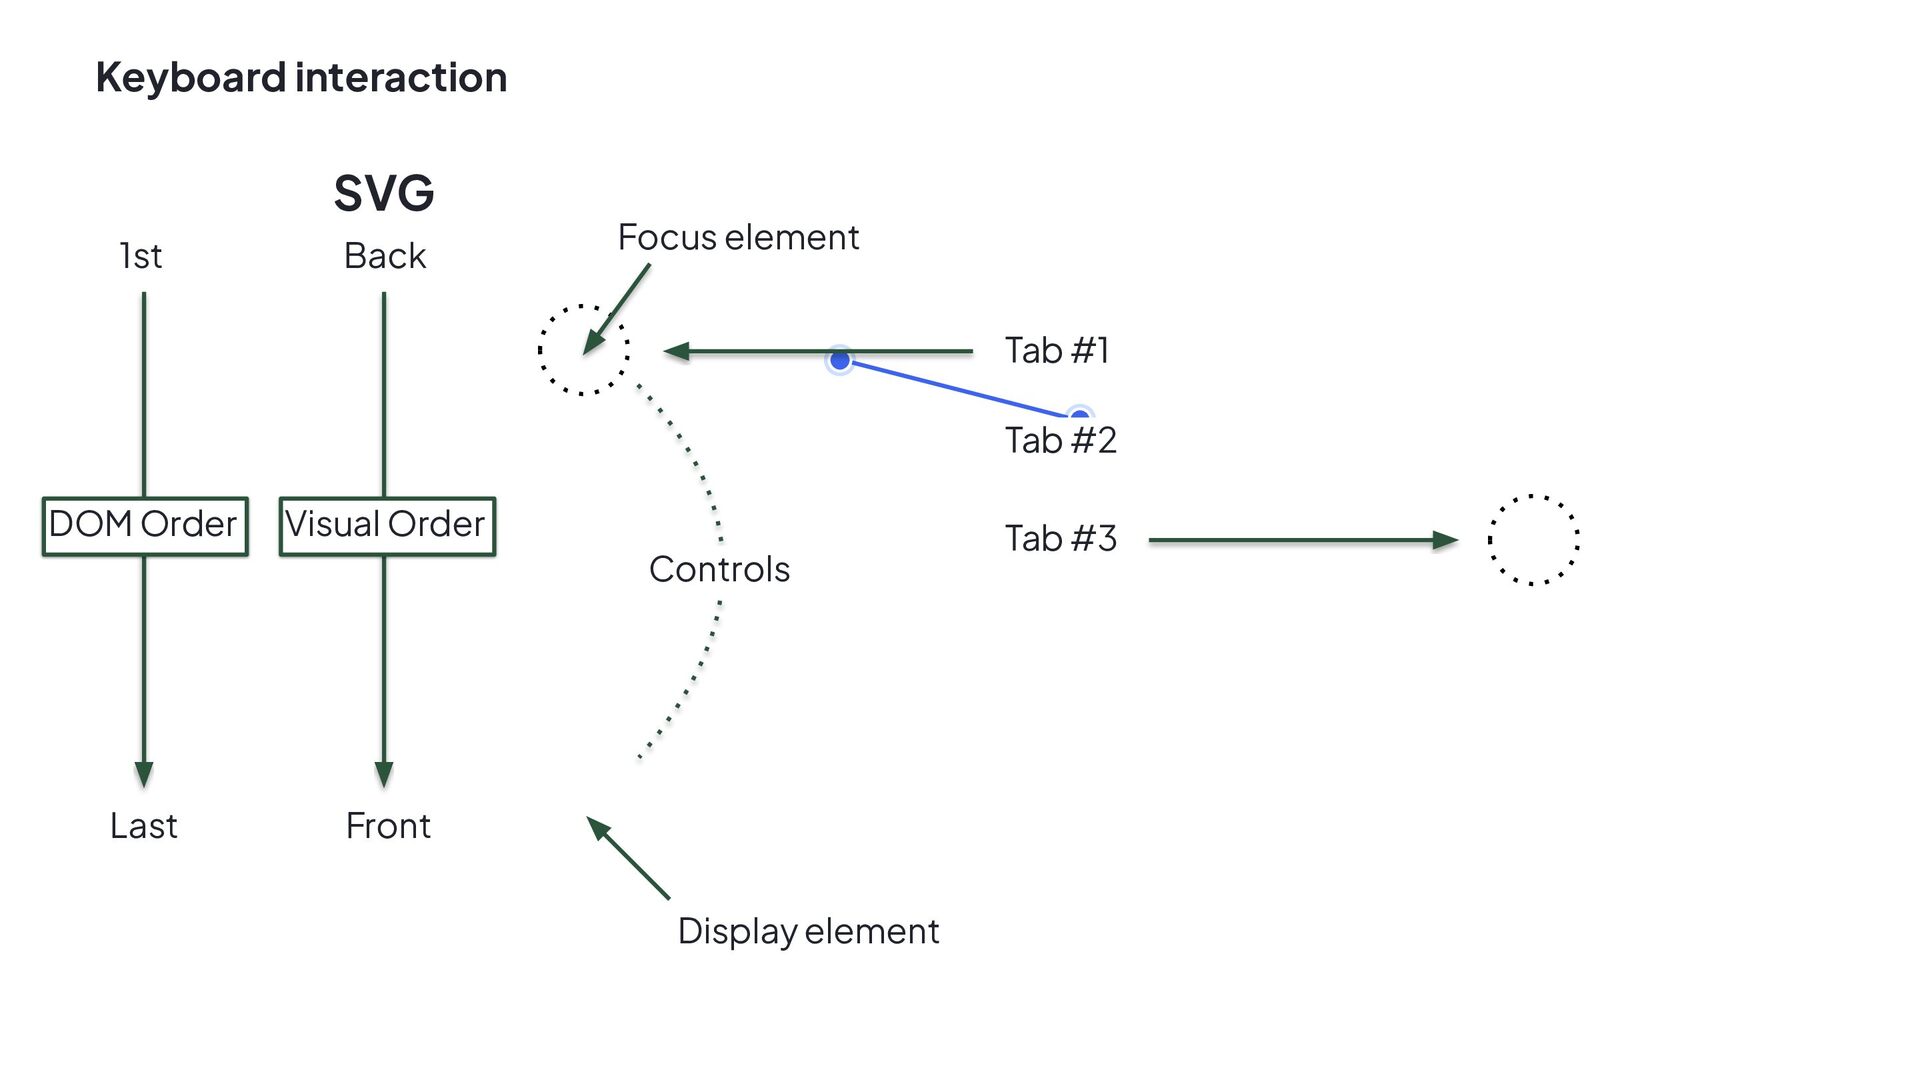
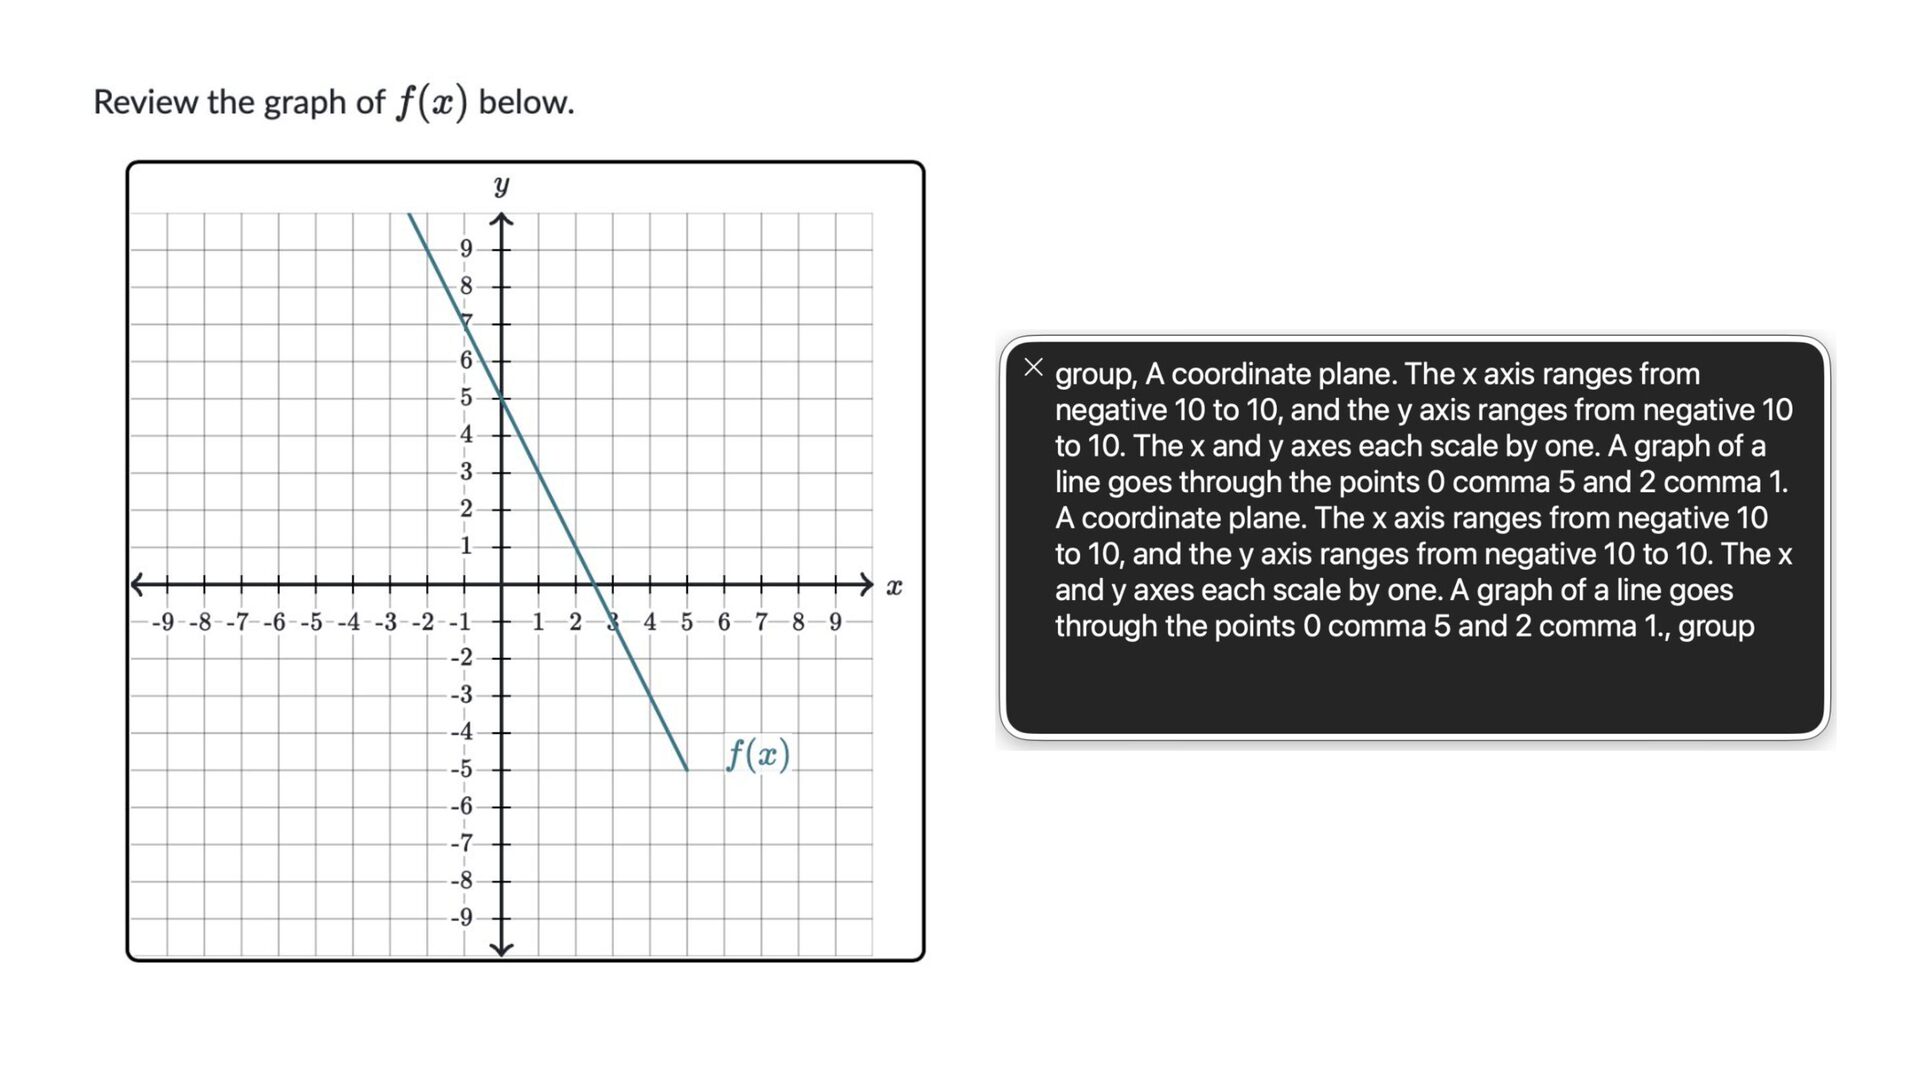
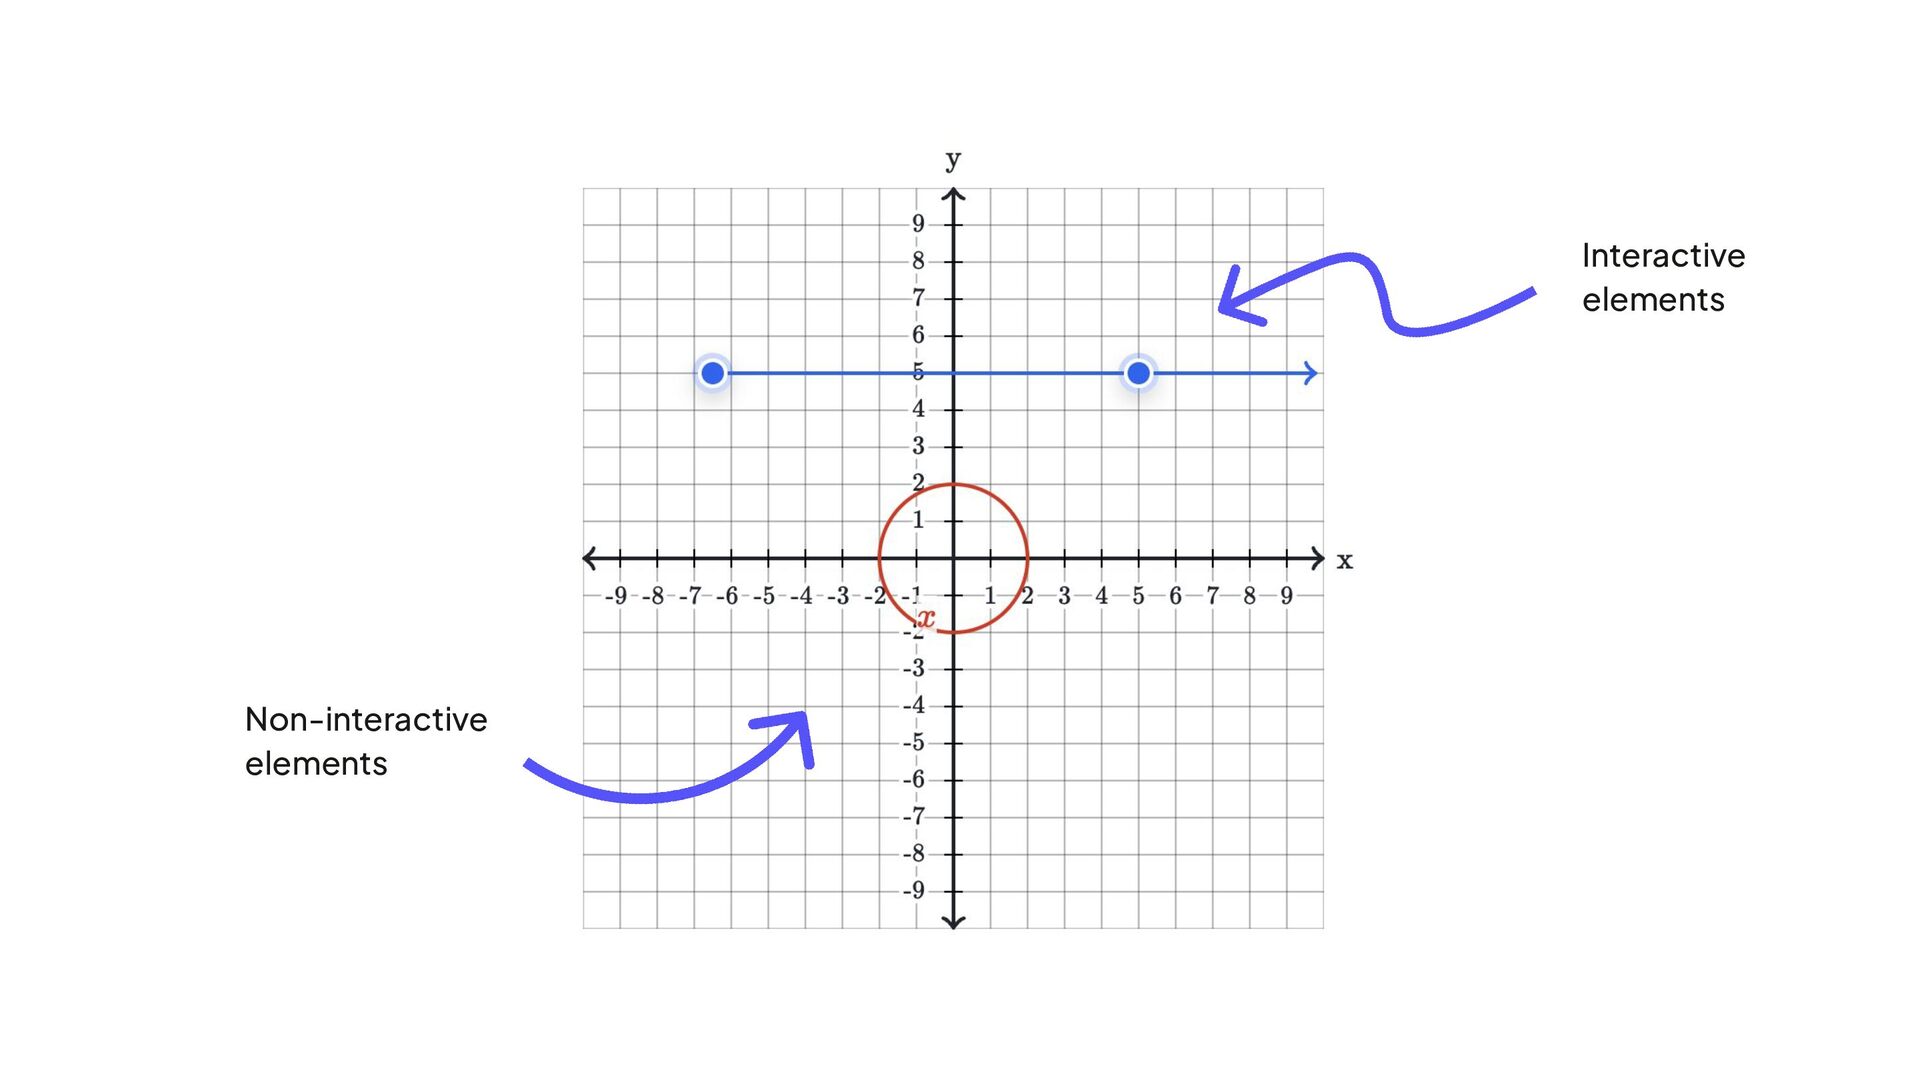
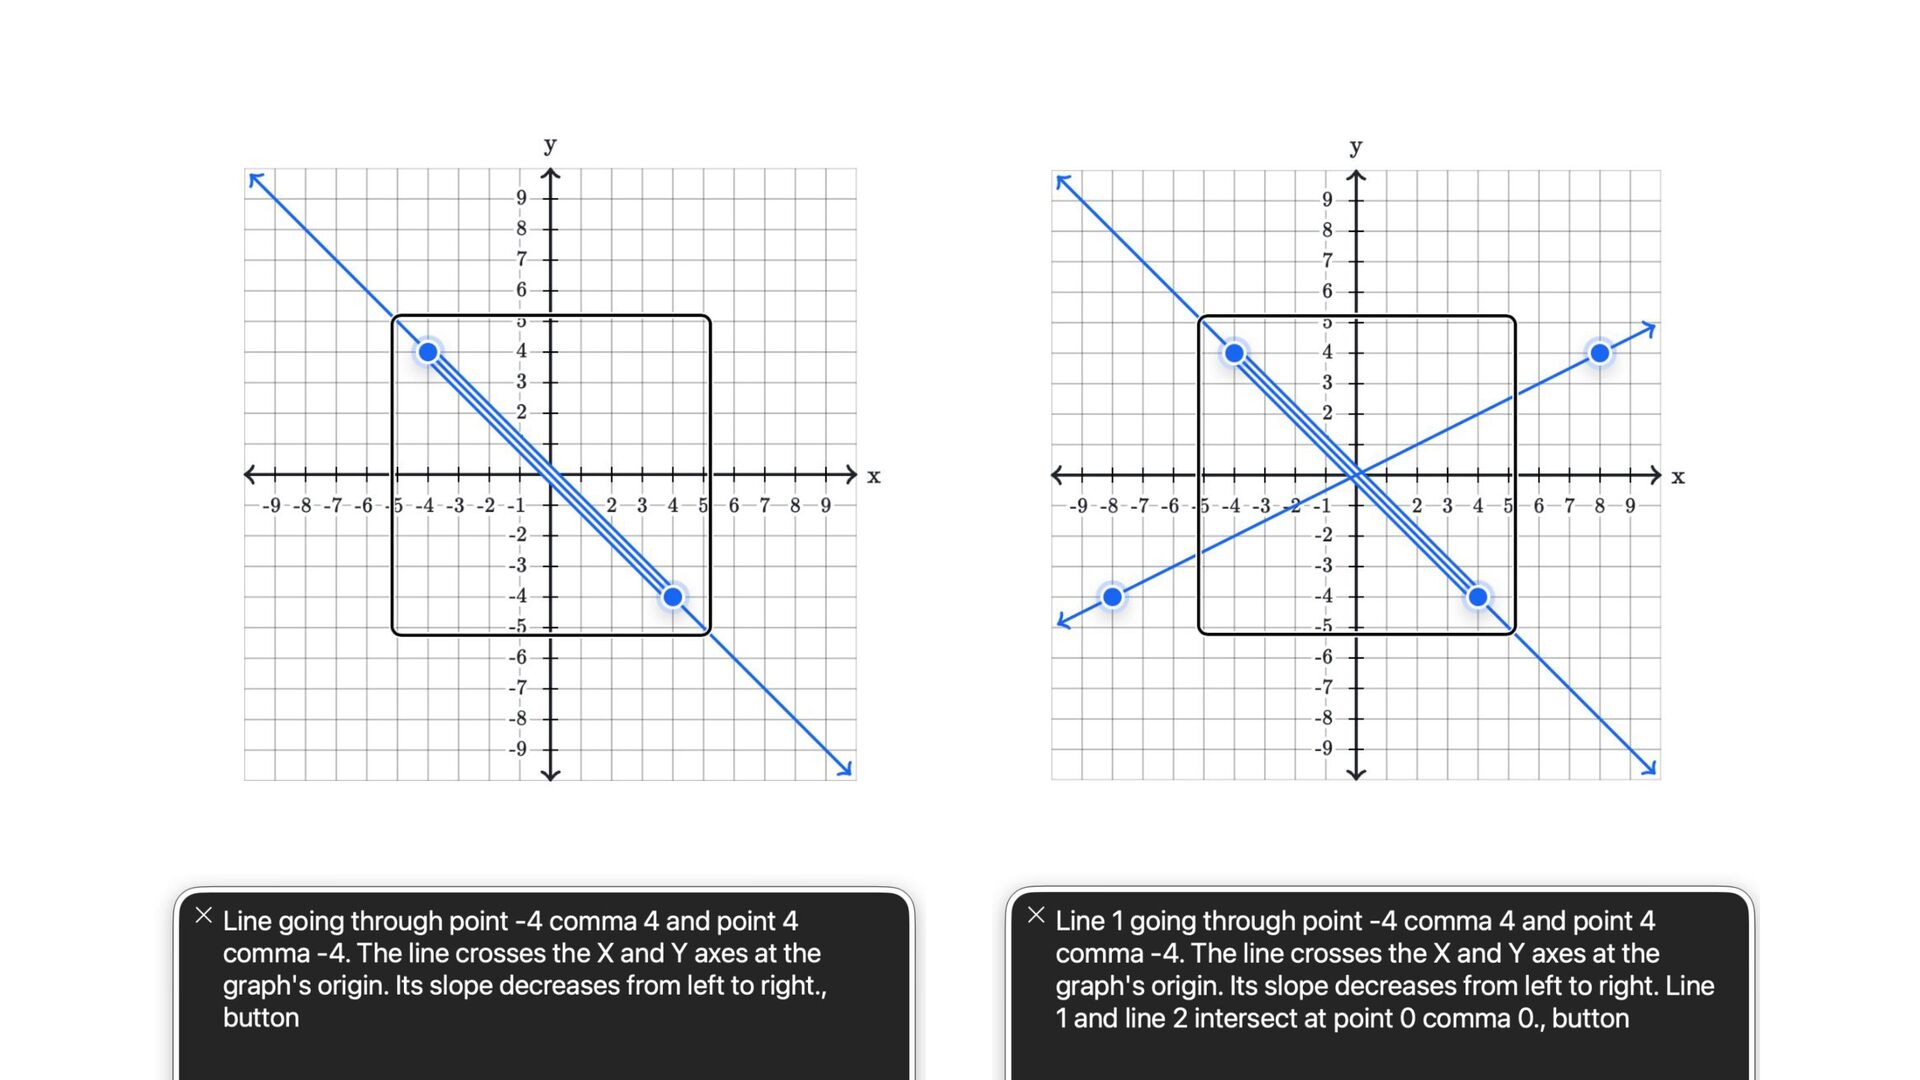
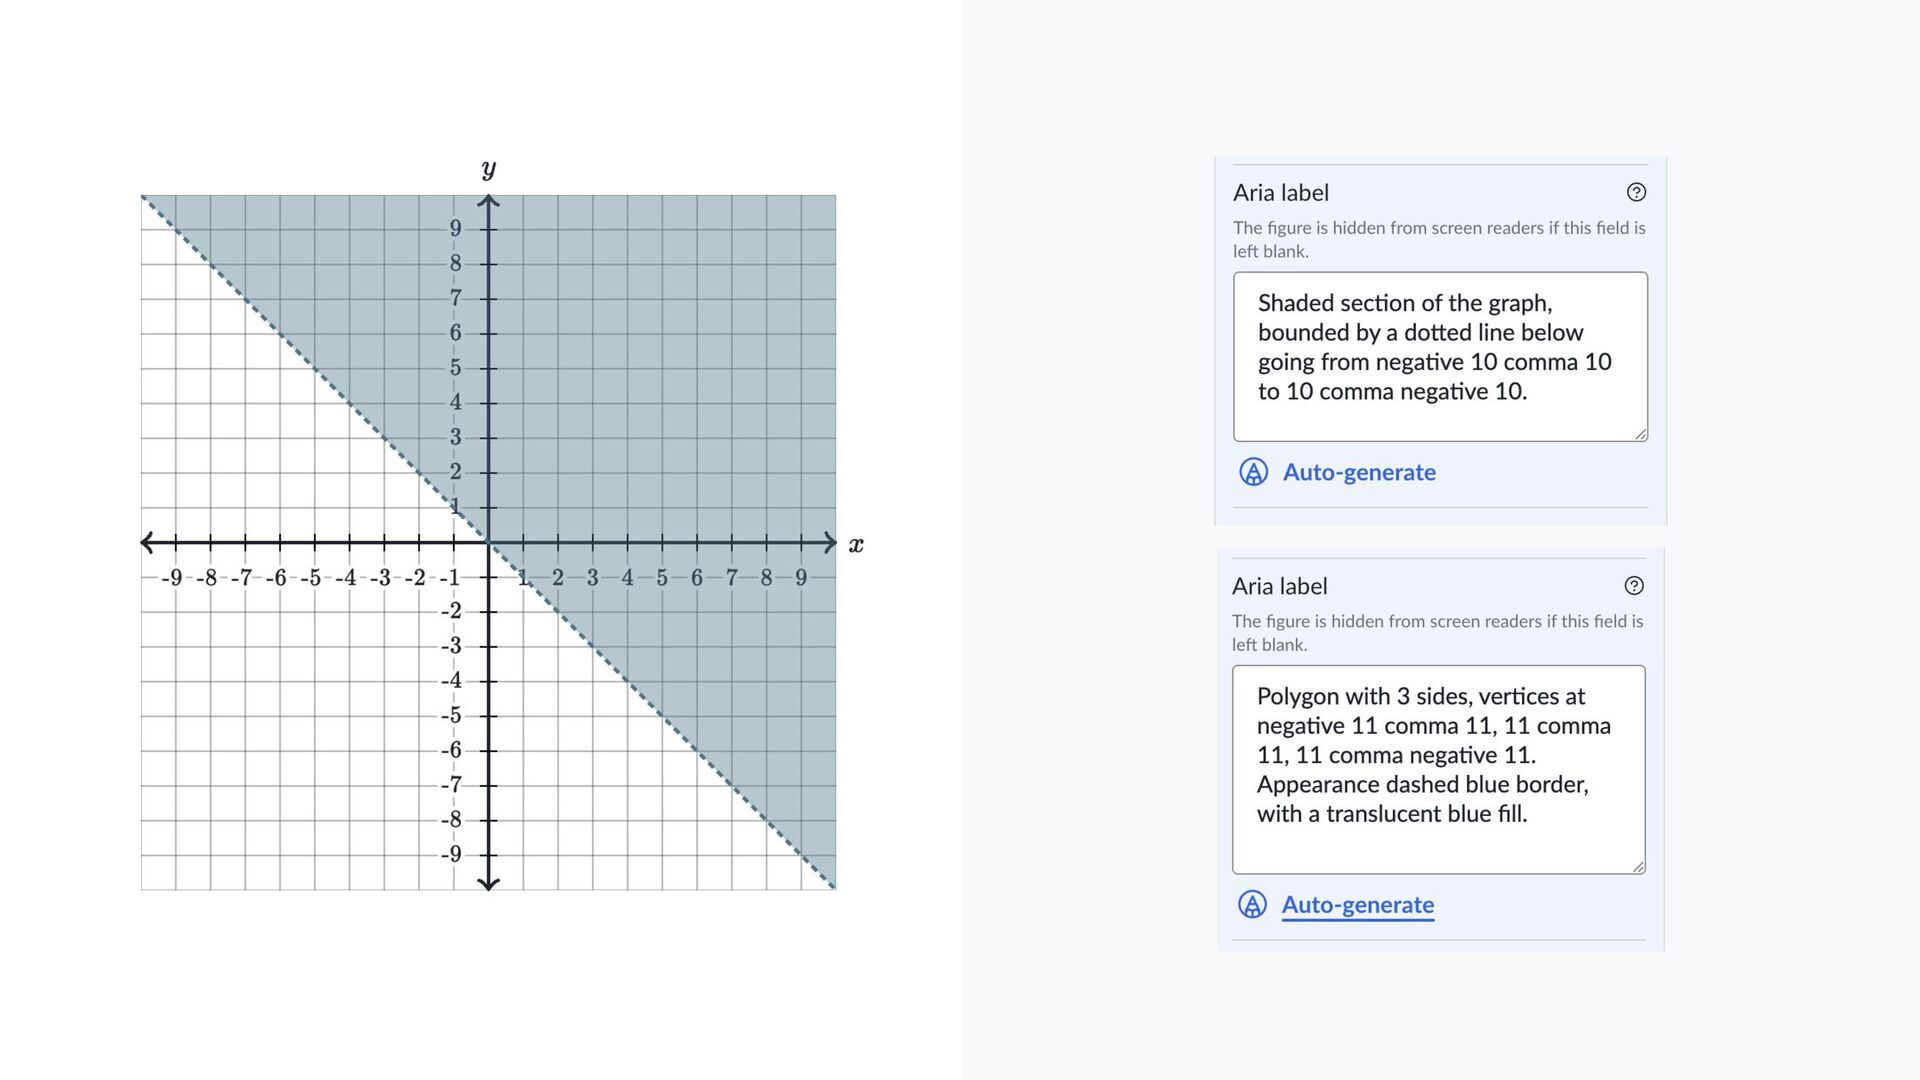
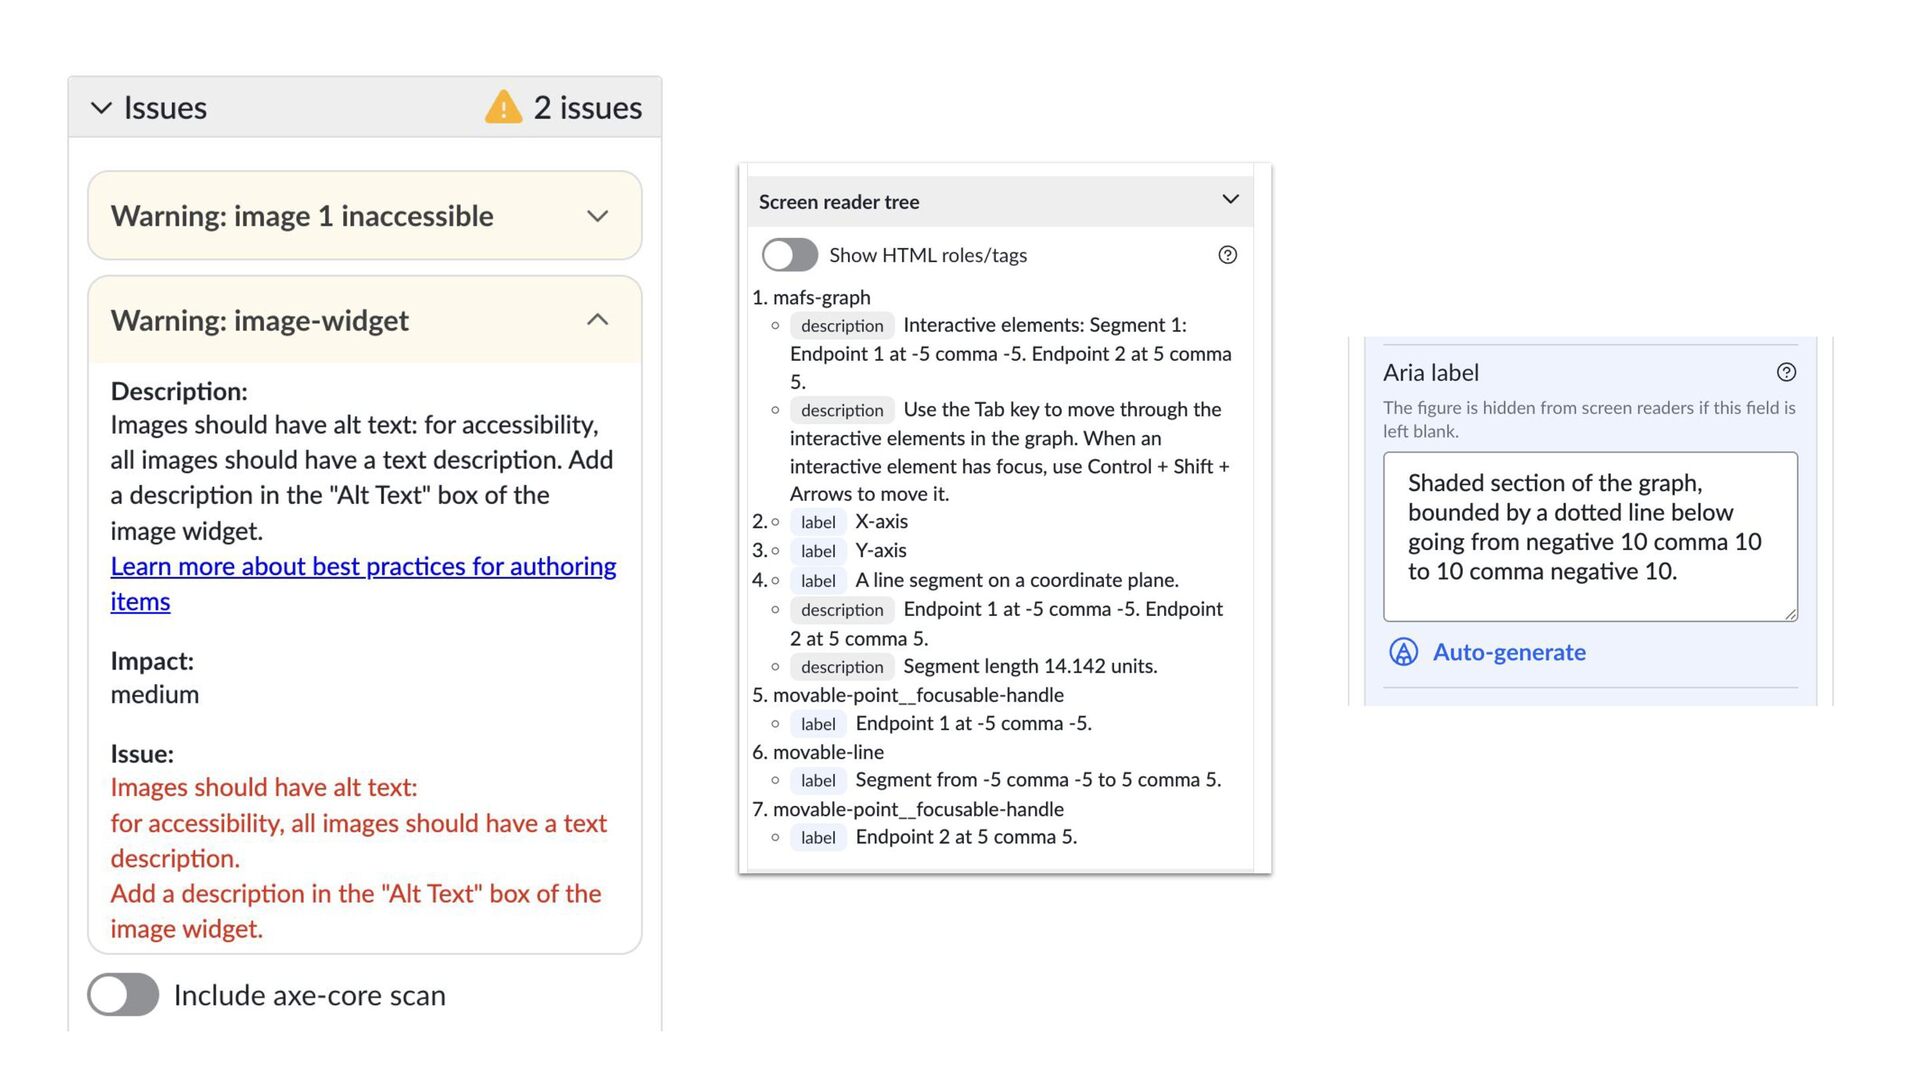
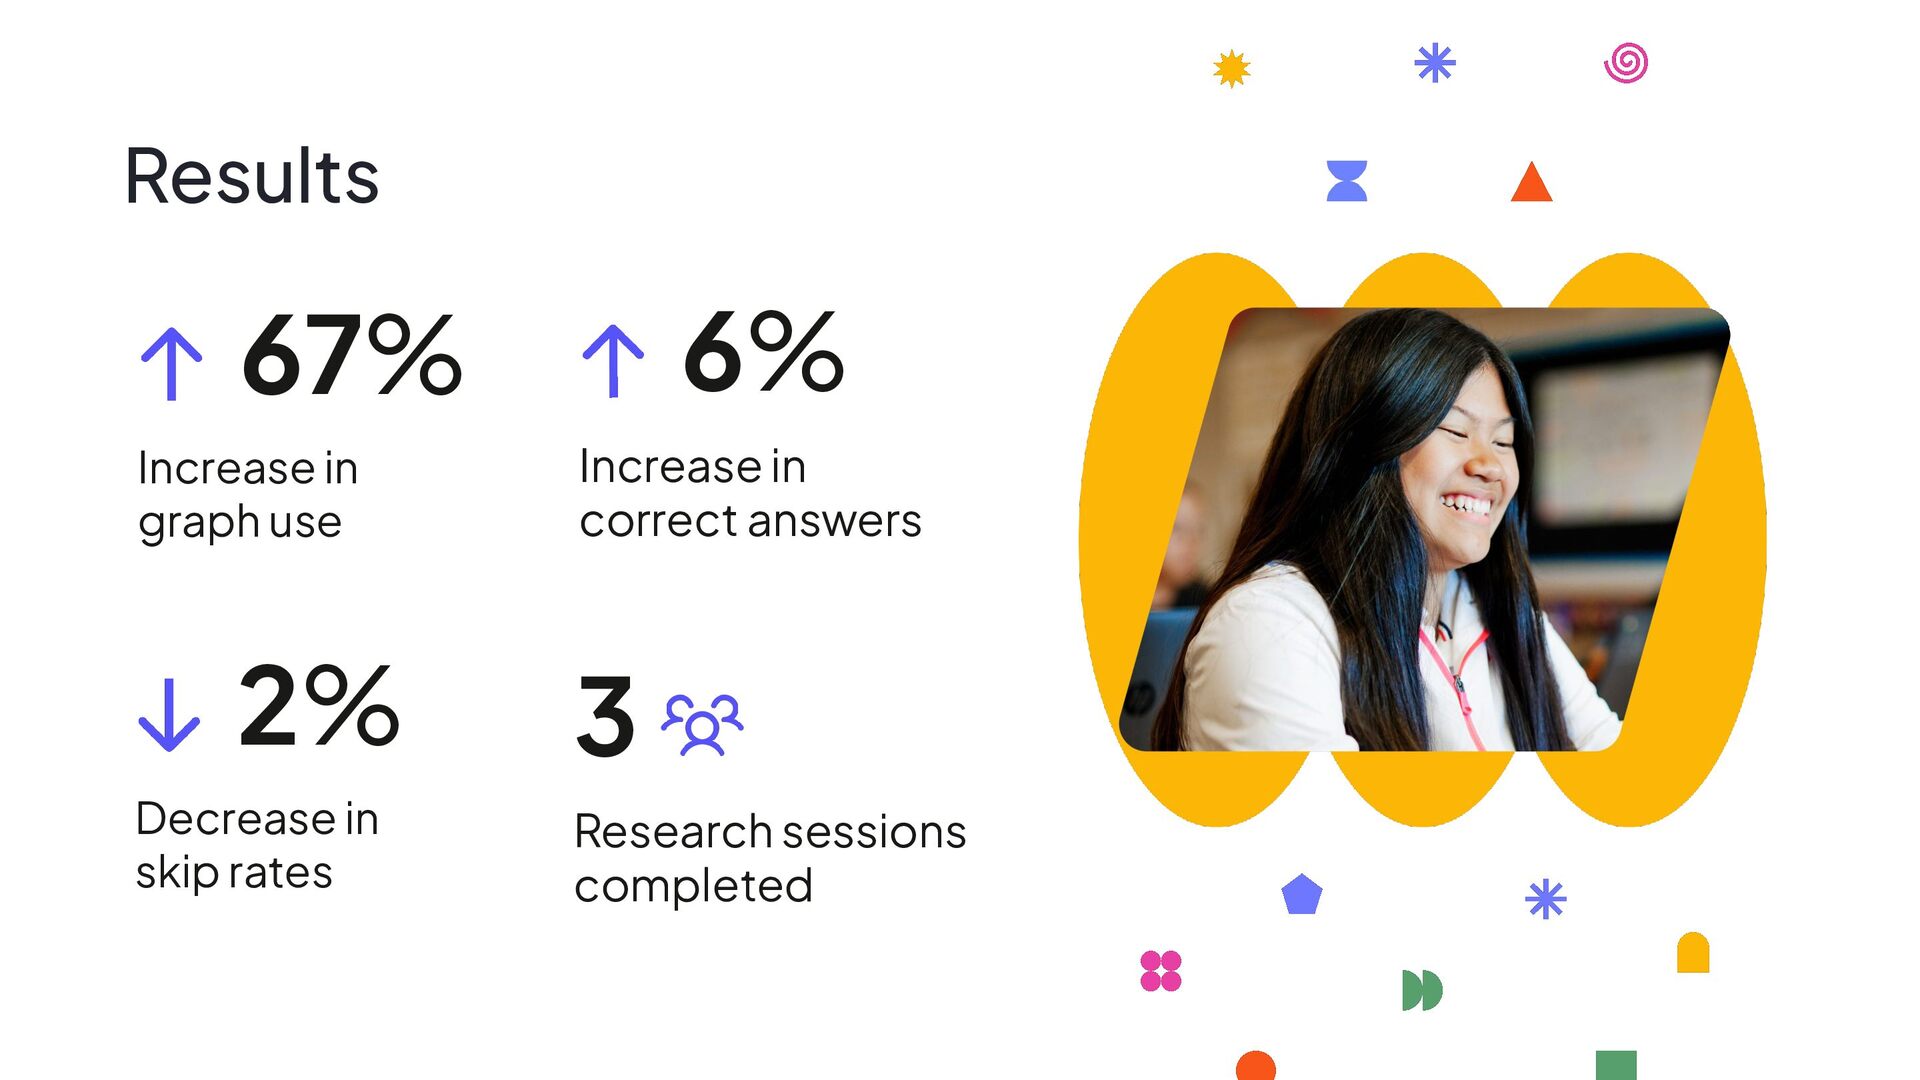
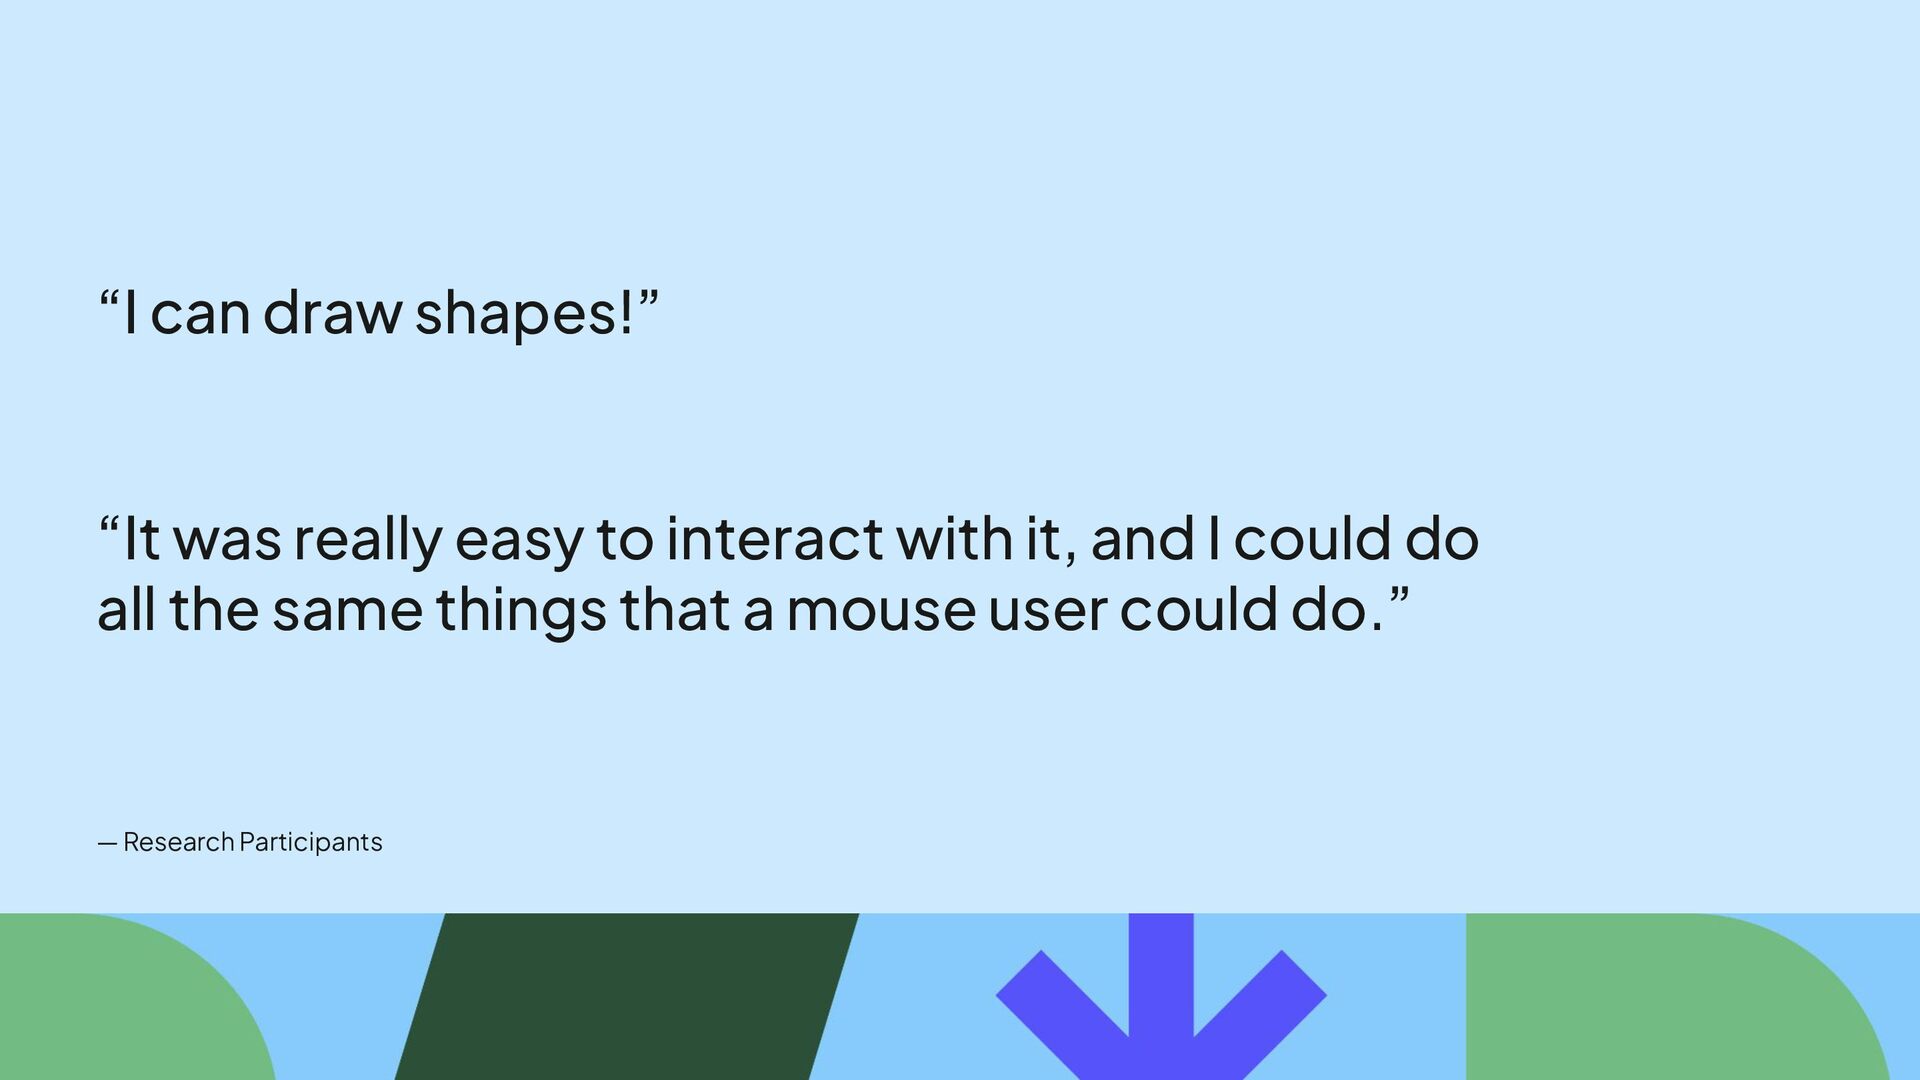
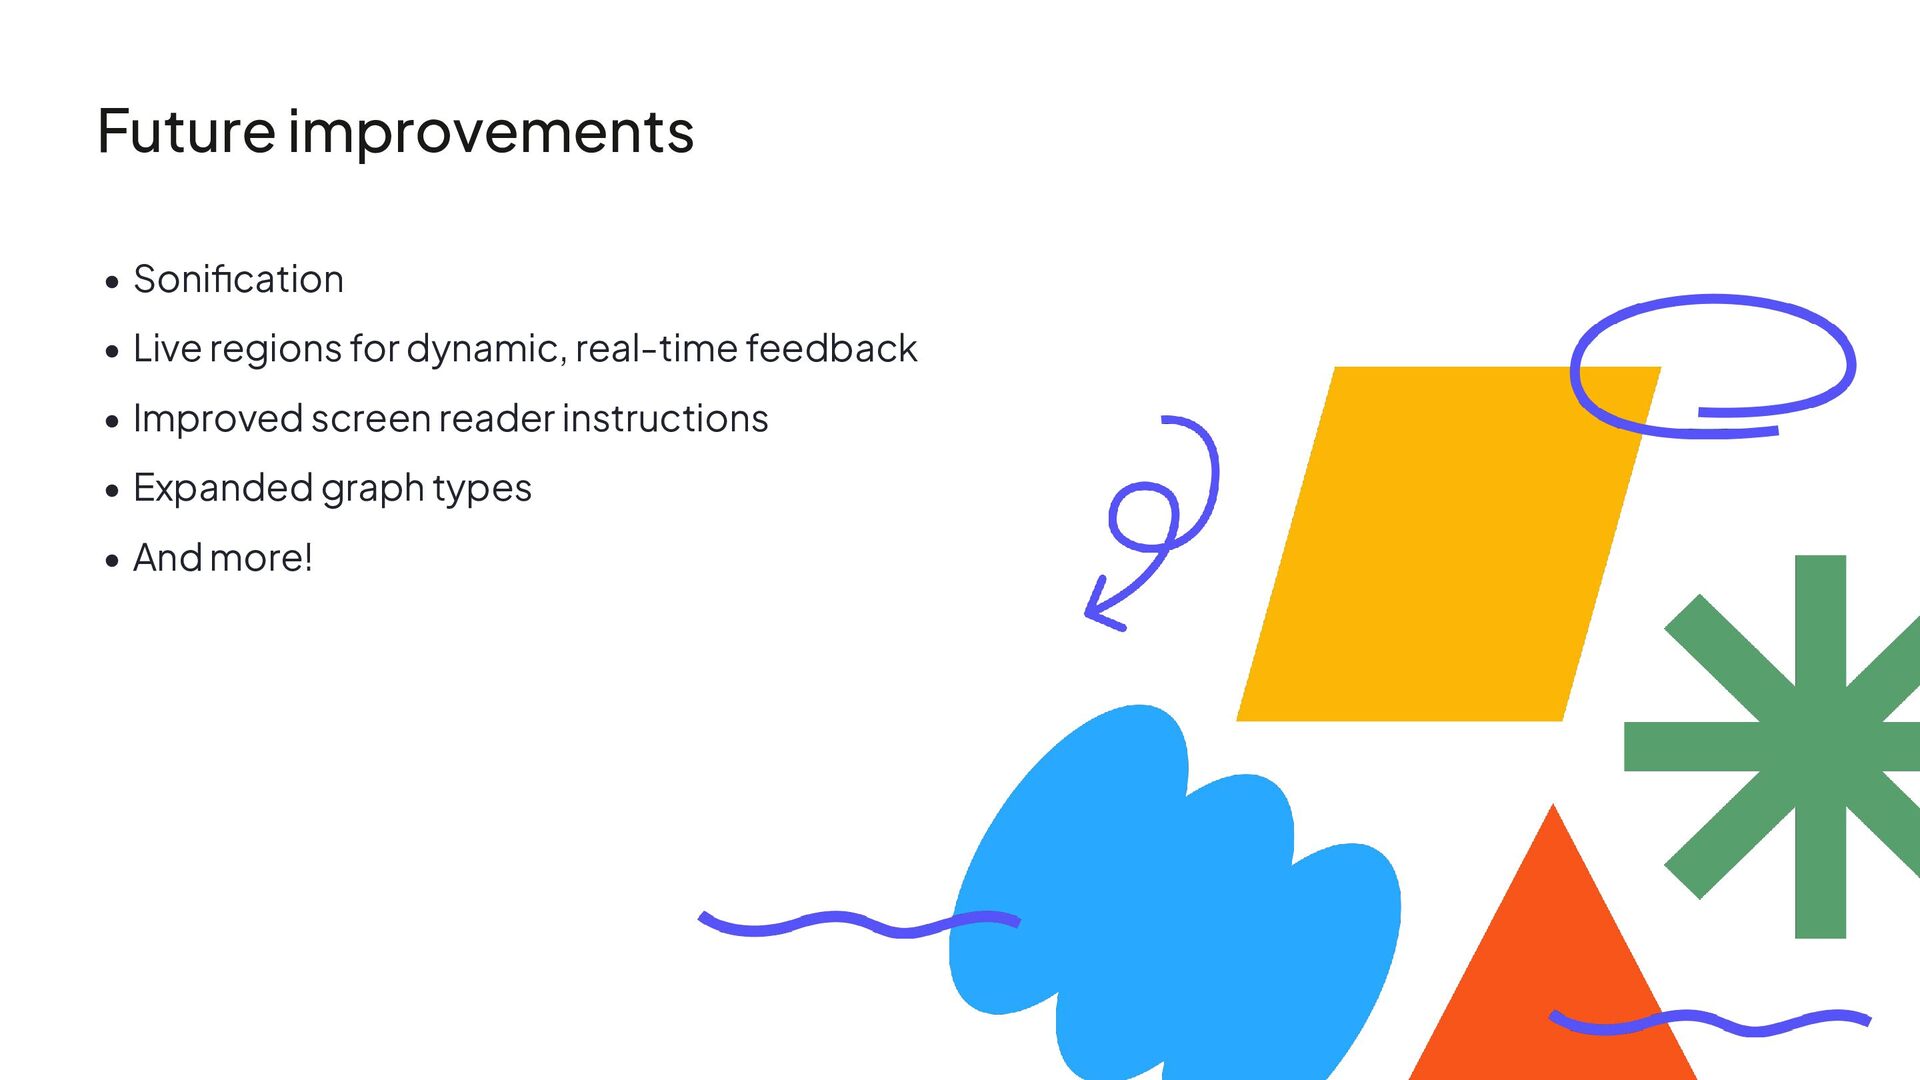
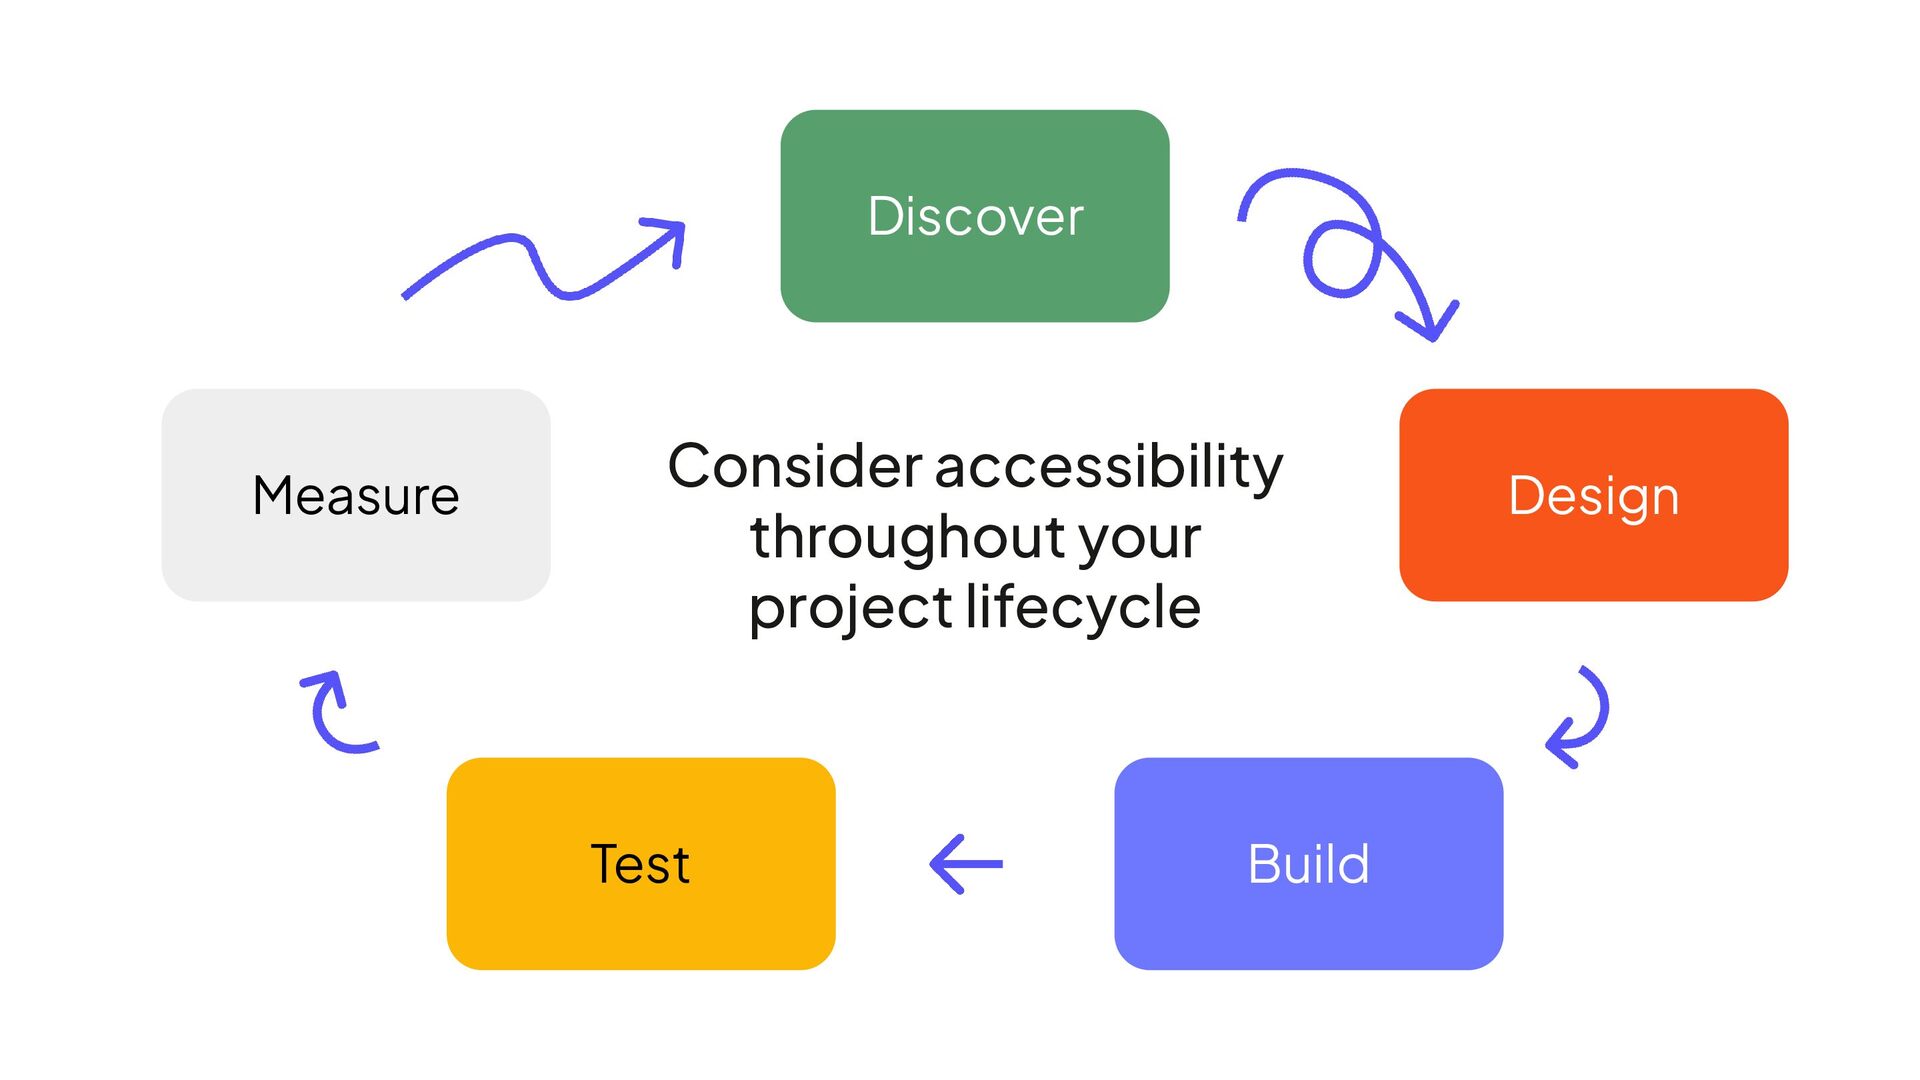
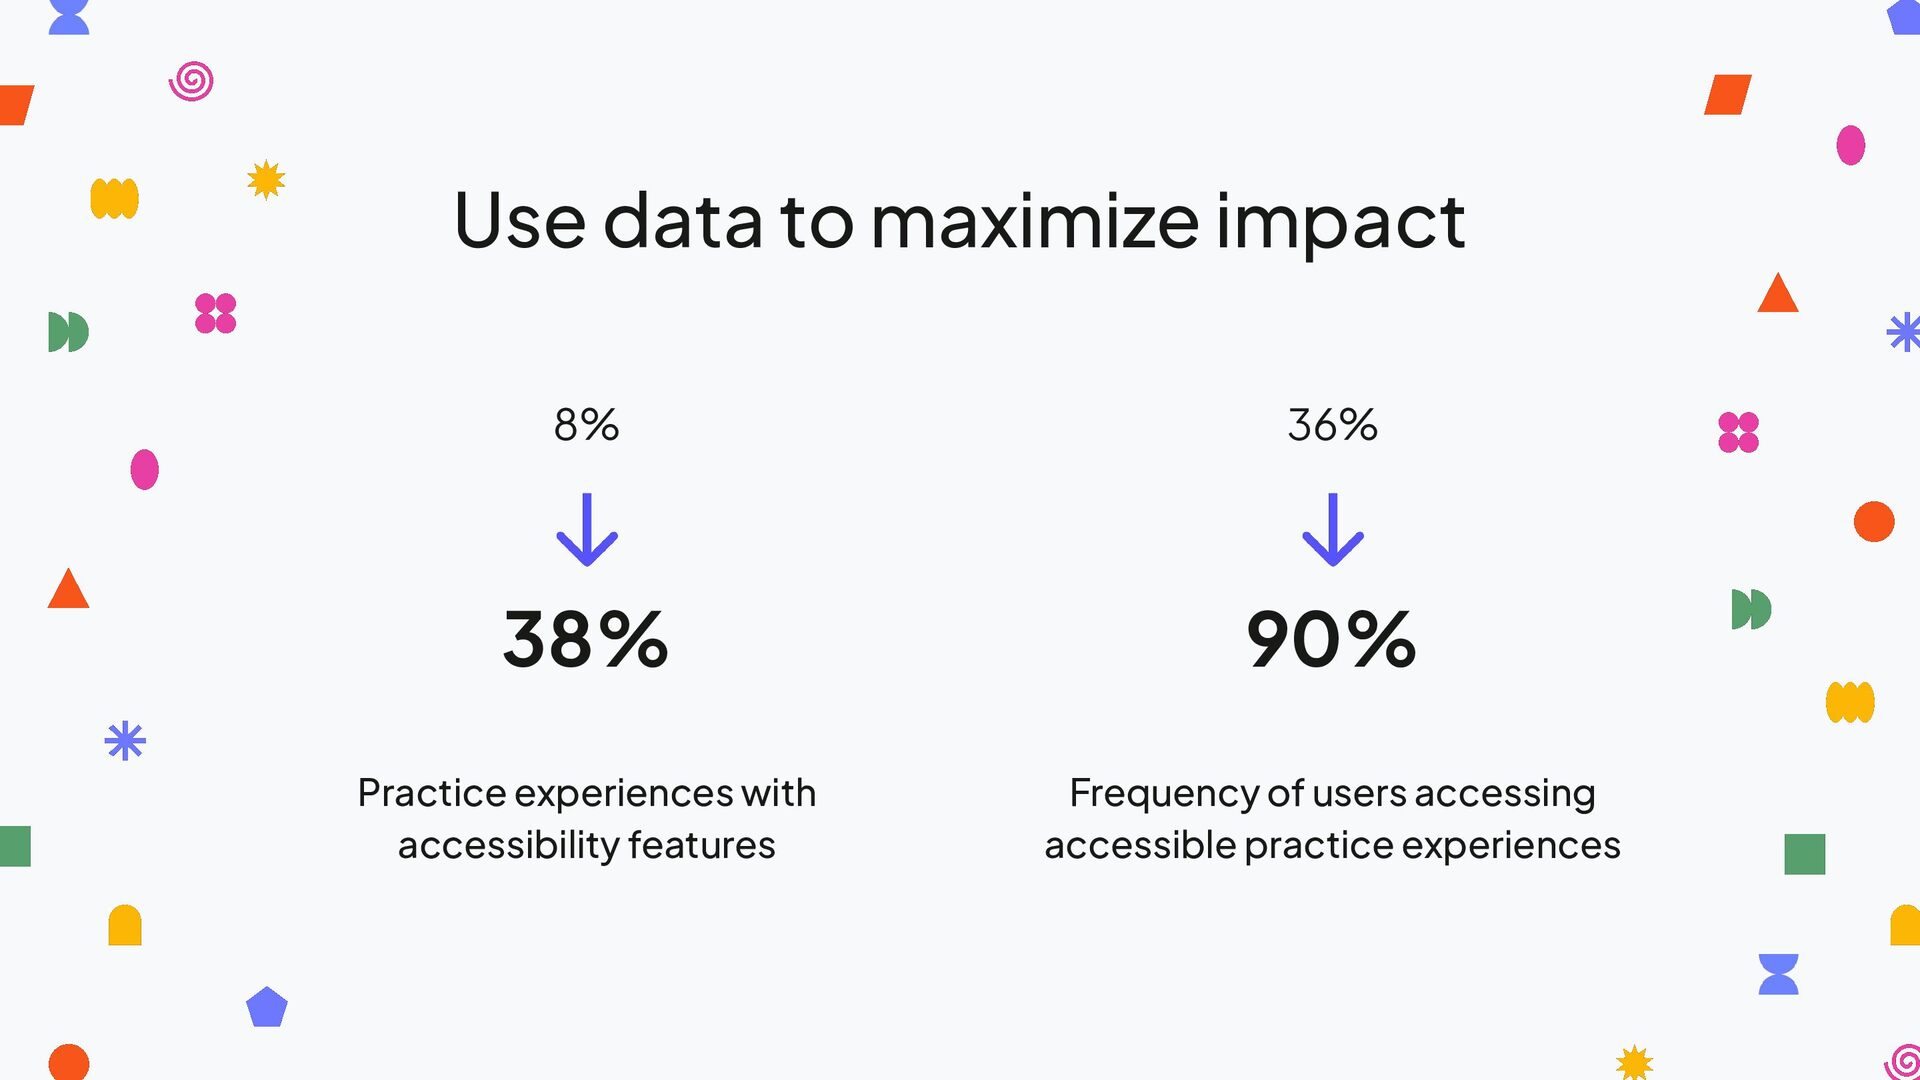
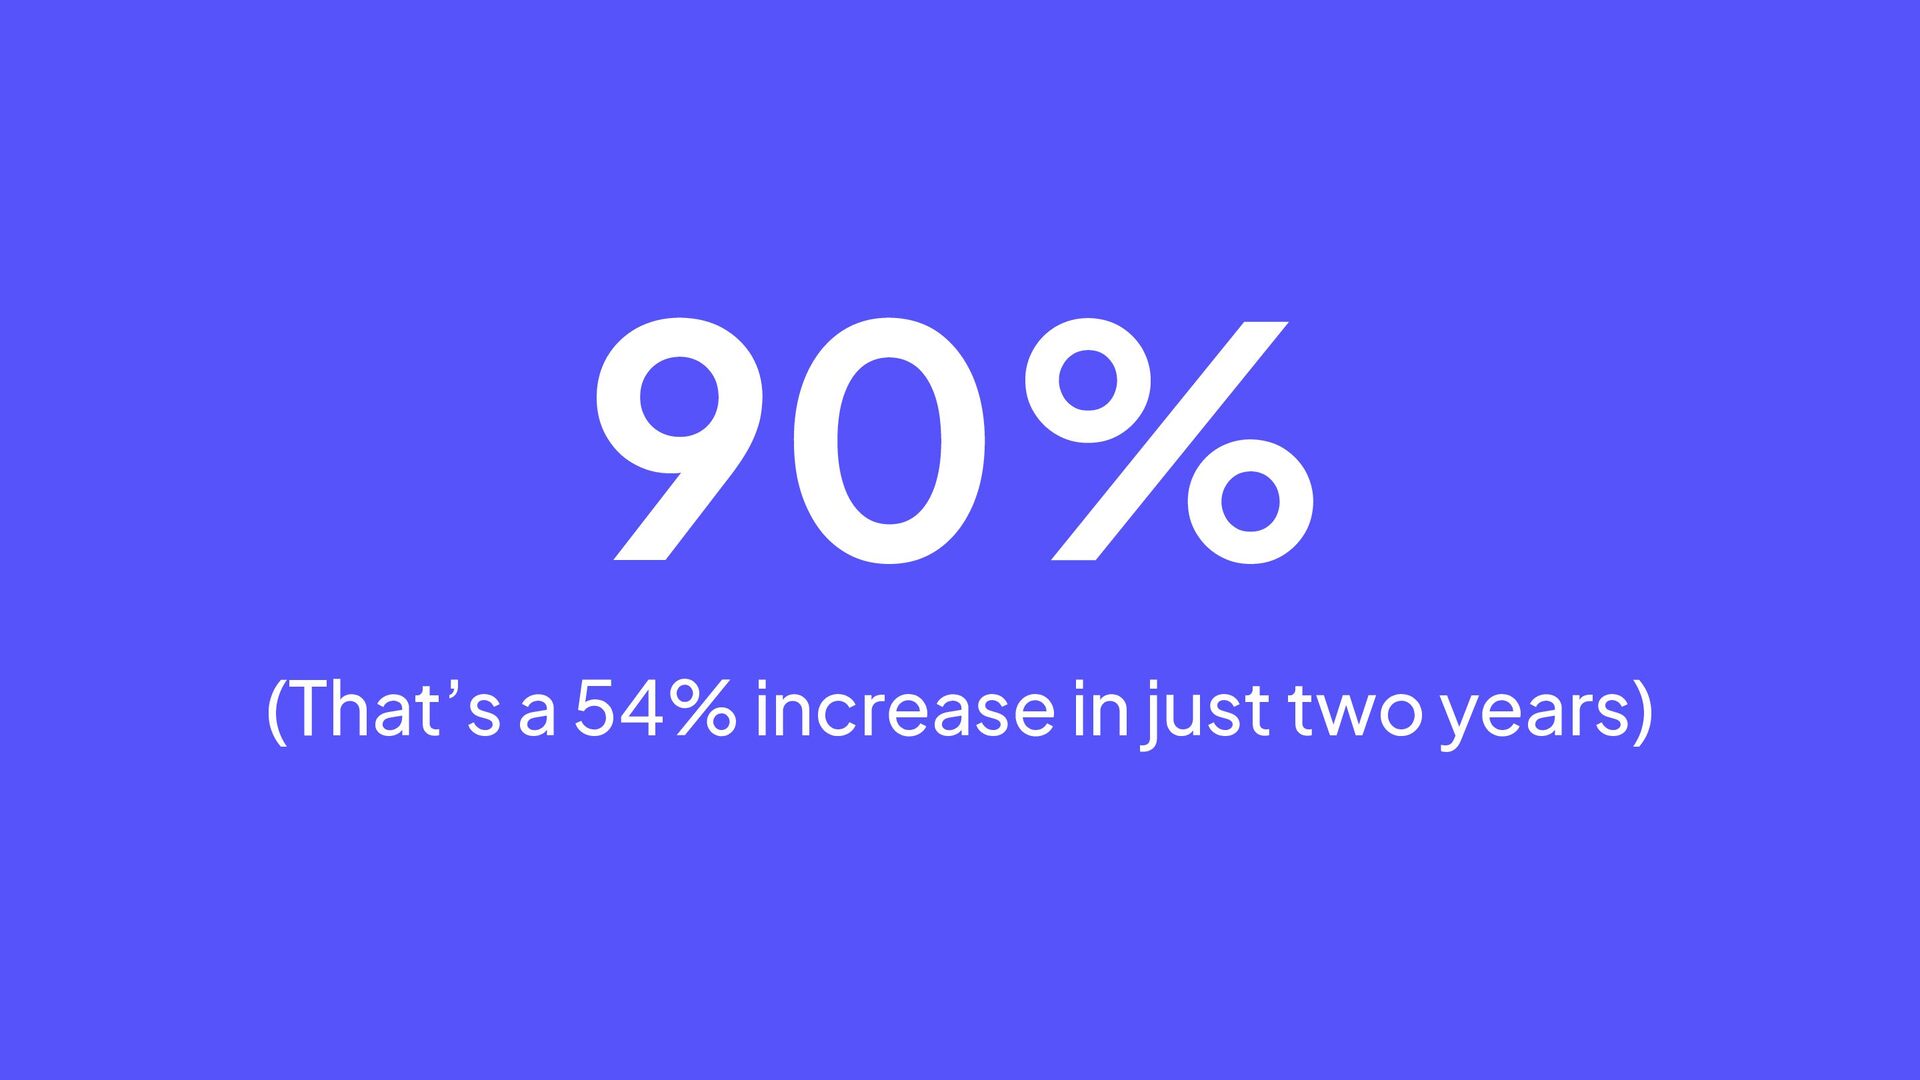
Adding accessibility to a legacy experience is never easy. At Khan Academy, however, it was essential to make our graphs accessible for algebra, geometry, and more. Join us as we share how we reimagined our graphs and explore practical steps you can apply to your own architecture.

Avatar for Cat Johnson

Cat Johnson

March 08, 2026

More Decks by Cat Johnson

Other Decks in Programming

Transcript

  1. Who we are Mark Fitzgerald, WAS Senior Software Engineer Jeanette

    Head Engineering Manager, Accessibility Architect Nisha Yerunkar Senior Software Engineer Cat Johnson, CPWA Senior Software Engineer
  2. • Procured our first ACR in 2025 • Track WCAG

    conformance as a key outcome for our products • Built up internal expertise by hiring designers and engineers with deep a11y expertise What’s been happening with accessibility at Khan Academy?
  3. Content Creators Learners Indicate all points that represent the solution

    of f(x) = 0 by placing points in those locations.
  4. • Gathered and shared data about how accessibility impacted our

    sales numbers • Connected this work to a larger project • Built excitement about our vision of a more accessible experience How did we get this prioritized?
  5. My philosophy Whether you're plotting points, drawing lines, or exploring

    quadratic curves, I make math visual, hands-on and fun. About Me • Created in 2013 • Popular in middle school math, algebra and geometry content • Supports 10 main types of graphing Fun fact I have over 2000 unique configurations Interactive Graph Profile
  6. DOM Order Last 1st Tab #1 Tab #2 Tab #3

    Controls Front Back Visual Order SVG Focus element Display element Keyboard interaction
  7. Results Decrease in skip rates 2% Increase in correct answers

    6% Increase in graph use 67% Research sessions completed 3
  8. “I can draw shapes!” “It was really easy to interact

    with it, and I could do all the same things that a mouse user could do.” — Research Participants
  9. • Sonification • Live regions for dynamic, real-time feedback •

    Improved screen reader instructions • Expanded graph types • And more! Future improvements
  10. Practice experiences with accessibility features Frequency of users accessing accessible

    practice experiences Use data to maximize impact 8% 36% 38% 90%
  11. Q&A