$30 off During Our Annual Pro Sale. View Details »

Lightweight Collection and Storage of Software Repository Data with DataRover

Lightweight Collection and Storage of Software Repository Data with DataRover

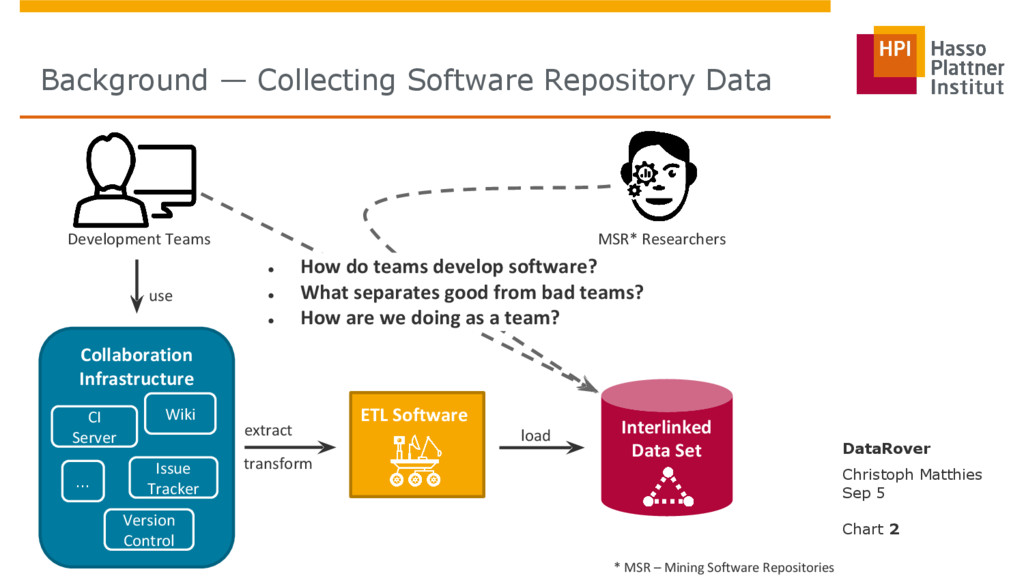
The ease of setting up collaboration infrastructures for software engineering projects creates a challenge for researchers that aim to analyze the resulting data. As teams can choose from various available software-as-a-service solutions and can configure them with a few clicks, researchers have to create and maintain multiple implementations for collecting and aggregating the collaboration data in order to perform their analyses across different setups.
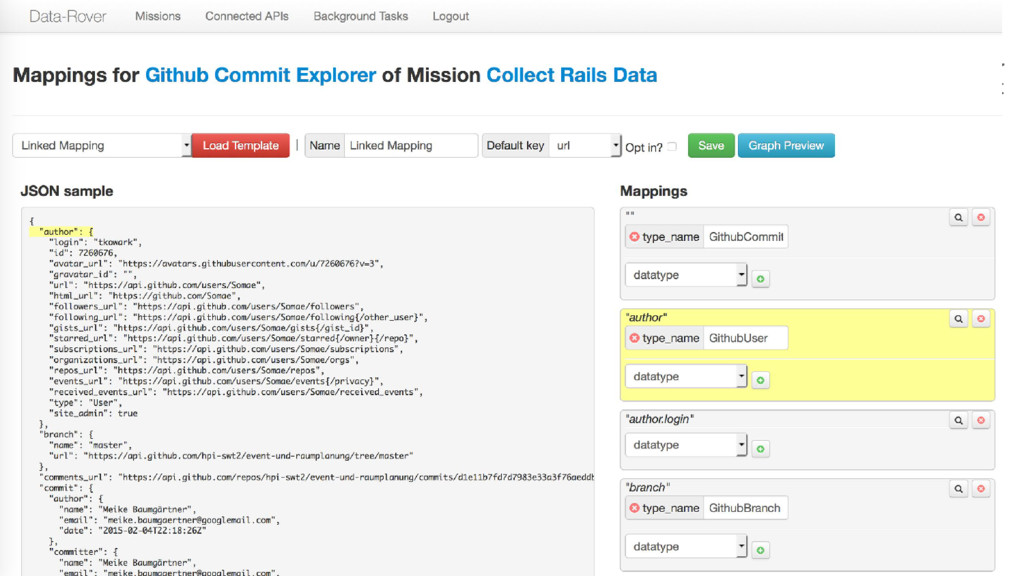
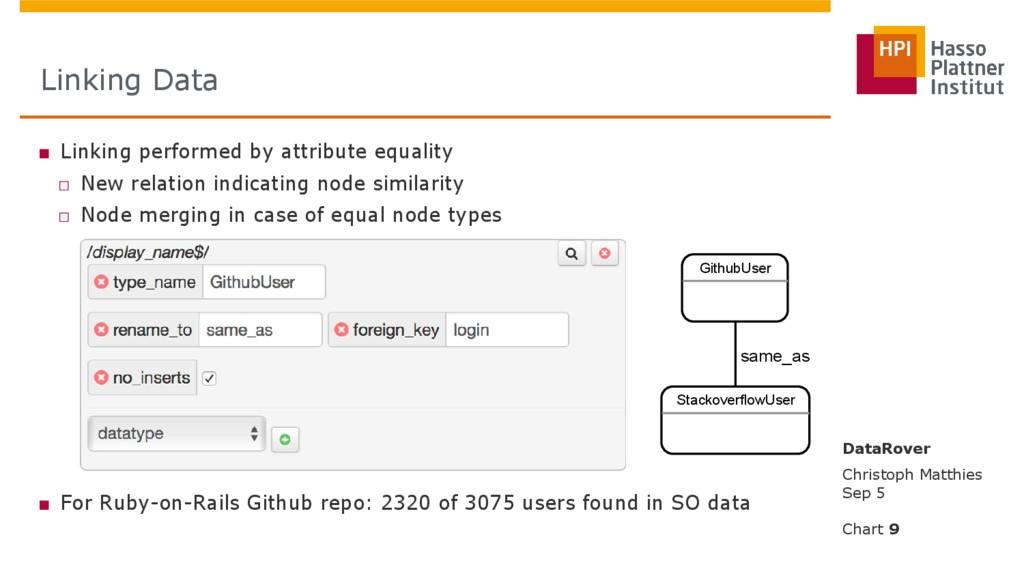
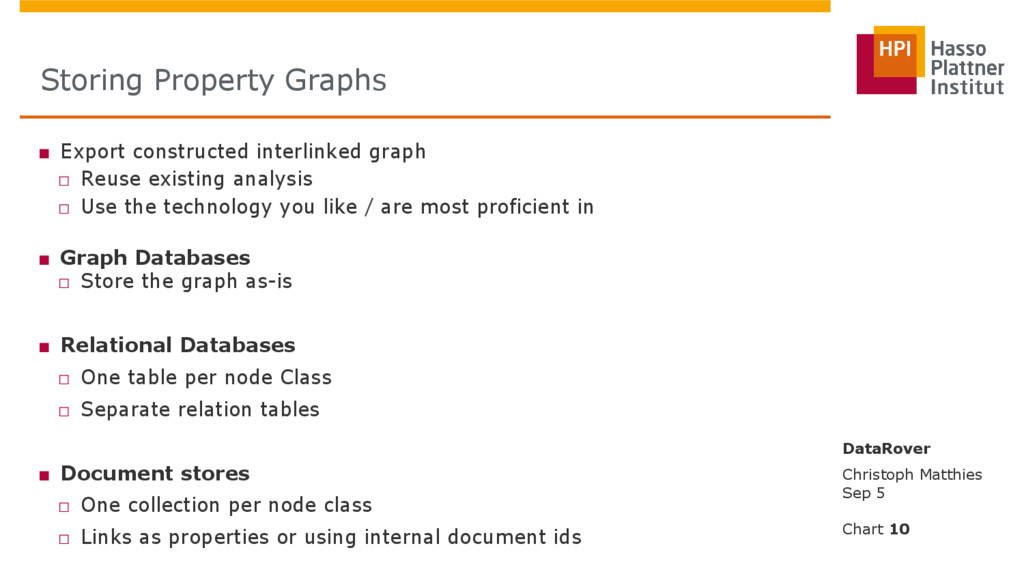
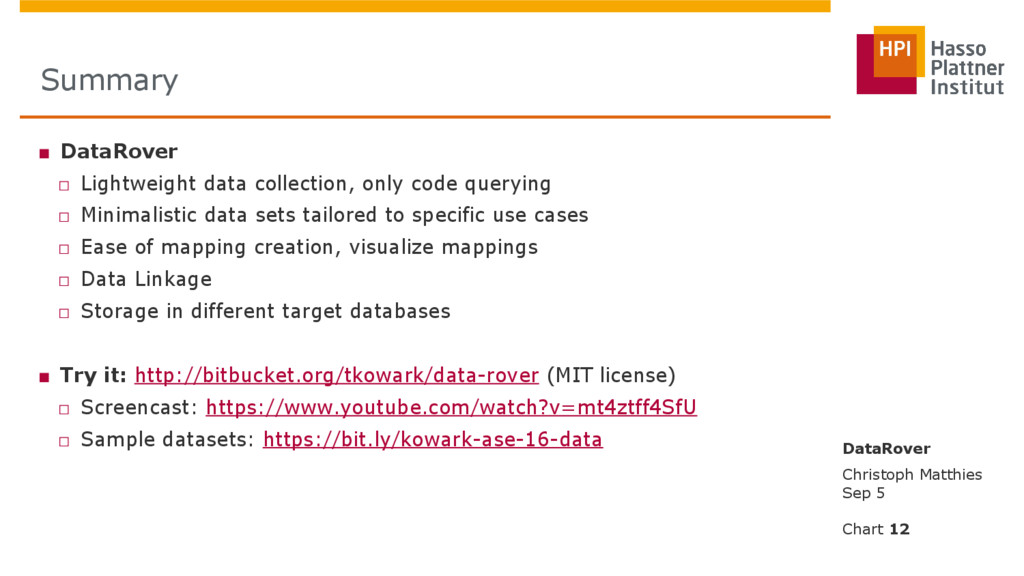
The DataRover system simplifies this task by only requiring custom source code for API authentication and querying. Data transformation and linkage is performed based on mappings, which users can define based on sample responses through a graphical front end. This allows storing the same input data in formats and databases most suitable for the intended analysis without requiring additional coding.
A screencast of DataRover is available at https://youtu.be/mt4ztff4SfU.
DataRover is available at: https://bitbucket.org/tkowark/data-rover

Christoph Matthies

September 05, 2016
Tweet

More Decks by Christoph Matthies

Other Decks in Technology

Transcript

  1. Lightweight Collection and Storage of
    Software Repository Data with DataRover
    Thomas Kowark, Christoph Matthies, Matthias Uflacker and Hasso Plattner
    HPI, Enterprise Platform and Integration Concepts Chair, Potsdam, Germany
    ASE 2016 Demo Track
    September, 5th

    View Slide

  2. Christoph Matthies
    Sep 5
    DataRover
    Background — Collecting Software Repository Data
    Chart 2
    Collaboration
    Infrastructure
    Wiki
    Version
    Control
    Issue
    Tracker
    CI
    Server

    Development Teams
    use
    MSR* Researchers
    * MSR – Mining Software Repositories
    transform
    load
    Interlinked
    Data Set
    extract
    ● How do teams develop software?
    ● What separates good from bad teams?
    ● How are we doing as a team?
    ETL Software

    View Slide

  3. ■ Plugin/service-based architectures
    □ One plugin/service per data source
    □ Custom data schema
    □ Alitheia-Core [Gousios et al., 2009], SOFAS [Ghezzi, 2012], Sonarqube
    ■ Graphical ETL-Tools
    □ Plugin for each data source connection
    □ Visual creation of ETL processes
    □ RapidMiner, KNIME
    ■ Collections of Repository Data
    □ Pre-collected, cleansed, and interlinked data sets
    □ Boa [Dyer et al., 2013] with custom query language
    □ GHTorrent [Gousios, 2013 and ongoing], StackExchange dumps
    Christoph Matthies
    Sep 5
    DataRover
    Related Work
    Chart 3

    View Slide

  4. ■ Why doesn’t this mining tool support my new/updated data source?
    □ “The development team has migrated to Gitlab”
    ■ How are the peculiarities of my project reflected in the standard data
    schema and analyses?
    □ “We use JIRA with custom fields”
    ■ Can I store this data in a graph or document database to perform
    network analyses or text mining?
    □ “Neo4J already offers the graph algorithms that I need.”
    □ “All my existing queries rely on MySQL.”
    Christoph Matthies
    Sep 5
    DataRover
    Chart 4
    Common Issues

    View Slide

  5. ■ Goals
    □ Minimal implementation effort for each data source
    □ Separate collection and linking
    □ Reuse existing implementations whenever possible
    □ Allow focus on linking and analysis, not data collection
    ■ Concepts
    □ Collection: Explorer (OAuth, Query Parameters) => JSON
    – Stackoverflow Client: ~12 LoC + logging
    □ Linking: Define generic mappings using GUI
    – Map JSON attributes to links, new nodes or node values
    □ Storage: Graph database (Neo4J)
    – No explicit database scheme, easily add connections at runtime
    Christoph Matthies
    Sep 5
    DataRover
    Chart 5
    Lightweight Data Collection — DataRover

    View Slide

  6. Christoph Matthies
    Sep 5
    DataRover
    Chart 6
    Data Collection — Explorers
    https://bitbucket.org/tkowark/data-rover/src/b37e79847a7b08a604688133834a0592b9320b57/app/models/explorers/stackoverflow_explorer.rb

    View Slide

  7. Christoph Matthies
    Sep 5
    DataRover
    Chart 7

    View Slide

  8. ■ Mappings: define transformations of JSON to property graph
    Christoph Matthies
    Sep 5
    DataRover
    Chart 8
    From JSON to Property Graphs

    View Slide

  9. Christoph Matthies
    Sep 5
    DataRover
    Chart 9
    Linking Data
    ■ Linking performed by attribute equality
    □ New relation indicating node similarity
    □ Node merging in case of equal node types
    ■ For Ruby-on-Rails Github repo: 2320 of 3075 users found in SO data
    StackoverflowUser
    GithubUser
    same_as

    View Slide

  10. ■ Export constructed interlinked graph
    □ Reuse existing analysis
    □ Use the technology you like / are most proficient in
    ■ Graph Databases
    □ Store the graph as-is
    ■ Relational Databases
    □ One table per node Class
    □ Separate relation tables
    ■ Document stores
    □ One collection per node class
    □ Links as properties or using internal document ids
    Christoph Matthies
    Sep 5
    DataRover
    Chart 10
    Storing Property Graphs

    View Slide

  11. ■ Only storing what you really need
    □ Rails commit data w/o file changes (58k commits, 3k users)
    □ Example query: amount of commits performed by each user
    ■ Future Work
    □ User study (Mapping creation time, error-proneness, clarity, etc.)
    □ Measuring data import times for large datasets Christoph Matthies
    Sep 5
    DataRover
    Chart 11
    Evaluation (ongoing)

    View Slide

  12. ■ DataRover
    □ Lightweight data collection, only code querying
    □ Minimalistic data sets tailored to specific use cases
    □ Ease of mapping creation, visualize mappings
    □ Data Linkage
    □ Storage in different target databases
    ■ Try it: http://bitbucket.org/tkowark/data-rover (MIT license)
    □ Screencast: https://www.youtube.com/watch?v=mt4ztff4SfU
    □ Sample datasets: https://bit.ly/kowark-ase-16-data
    Christoph Matthies
    Sep 5
    DataRover
    Chart 12
    Summary

    View Slide

  13. ■ web developer by Hugo Alberto from the Noun Project
    ■ Communication by Role Play from the Noun Project
    ■ Browser by icon 54 from the Noun Project
    ■ Mars Rover by LA Hall from the Noun Project
    ■ discussion by Milka Dahan from the Noun Project
    Picture Sources

    View Slide