Upgrade to Pro — share decks privately, control downloads, hide ads and more …

Optimizing your app by understanding your Postgres | RailsConf 2019 | Samay Sharma

Optimizing your app by understanding your Postgres | RailsConf 2019 | Samay Sharma

I’m a Postgres person. Period. After talking to many Rails developers about their application performance, I realized many performance issues can be solved by understanding your database a bit better. So I thought I’d share the statistics Postgres captures for you and how you can use them to find slow queries, un-used indexes, or tables which are not getting vacuumed correctly. This talk will cover Postgres tools and tips for the above, including pgstatstatements, useful catalog tables, and recently added Postgres features such as CREATE STATISTICS.

Citus Data

April 30, 2019
Tweet

More Decks by Citus Data

Other Decks in Technology

Transcript

  1. Samay Sharma | RailsConf 2019
    Optimizing your app by understanding
    your Postgres database
    Samay Sharma
    Solutions Engineering Manager
    RailsConf 2019 | Minneapolis | April 2019

    View Slide

  2. Samay Sharma | RailsConf 2019
    2
    • Citus - Open Source Extension to
    Scale out Postgres
    • Manage a team of Solutions
    Engineers
    • Work with clients
    • Fun(?) fact : Recently got married J

    View Slide

  3. Samay Sharma | RailsConf 2019

    View Slide

  4. Samay Sharma | RailsConf 2019
    Challenge: Relating issues to the database
    • Problems you’re facing from an application perspective
    • Tied to database
    • How do I find the root cause?
    • How do I solve it?
    4

    View Slide

  5. Samay Sharma | RailsConf 2019
    Solution: Using Postgres’ statistics
    • Postgres captures, uses and exposes many statistics.
    • Monitoring statistics – Statistics about system activity
    • Query planner statistics – Statistics used by the planner to choose the right query plan.
    • Server Administrator statistics – Statistics about replication, size of database, tables, etc.
    • It’s important to know how to use them.
    5

    View Slide

  6. Samay Sharma | RailsConf 2019
    Problem: My application is slow
    • Symptoms: Application users are seeing slow query performance.
    • Your monitoring tool shows you that most of the time is going in database
    calls.
    • Your page is making 100s of database calls, you don’t know which query
    is slow.
    6

    View Slide

  7. Samay Sharma | RailsConf 2019
    Cache hit ratio
    • Gives an idea of how much of your data is coming from the PostgreSQL
    buffercache.
    • For transactional apps, want to keep if >95%, ideally around 99%.
    7

    View Slide

  8. Samay Sharma | RailsConf 2019
    How do I measure?
    SELECT
    sum(heap_blks_read) as heap_read,
    sum(heap_blks_hit) as heap_hit,
    sum(heap_blks_hit) / (sum(heap_blks_hit) + sum(heap_blks_read)) as ratio
    FROM
    pg_statio_user_tables;
    8

    View Slide

  9. Samay Sharma | RailsConf 2019
    pg_statio_user_tables
    select * from pg_statio_user_tables where relname = 'tbl';
    -[ RECORD 1 ]---+---------
    relid | 19049
    schemaname | public
    relname | tbl
    heap_blks_read | 44260
    heap_blks_hit | 10162819
    idx_blks_read | 31
    idx_blks_hit | 30
    toast_blks_read |
    toast_blks_hit |
    tidx_blks_read |
    tidx_blks_hit |
    9

    View Slide

  10. Samay Sharma | RailsConf 2019
    Digging further
    • If cache hit ratio is low, that could mean a lot of things.
    • Maybe you have a lot of bloat.
    • Maybe autovacuum is not tuned well enough.
    • Maybe your queries are not optimized and you are doing a lot of sequential scans.
    • Maybe you have a lot of unused indexes.
    • Or, you actually have less resources and you need to scale out with Citus.
    10

    View Slide

  11. Samay Sharma | RailsConf 2019
    Pg_stat_database
    select * from pg_stat_database where datname = 'citus';
    -[ RECORD 1 ]--+------------------------------
    datid | 16385
    datname | citus
    numbackends | 3
    xact_commit | 1023786
    xact_rollback | 8
    blks_read | 45324
    blks_hit | 705650570
    tup_returned | 675865817
    tup_fetched | 367682017
    tup_inserted | 10009861
    tup_updated | 1738
    tup_deleted | 600
    conflicts | 0
    temp_files | 4
    temp_bytes | 340491008
    deadlocks | 0
    blk_read_time | 59.44
    blk_write_time | 0
    stats_reset | 2019-01-03 23:07:28.206208+00
    11

    View Slide

  12. Samay Sharma | RailsConf 2019
    Uses for pg_stat_database
    • Find out rows fetched vs returned by queries to the database
    • Find out the insert / update / delete ratio for your database
    • Total number of transactions executed / throughput
    12

    View Slide

  13. Samay Sharma | RailsConf 2019
    pg_stat_user_tables
    select * from pg_stat_user_tables where relname = 'tbl';
    -[ RECORD 1 ]-------+------------------------------
    relid | 19049
    schemaname | public
    relname | tbl
    seq_scan | 3
    seq_tup_read | 10000000
    idx_scan | 2
    idx_tup_fetch | 20000
    n_tup_ins | 10000000
    n_tup_upd | 0
    n_tup_del | 0
    n_tup_hot_upd | 0
    n_live_tup | 9999977
    n_dead_tup | 0
    n_mod_since_analyze | 0
    last_vacuum |
    last_autovacuum |
    last_analyze |
    last_autoanalyze | 2019-04-28 22:28:42.068611+00
    vacuum_count | 0
    autovacuum_count | 0
    analyze_count | 0
    autoanalyze_count | 1
    13

    View Slide

  14. Samay Sharma | RailsConf 2019
    Uses for pg_stat_user_tables
    • Approximate number of live / dead tuples (rows) in a table
    • Find out if the table is an insert / update / delete heavy table.
    • Find out if your table is being auto vacuumed sufficiently or not.
    • Find out if most scans on the table are sequential scans or index scans.
    14

    View Slide

  15. Samay Sharma | RailsConf 2019
    pg_stat_user_indexes
    select * from pg_stat_user_indexes where relname = 'tbl';
    -[ RECORD 1 ]-+-------
    relid | 19049
    indexrelid | 19052
    schemaname | public
    relname | tbl
    indexrelname | i1
    idx_scan | 4
    idx_tup_read | 40000
    idx_tup_fetch | 40000
    15

    View Slide

  16. Samay Sharma | RailsConf 2019
    Uses for pg_stat_user_indexes
    • Figuring out unused indexes
    • Ratio of index rows read vs fetched
    16

    View Slide

  17. Samay Sharma | RailsConf 2019
    Back to cache hit rate
    • Understand why you had a bad hit rate
    • You see database patterns which don’t align with the application – Dive deeper into them
    • Is there a lot of bloat, are some tables not vacuumed often enough – Tune autovacuum
    • Are you doing a lot of sequential scans - Create indexes
    • Maybe you have a lot of unnecessary indexes – Delete them
    17

    View Slide

  18. Samay Sharma | RailsConf 2019
    Generic vs specific optimizations
    • Follow above practices to make generic optimizations when your
    database is slow.
    • How do you speed up a particular webpage?
    • Or how do you find out what specific queries are slow?
    18

    View Slide

  19. Samay Sharma | RailsConf 2019
    How do I find what queries are slow?
    19

    View Slide

  20. Samay Sharma | RailsConf 2019
    What is `pg_stat_statements` ?
    • PostgreSQL extension which tracks execution statistics of all SQL
    statements executed by a server
    • Normalized so similar queries grouped together
    • Exposed to user w/ view named `pg_stat_statements`
    20

    View Slide

  21. Samay Sharma | RailsConf 2019
    `pg_stat_statements` view
    • Query: User_id, db_id, query_id, query text, # of times executed
    • Timing: min_time, max_time, total_time, mean_time, stddev_time
    • Shared blocks hit, read, written, dirtied
    • Local blocks hit, read, written, dirtied
    • I/O times: total time spent in reading & writing blocks.
    • Enable track_io_timing to get these, otherwise will be empty
    21

    View Slide

  22. Samay Sharma | RailsConf 2019
    Examples
    • Top 10 time consuming queries
    select query, total_time from pg_stat_statements ORDER BY total_time DESC limit 10
    • Top 10 queries spending most time on disk reads
    select query, blk_read_time from pg_stat_statements ORDER BY blk_read_time DESC limit 10
    • Top 10 most common queries
    select query, calls from pg_stat_statements ORDER BY calls DESC limit 10
    22

    View Slide

  23. Samay Sharma | RailsConf 2019
    SELECT rolname,
    calls,
    total_time,
    mean_time,
    max_time,
    stddev_time,
    rows,
    regexp_replace(query, '[ \t\n]+', ' ', 'g') AS query_text
    FROM pg_stat_statements
    JOIN pg_roles r ON r.oid = userid
    WHERE calls > 100
    AND rolname NOT LIKE '%backup'
    ORDER BY mean_time DESC
    LIMIT 15;
    -[ RECORD 1] ----------------------------------------------------------------------------------------------------
    - ---------------------------------------------------------------------------------------------------------------
    ---
    rolname | citus
    calls | 141
    total_time | 121404.290523
    mean_time | 861.023337042553
    max_time | 3718.828292
    stddev_time | 913.641891936023
    rows | 846
    query_text | SELECT ads.campaign_id, COUNT(*) FROM ads JOIN impressions i ON (ads.id = ad_id AND ads.company_id
    = i.company_id) WHERE ads.campaign_id IN ($1,$2,$3,$4,$5,$6,$7,$8,$9,$10,$11,$12,$13,$14) AND ads.company_id =
    $15 AND seen_at > now()::date GROUP BY ads.campaign_id
    Source: http://geekmonkey.org/2017/11/optimizing-postgresql-queries-using-pg_stat_statements-and-pg_buffercache/

    View Slide

  24. Samay Sharma | RailsConf 2019
    EXPLAIN ANALYZE and tune them!
    EXPLAIN ANALYZE SELECT * FROM tbl where col1 = 1;
    QUERY PLAN
    -----------------------------------------------------------------------------------------------------------
    Seq Scan on tbl (cost=0.00..169247.80 rows=9584 width=8) (actual time=0.641..622.851 rows=10000 loops=1)
    Filter: (col1 = 1)
    Rows Removed by Filter: 9990000
    Planning time: 0.051 ms
    Execution time: 623.185 ms
    (5 rows)
    24

    View Slide

  25. Samay Sharma | RailsConf 2019
    Interesting things about EXPLAIN
    EXPLAIN ANALYZE SELECT * FROM tbl where col1 = 1 and col2 = 0;
    QUERY PLAN
    ----------------------------------------------------------------------------------------------------------
    Seq Scan on tbl (cost=0.00..194248.69 rows=100 width=8) (actual time=0.640..630.130 rows=10000 loops=1)
    Filter: ((col1 = 1) AND (col2 = 0))
    Rows Removed by Filter: 9990000
    Planning time: 0.072 ms
    Execution time: 630.467 ms
    (5 rows)
    25

    View Slide

  26. Samay Sharma | RailsConf 2019
    Estimates vs actual
    • Postgres tells you what it thinks even in the EXPLAIN plans.
    • Sometimes reason for slow queries might just be that Postgres has
    incorrect statistics. Notice and fix those mismatches.
    • Try to ANALYZE with larger default_statistics_target.
    26

    View Slide

  27. Samay Sharma | RailsConf 2019
    Multi-column statistics
    • Postgres only captures only single column statistics.
    • Sometimes, those are not enough because they can’t cover correlations.
    • But, you can tell PG two columns are related.
    27

    View Slide

  28. Samay Sharma | RailsConf 2019
    CREATE STATISTICS
    CREATE STATISTICS s1 (dependencies) on col1, col2 from tbl;
    ANALYZE tbl;
    EXPLAIN ANALYZE SELECT * FROM tbl where col1 = 1 and col2 = 0;
    QUERY PLAN
    -----------------------------------------------------------------------------------------------------------
    Seq Scan on tbl (cost=0.00..194247.76 rows=9584 width=8) (actual time=0.638..629.741 rows=10000 loops=1)
    Filter: ((col1 = 1) AND (col2 = 0))
    Rows Removed by Filter: 9990000
    Planning time: 0.115 ms
    Execution time: 630.076 ms
    (5 rows)
    28

    View Slide

  29. Samay Sharma | RailsConf 2019
    Example of impact
    29

    View Slide

  30. Samay Sharma | RailsConf 2019
    Summary of specific query optimization
    • Find the right queries to optimize using pg_stat_statements
    • Use EXPLAIN ANALYZE and tune the slowest parts
    • Look at differences between estimated and actual and find ways to fix
    them.
    30

    View Slide

  31. Samay Sharma | RailsConf 2019
    Bonus: Quick Estimates
    31

    View Slide

  32. Samay Sharma | RailsConf 2019
    pg_stats
    select * from pg_stats 
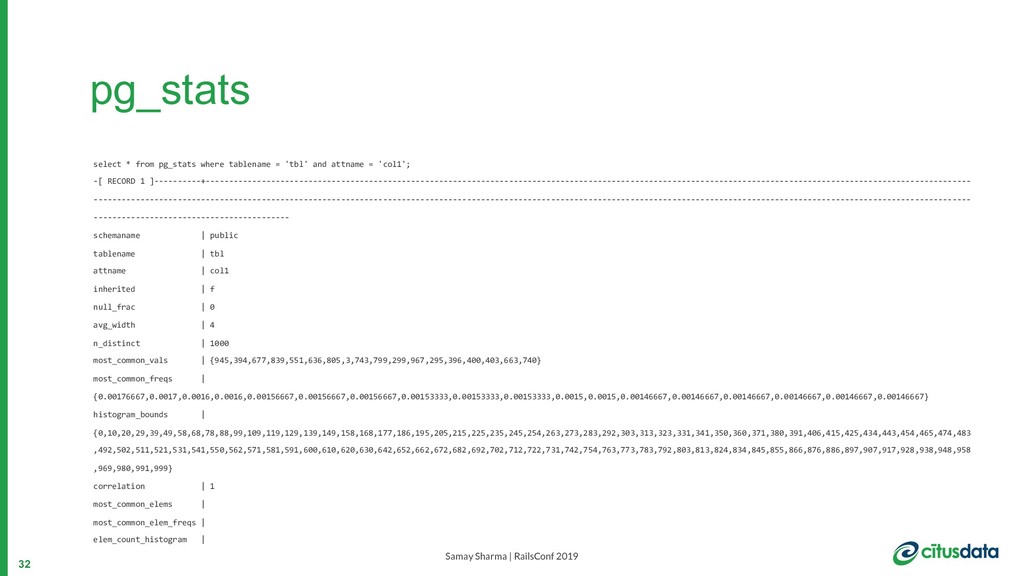
where tablename = 'tbl' and attname = 'col1';
    -[ RECORD 1 ]----------+--------------------------------------------------------------------------------------------------------------------------------------------------------------------
    --------------------------------------------------------------------------------------------------------------------------------------------------------------------------------------------
    ------------------------------------------
    schemaname | public
    tablename | tbl
    attname | col1
    inherited | f
    null_frac | 0
    avg_width | 4
    n_distinct | 1000
    most_common_vals | {945,394,677,839,551,636,805,3,743,799,299,967,295,396,400,403,663,740}
    most_common_freqs |
    {0.00176667,0.0017,0.0016,0.0016,0.00156667,0.00156667,0.00156667,0.00153333,0.00153333,0.00153333,0.0015,0.0015,0.00146667,0.00146667,0.00146667,0.00146667,0.00146667,0.00146667}
    histogram_bounds |
    {0,10,20,29,39,49,58,68,78,88,99,109,119,129,139,149,158,168,177,186,195,205,215,225,235,245,254,263,273,283,292,303,313,323,331,341,350,360,371,380,391,406,415,425,434,443,454,465,474,483
    ,492,502,511,521,531,541,550,562,571,581,591,600,610,620,630,642,652,662,672,682,692,702,712,722,731,742,754,763,773,783,792,803,813,824,834,845,855,866,876,886,897,907,917,928,938,948,958
    ,969,980,991,999}
    correlation | 1
    most_common_elems |
    most_common_elem_freqs |
    elem_count_histogram |
    32

    View Slide

  33. Samay Sharma | RailsConf 2019
    Uses for pg_stats
    • What is the null ratio for a particular column?
    • Find the approximate number of distinct values for a column.
    • What are the most common values for a column and what are the
    approximate number of rows with those values?
    33

    View Slide

  34. Samay Sharma | RailsConf 2019
    Approximate count
    • Do you know how to get a very fast approximate count of rows in a table?
    SELECT
    relname, reltuples
    FROM
    pg_class
    WHERE
    relname = 'tbl’;
    relname | reltuples
    ---------+-----------
    tbl | 1e+07
    (1 row)
    34

    View Slide

  35. Samay Sharma | RailsConf 2019
    Summary
    • Postgres exposes a lot of stats to you. In this talk, we covered mainly
    performance.
    • Pg_stat_* tables to find index, table, IO, vacuum statistics.
    • Enable pg_stat_statements to find out your slow queries.
    35

    View Slide

  36. Samay Sharma | RailsConf 2019
    Summary
    • Use EXPLAIN ANALYZE or EXPLAIN (ANALYZE, BUFFERS) to see what
    the planner is actually doing.
    • Use pg_stats and pg_class to get good approximations and understand
    postgres’ understanding of your data.
    36

    View Slide

  37. Samay Sharma | RailsConf 2019
    Samay Sharma | RailsConf 2019
    aka.ms/citus-azure.int

    View Slide

  38. Samay Sharma | RailsConf 2019
    Questions?
    @citusdata
    @samay_sharma
    github.com/citusdata/citus
    @microsoft

    View Slide

  39. Samay Sharma | RailsConf 2019
    Useful readings – Based on talk feedback
    • Measuring Bloat (and more) : https://www.citusdata.com/blog/2017/10/20/monitoring-your-bloat-in-postgres/
    • Queries for unused indexes and cache hit ratio : https://www.citusdata.com/blog/2017/09/29/what-performance-
    can-you-expect-from-postgres/
    • Tuning Autovacuum : https://www.citusdata.com/blog/2016/11/04/autovacuum-not-the-enemy/
    • Multi-column statistics : https://www.citusdata.com/blog/2018/03/06/postgres-planner-and-its-usage-of-
    statistics/
    39

    View Slide