rights reserved. Instrumenting Kubernetes for Observability Using AWS X-Ray and Amazon CloudWatch Christoph Kassen Senior Solutions Architect D E V 3 0 3
rights reserved. What to expect? Modern applications Building modern applications Deploying to Amazon Elastic Container Service for Kubernetes (Amazon EKS) Monitoring Amazon CloudWatch Distributed tracing Hands-on labs
rights reserved. Benefits of modern applications Improves fault isolation Enables continuous delivery and deployment Each component is autonomous and independent
rights reserved. Challenges with microservices Complexity of deploying a distributed system Service discovery Build and deployment automation Application configuration Monitoring and operations Security Evolvability of the system
rights reserved. Introducing Amazon EKS Managed Kubernetes Control Plane Highly Available Master and etcd Bring-your-own worker nodes (like Amazon Elastic Container Service [Amazon ECS]) Core Tenets Platform for enterprises to run production-grade workloads Provides a native and upstream experience – Certified Not forced to use additional AWS services, but offer seamless integration Actively contribute to upstream project
rights reserved. Remaining challenges Monitoring Varying log formats across services Collecting, aggregating, and collating logs from services Metrics and alarms Distributed systems Cross-service interactions Cascading errors Request flow End-user impact
rights reserved. Amazon Web Services (AWS) observability portfolio Complete visibility of cloud resources and applications • Monitor applications • Respond to performance changes • Optimize resource utilization • Get a unified view of operational health Analyze and debug production, distributed applications • Identify performance bottlenecks • Troubleshoot root cause • Trace user requests • For simple & complex applications
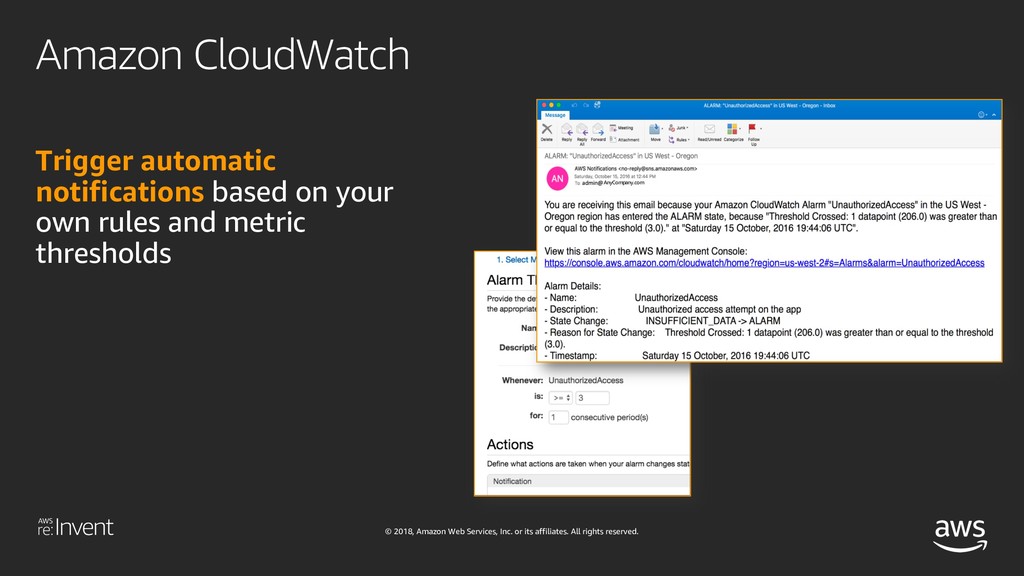
rights reserved. Amazon CloudWatch Use AWS generated metrics, logs, and events over time to understand the behavior of your system Publish custom metrics, logs, and events for your application specific telemetry
rights reserved. Automatically correct issues using common actions that you control Define your own custom actions based on AWS Lambda functions for more fine-grained control Amazon CloudWatch
rights reserved. Tracing connects the dots Get insights into individual operations Discover multiple services See issues isolated within a service Perform root cause analysis for specific issue
rights reserved. X-Ray concepts Trace End-to-end data related a single request across services Segments Portions of the trace that correspond to a single service Sub-segments Remote call or local compute sections within a service Annotations Business data that can be used to filter traces Metadata Business data that can be added to the trace but not used for filtering traces Errors Normalized error message and stack trace Sampling Percentage of requests to your application to capture as traces
rights reserved. X-Ray SDK Enables you to get started quickly without having to manually instrument your application code to log metadata about requests Source on GitHub at https://www.github.com/aws/ Available for Java, .NET, Python, Go, Ruby, and Node.js Adds filters to automatically capture metadata for calls to: AWS services using the AWS SDK Non-AWS services over HTTP and HTTPS Databases (MySQL, PostgreSQL, and Amazon DynamoDB) Queues (Amazon SQS)
rights reserved. X-Ray daemon Receives data from the SDK over UDP and acts as a local buffer; data is flushed to the backend every second or when the local buffer fills Available for Amazon Linux AMI, RHEL, Ubuntu, OS X, and Windows Pre-installed on AWS Lambda Can be run anywhere as long as AWS credentials are provided (for example, Amazon Elastic Compute Cloud [Amazon EC2], Amazon ECS, on- premises, developer machine, and others)
rights reserved. App & X-Ray SDK Pod X-Ray daemon UDP X-Ray API HTTPS HTTPS X-Ray console App & X-Ray SDK X-Ray daemon UDP DevOps Team HTTPS X-Ray workflow Pod Pod Pod
rights reserved. X-Ray API X-Ray provides a set of APIs to enable you to send, filter, and retrieve trace data You can send trace data directly to the service without having to use our SDKs (that is, you can write your own SDKs for languages not currently supported) Raw trace data is available using batch get APIs You can build your own data analysis applications on top of the data collected by X-Ray
rights reserved. X-Ray API PutTraceSegments Uploads segment documents to AWS X-Ray BatchGetTraces Retrieves a list of traces specified by ID GetServiceGraph Retrieves a document that describes services in your application and their connections GetTraceSummaries Retrieves IDs and metadata for traces available for a specified time frame using an optional filter
rights reserved. X-Ray pricing Free tier The first 100,000 traces recorded are free The first 1,000,000 traces retrieved or scanned are free https://aws.amazon.com/free/ Additional charges Beyond the free tier, traces recorded cost $5.00 per million traces Beyond the free tier, traces retrieved or scanned cost $0.50 per million traces
rights reserved. Key takeaways Serverless and containers are building blocks of modern applications AWS X-Ray is powerful tool to visualize and troubleshoot issues Take a user-centric approach to monitor modern applications Leverage X-Ray to debug and quantify customer impact X-Ray works with Amazon EKS and any other Kubernetes cluster and supports multiple languages and use cases
rights reserved. What are we going to deploy? Tooling: AWS Command Line Interface (AWS CLI), kubectl, aws-iam- authenticator EKS cluster Sample application “AnyCompany Shop“ Microservices architecture Node.JS + Express web frontend Python + Flask based microservices Amazon DynamoDB, Amazon SQS GitHub Repo https://github.com/aws-samples/reinvent2018-dev303-code See README.md for detailed instructions
rights reserved. What are we going to deploy? Distributed tracing X-Ray daemon Deployed to every EKS node Enable our applications to send traces to AWS X-Ray Incoming requests Calls to supported AWS services Outgoing HTTP requests
rights reserved. Deploying X-Ray to Amazon EKS X-Ray daemon Recieves traces from applications Forwards traces to AWS X-Ray service Listening on Port 2000 (TCP and UDP) Should be present on every node Deploy as DaemonSet Configure listening address Configure IAM policies AWSXRayDaemonWriteAccess Configure Pod (or Node)
rights reserved. Instrumenting appliation code Add the X-Ray SDKs as dependency Configure the SDK Get IP address of X-Ray daemon via environment variable Set up plugins to get Amazon EC2 and container information Add tracing middleware Allows tracing incoming requests Middlewares for Express, Flask, ... Add tracing to AWS SDKs Patch libraries to trace outgoing requests
rights reserved. Adding business data (Node.js) //Example showing how to add business data to traces app.use(function(req, res, next){ if (req.session !== undefined) { let segment = AWSXRay.getSegment() // User sessionID as userID segment.addAnnotation(‘userID', req.sessionID); } next(); })
rights reserved. Adding tracing to “AnyCompany Shop” Try to add the instrumentation to the code yourself If you need a little help: Check out the xray branch in the GitHub repository Pre-built containers are also available Just replace the latest tag with xray to update the image