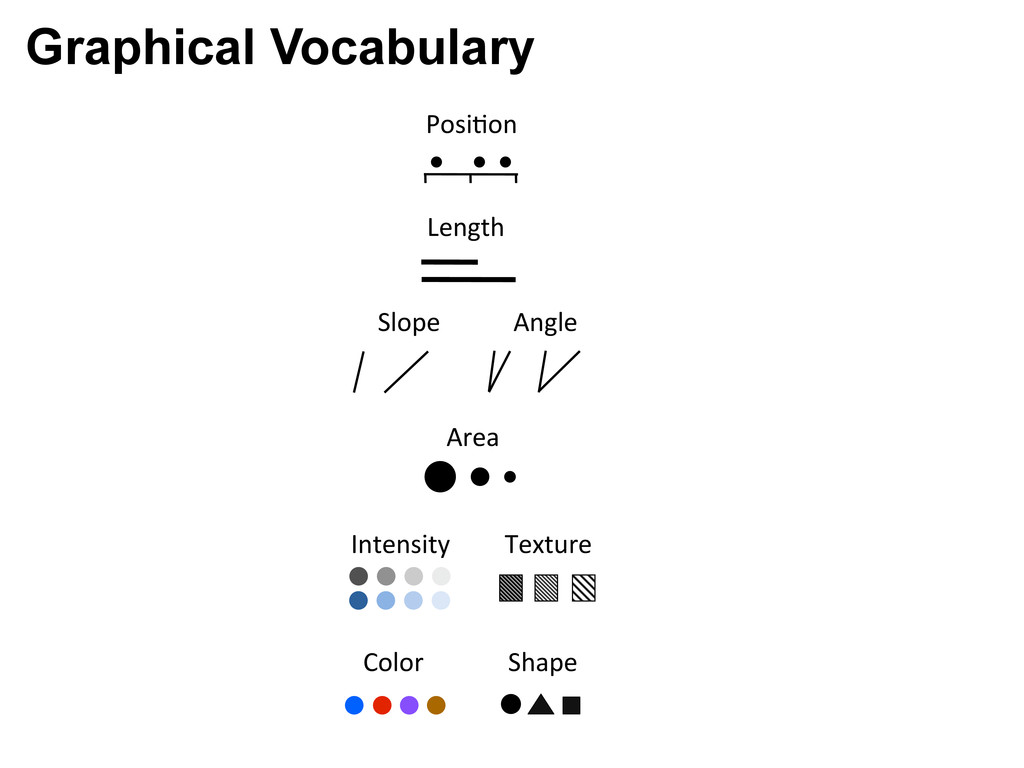
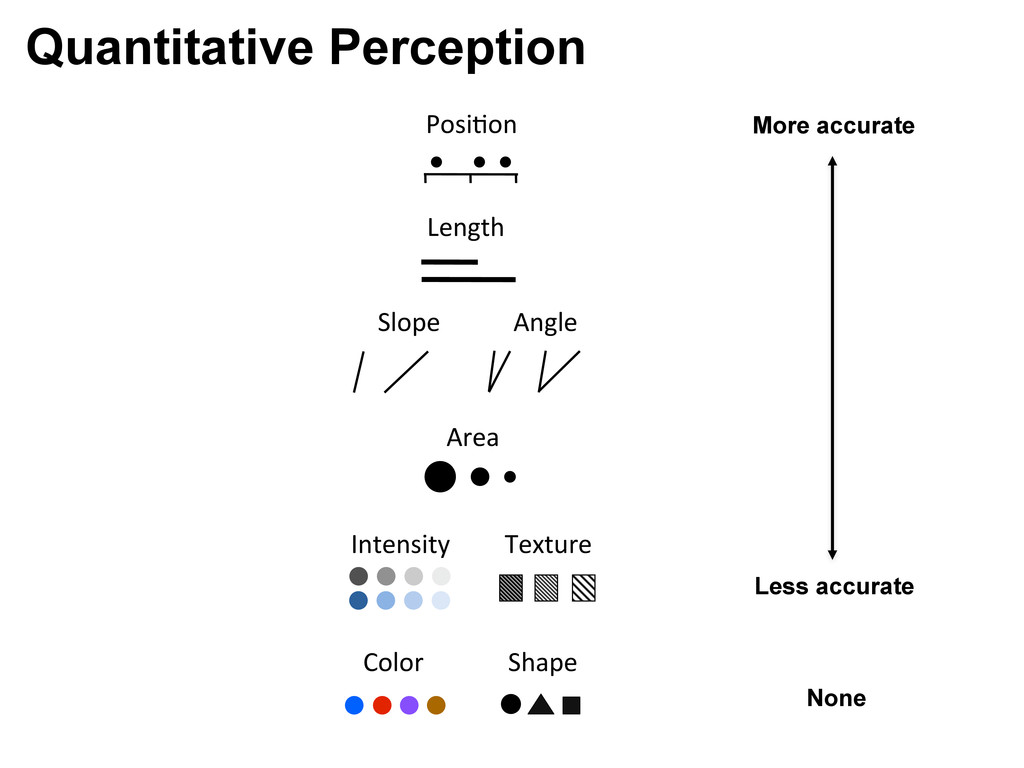
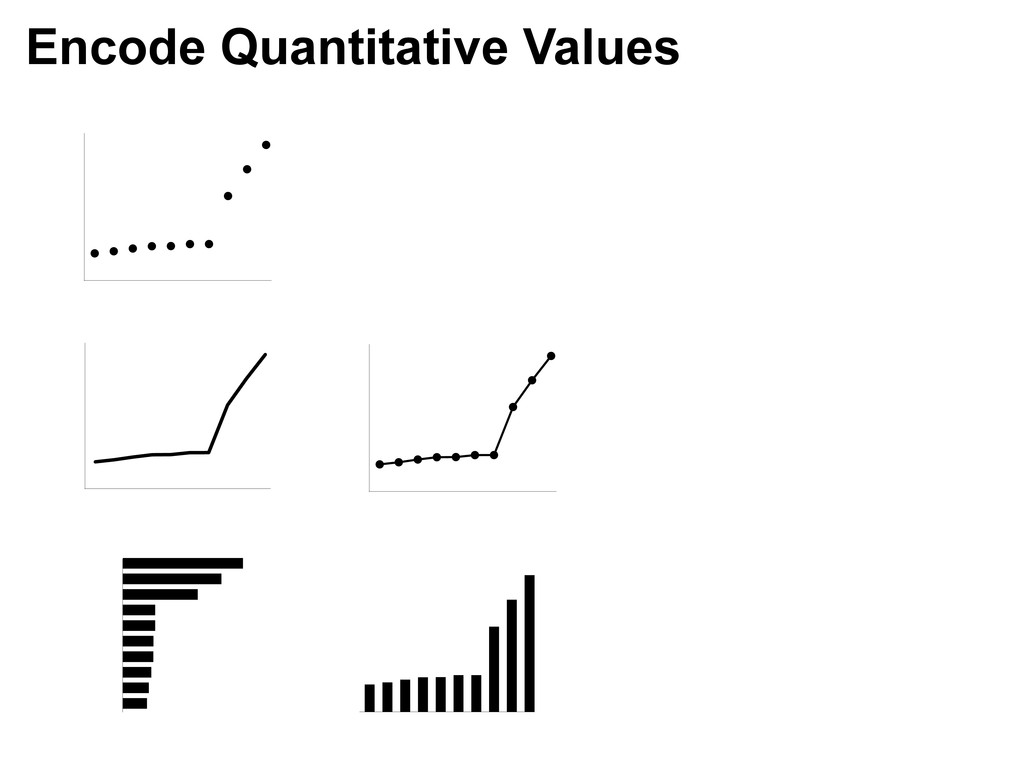
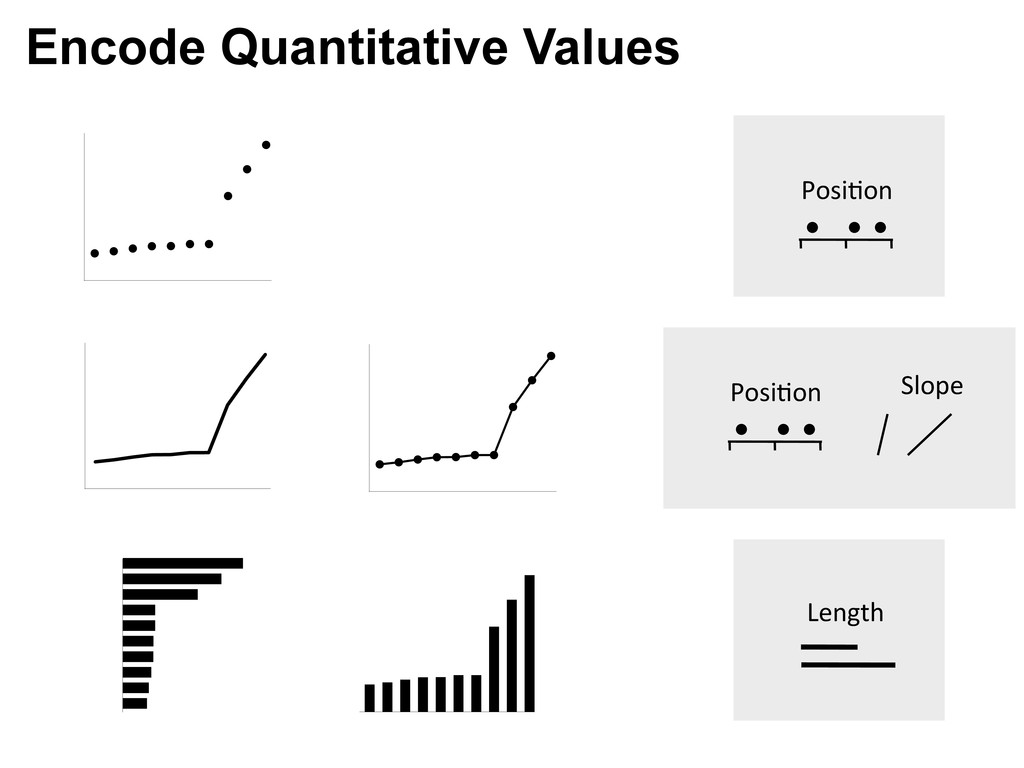
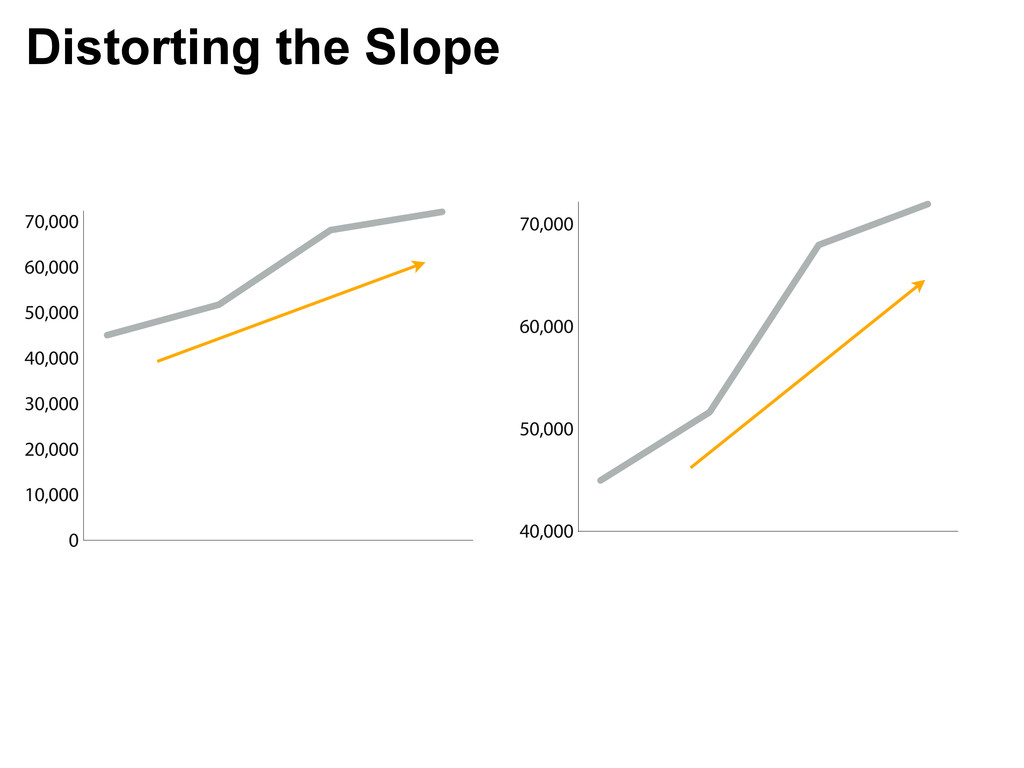
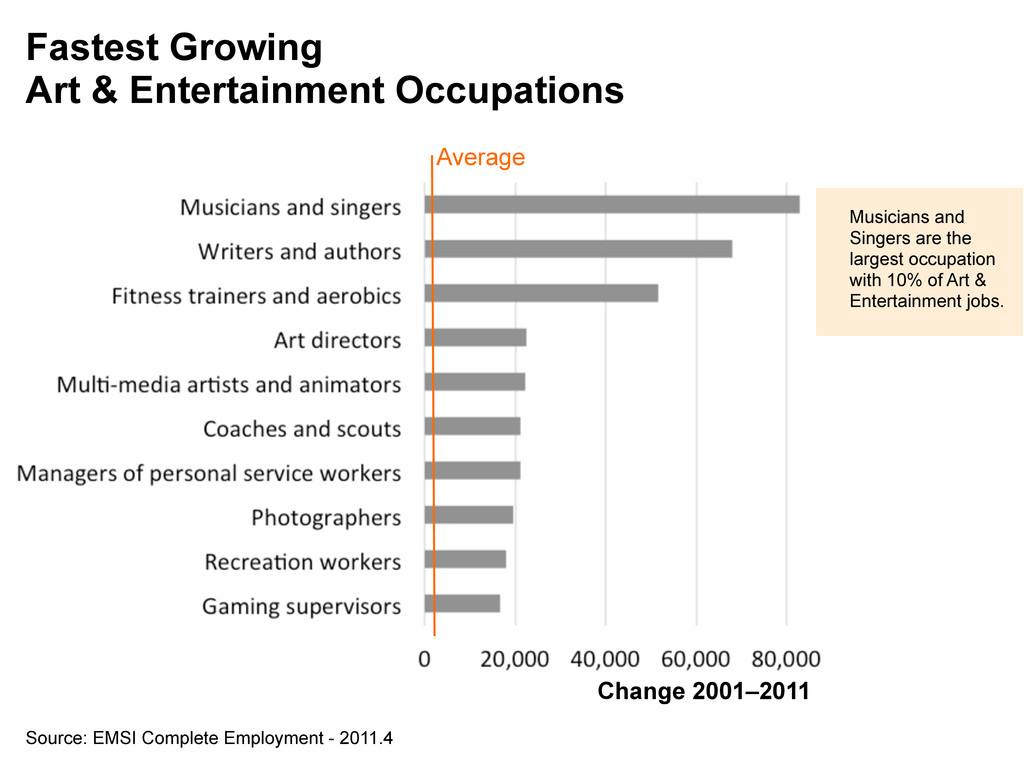
10,000 20,000 30,000 40,000 50,000 60,000 70,000 80,000 Gaming supervisors Coaches and scouts Writers and authors 90,000 0 10,000 20,000 30,000 40,000 50,000 60,000 70,000 80,000 Encode Quantitative Values Gaming supervisors Coaches and scouts Writers and authors 80,000 0 10,000 20,000 30,000 40,000 50,000 60,000 70,000 Gaming supervisors Coaches and scouts Writers and authors 90,000 0 10,000 20,000 30,000 40,000 50,000 60,000 70,000 80,000 Posi%on Length Slope Posi%on
![Data Visualization Best Practices VisualizingEconomics.com Catherine Mulbrandon [email protected] @cmulbrandon](https://files.speakerdeck.com/presentations/505f6089b519fb0002008150/slide_0.jpg)