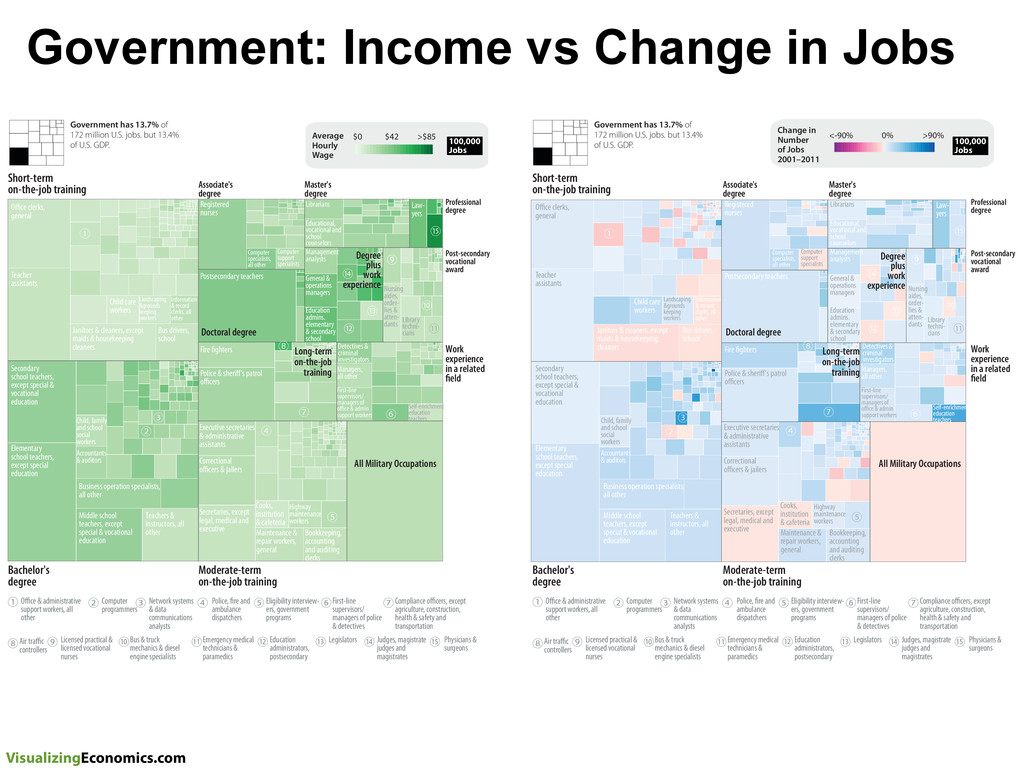
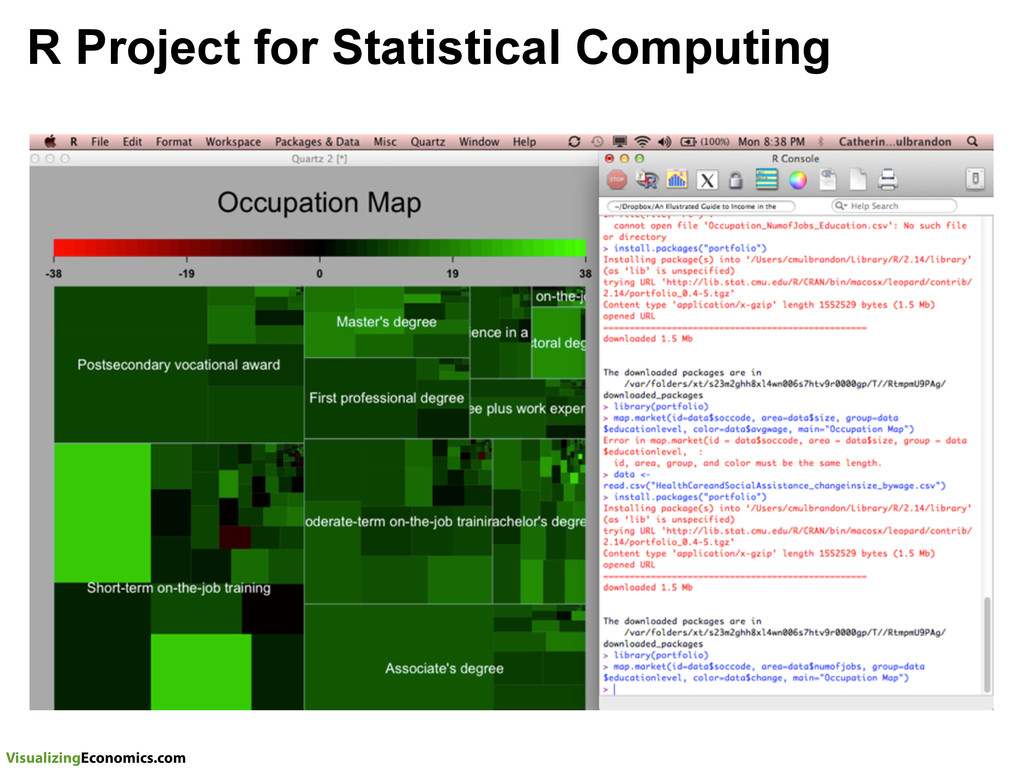
in Number of Jobs 2001–2011 ᶋ ᶌ ᶃ ᶄ ᶅ ᶆ ᶇ ᶈ ᶉ ᶊ ᶍ ᶎ ᶏ ᶐ Short-term on-the-job training Moderate-term on-the-job training Associate's degree Doctoral degree Work experience in a related field All Military Occupations Professional degree Bachelor's degree Degree plus work experience Post-secondary vocational award Master's degree Elementary school teachers, except special education Middle school teachers, except special & vocational education Secretaries, except legal, medical and executive Maintenance & repair workers, general Bookkeeping, accounting and auditing clerks Cooks, institution & cafeteria Highway maintenance workers Correctional o cers & jailers Executive secretaries & administrative assistants Police & sheri 's patrol o cers Postsecondary teachers Law- yers Registered nurses Education admins. elementary & secondary school Nursing aides, order- lies & atten- dants First-line supervisors/ managers of o ce & admin support workers Managers, all other Detectives & criminal investigators Self-enrichment education teachers Library techni- cians General & operations managers Management analysts Educational, vocational and school counselors Librarians Computer specialists, all other Computer support specialists Fire ghters Business operation specialists, all other Teachers & instructors, all other Accountants & auditors Child, family and school social workers Secondary school teachers, except special & vocational education Teacher assistants Janitors & cleaners, except maids & housekeeping cleaners Bus drivers, school Child care workers Landscaping &grounds keeping workers Information & record clerks, all other O ce clerks, general ᶑ ᶌ Compliance o cers, except agriculture, construction, health & safety and transportation Air tra c controllers Bus & truck mechanics & diesel engine specialists Education administrators, postsecondary Emergency medical technicians & paramedics Legislators Judges, magistrate judges and magistrates Physicians & surgeons Computer programmers First-line supervisors/ managers of police & detectives Police, re and ambulance dispatchers O ce & administrative support workers, all other Eligibility interview- ers, government programs Network systems & data communications analysts ᶃ ᶄ ᶅ ᶆ ᶇ ᶈ ᶉ ᶊ Licensed practical & licensed vocational nurses ᶋ ᶍ ᶎ ᶏ ᶐ ᶑ ᶌ Compliance o cers, except agriculture, construction, health & safety and transportation Air tra c controllers Bus & truck mechanics & diesel engine specialists Education administrators, postsecondary Emergency medical technicians & paramedics Legislators Judges, magistrate judges and magistrates Physicians & surgeons Computer programmers First-line supervisors/ managers of police & detectives Police, re and ambulance dispatchers O ce & administrative support workers, all other Eligibility interview- ers, government programs Network systems & data communications analysts ᶃ ᶄ ᶅ ᶆ ᶇ ᶈ ᶉ ᶊ Licensed practical & licensed vocational nurses ᶋ ᶍ ᶎ ᶏ ᶐ ᶑ ᶋ ᶌ ᶃ ᶄ ᶅ ᶆ ᶇ ᶈ ᶉ ᶊ ᶍ ᶎ ᶏ ᶐ Short-term on-the-job training Moderate-term on-the-job training Associate's degree Doctoral degree Work experience in a related field All Military Occupations Long-term on-the-job training Long-term on-the-job training Professional degree Bachelor's degree Degree plus work experience Post-secondary vocational award Master's degree Elementary school teachers, except special education Middle school teachers, except special & vocational education Secretaries, except legal, medical and executive Maintenance & repair workers, general Bookkeeping, accounting and auditing clerks Cooks, institution & cafeteria Highway maintenance workers Correctional o cers & jailers Executive secretaries & administrative assistants Police & sheri 's patrol o cers Postsecondary teachers Law- yers Registered nurses Education admins. elementary & secondary school Nursing aides, order- lies & atten- dants First-line supervisors/ managers of o ce & admin support workers Managers, all other Detectives & criminal investigators Self-enrichment education teachers Library techni- cians General & operations managers Management analysts Educational, vocational and school counselors Librarians Computer specialists, all other Computer support specialists Fire ghters Business operation specialists, all other Teachers & instructors, all other Accountants & auditors Child, family and school social workers Secondary school teachers, except special & vocational education Teacher assistants Janitors & cleaners, except maids & housekeeping cleaners Bus drivers, school Child care workers Landscaping &grounds keeping workers Information & record clerks, all other O ce clerks, general ᶑ Government has 13.7% of 172 million U.S. jobs. but 13.4% of U.S. GDP. Government has 13.7% of 172 million U.S. jobs. but 13.4% of U.S. GDP. 100,000 Jobs 100,000 Jobs VisualizingEconomics.com Government: Income vs Change in Jobs
![Visualizing Economics VisualizingEconomics.com Catherine Mulbrandon [email protected] @visualecon](https://files.speakerdeck.com/presentations/4fb544a298523b001f002c30/slide_0.jpg)
![VisualizingEconomics.com Catherine Mulbrandon [email protected] @visualecon](https://files.speakerdeck.com/presentations/4fb544a298523b001f002c30/slide_43.jpg)