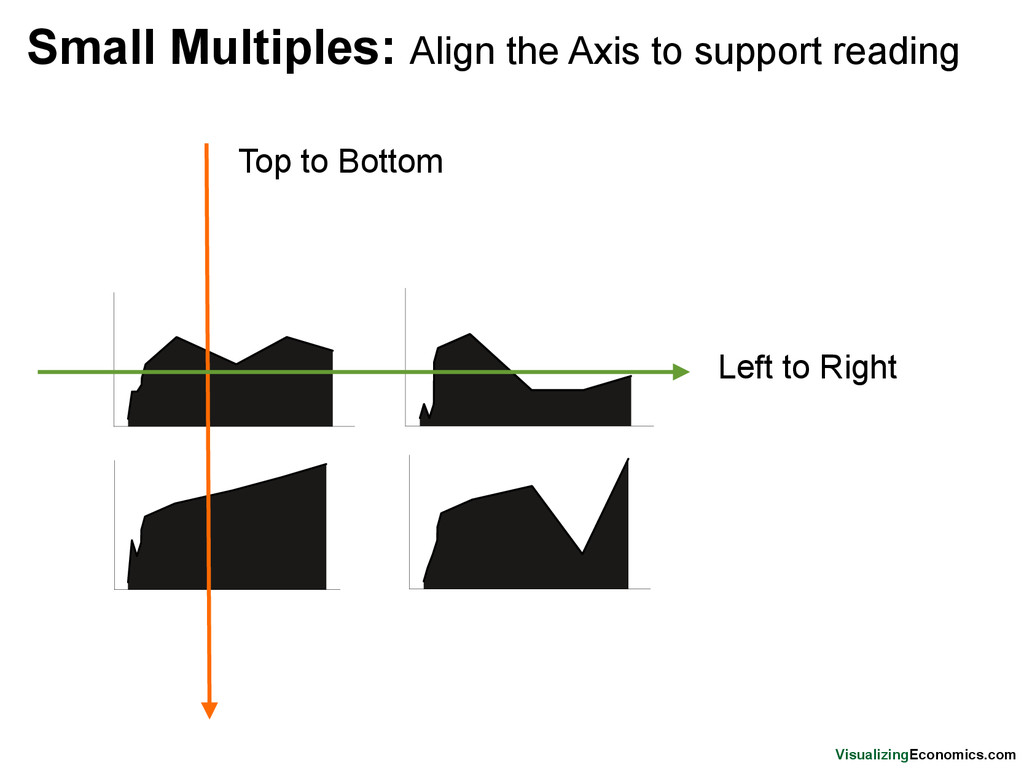
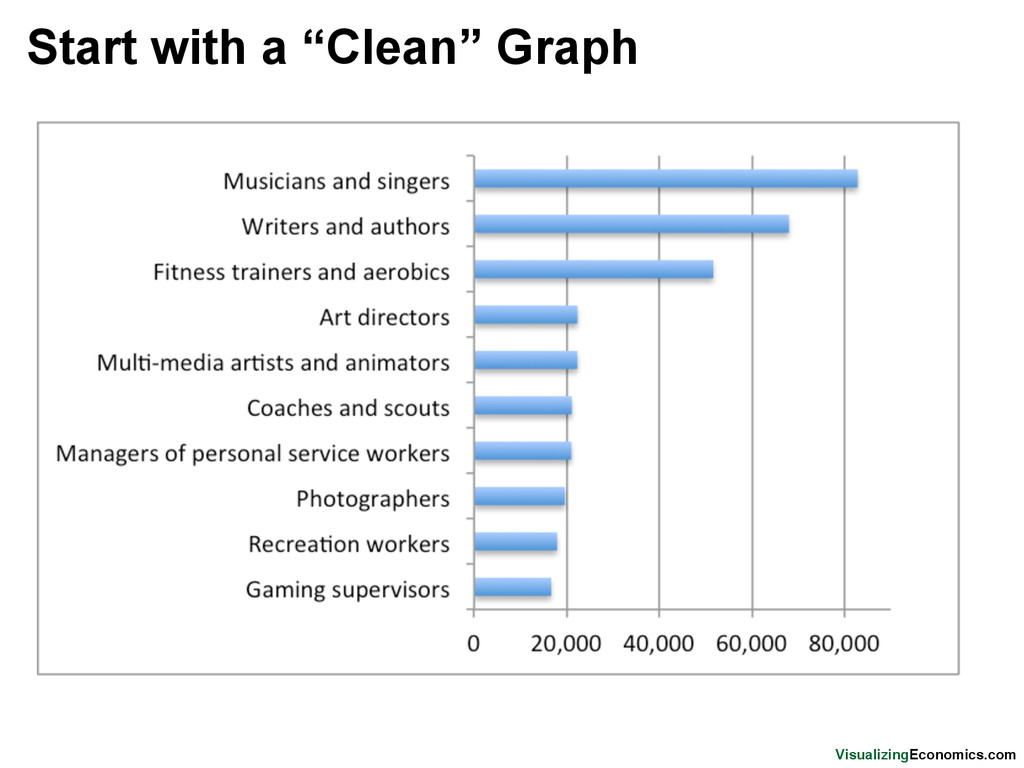
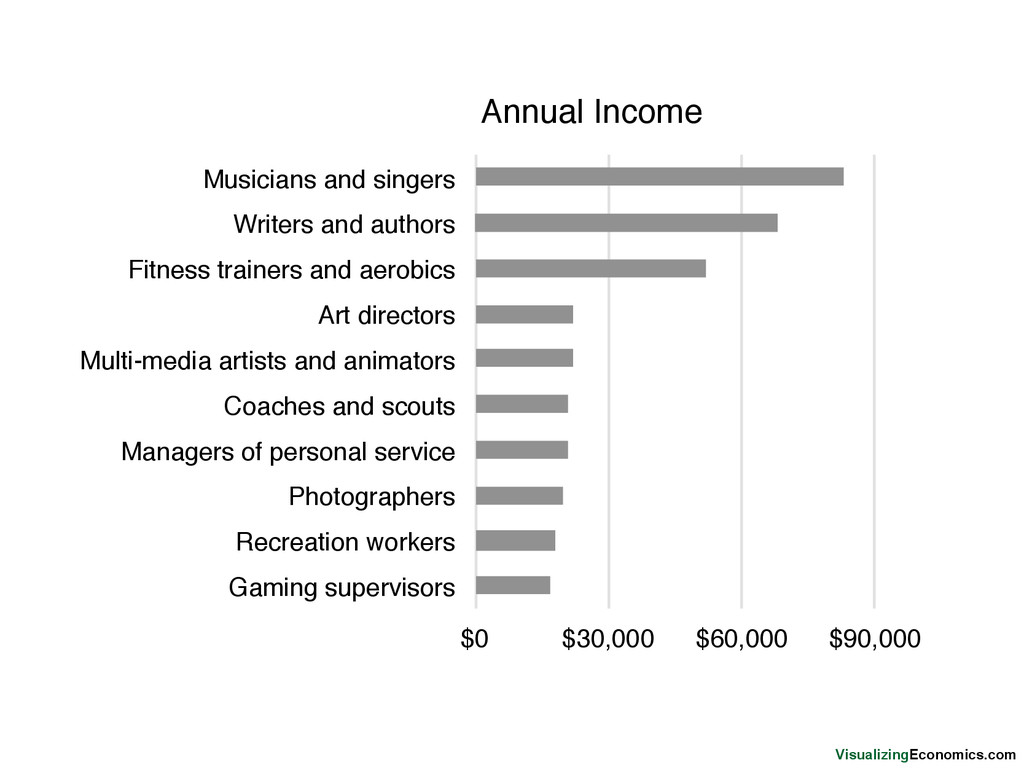
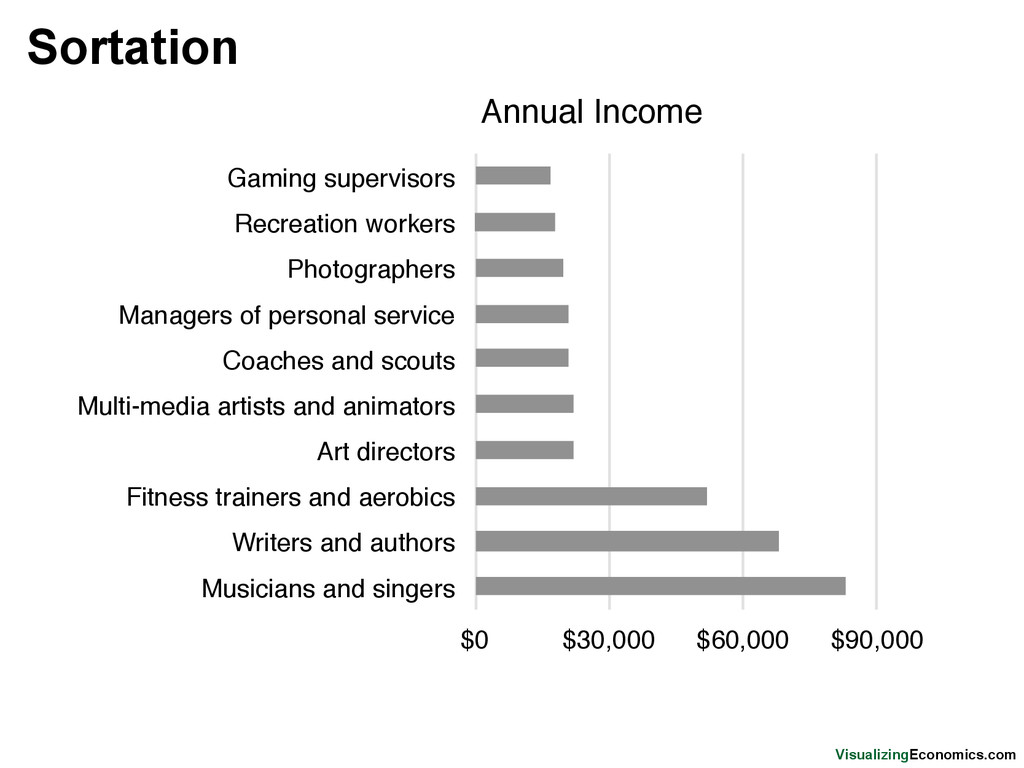
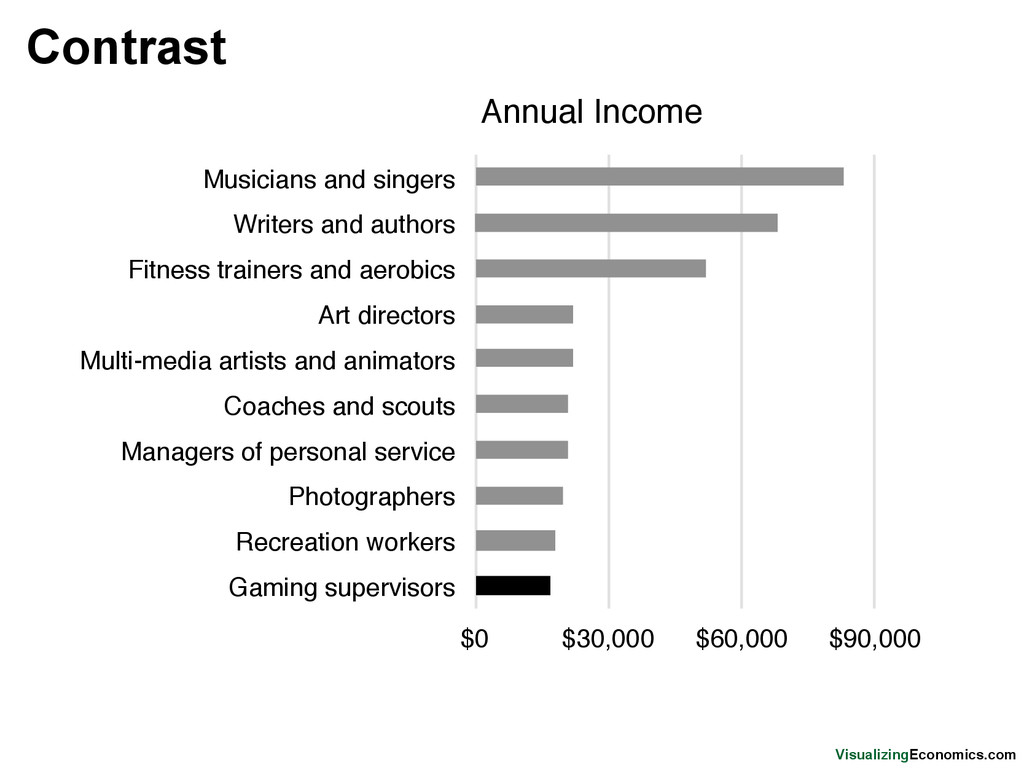
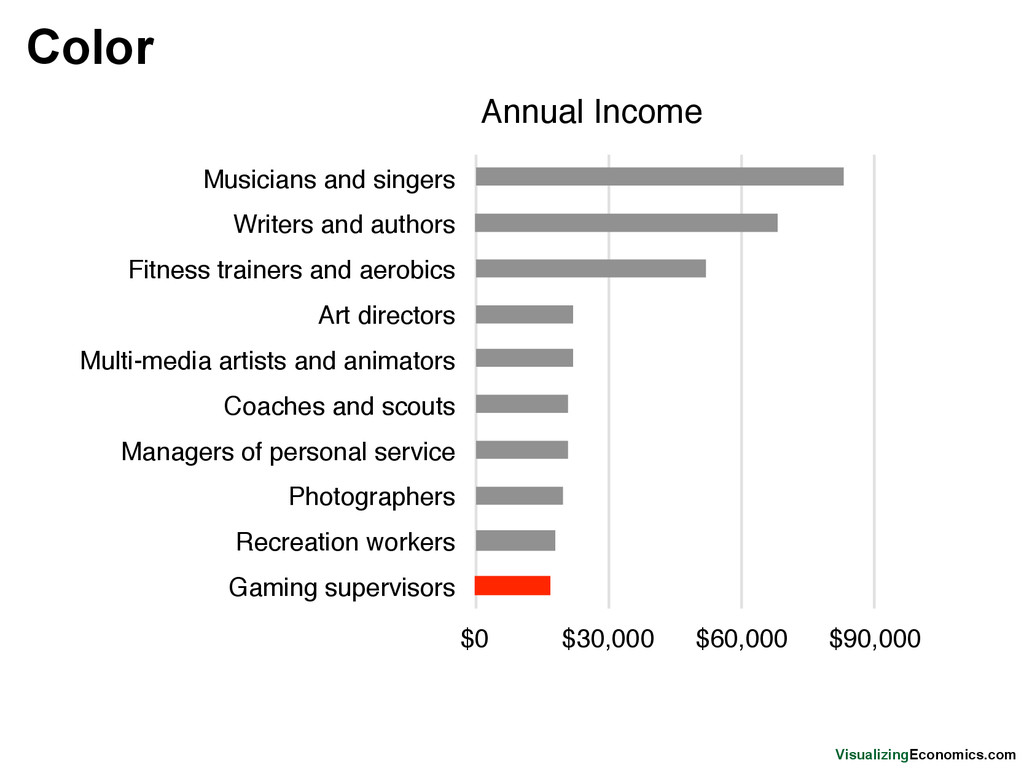
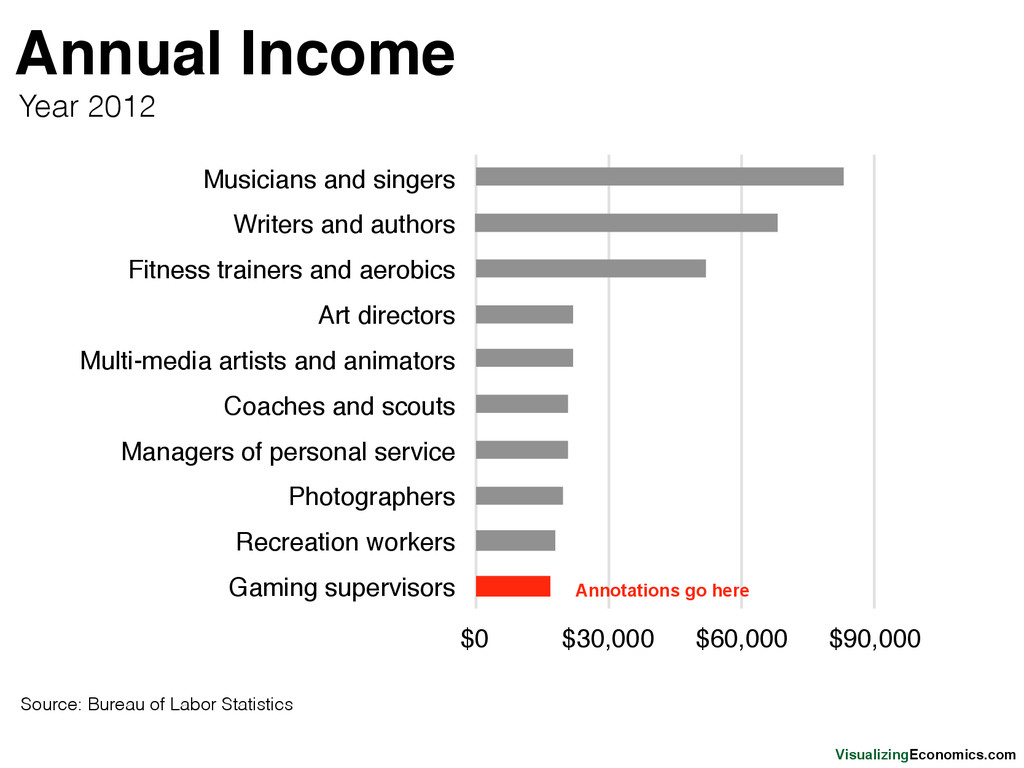
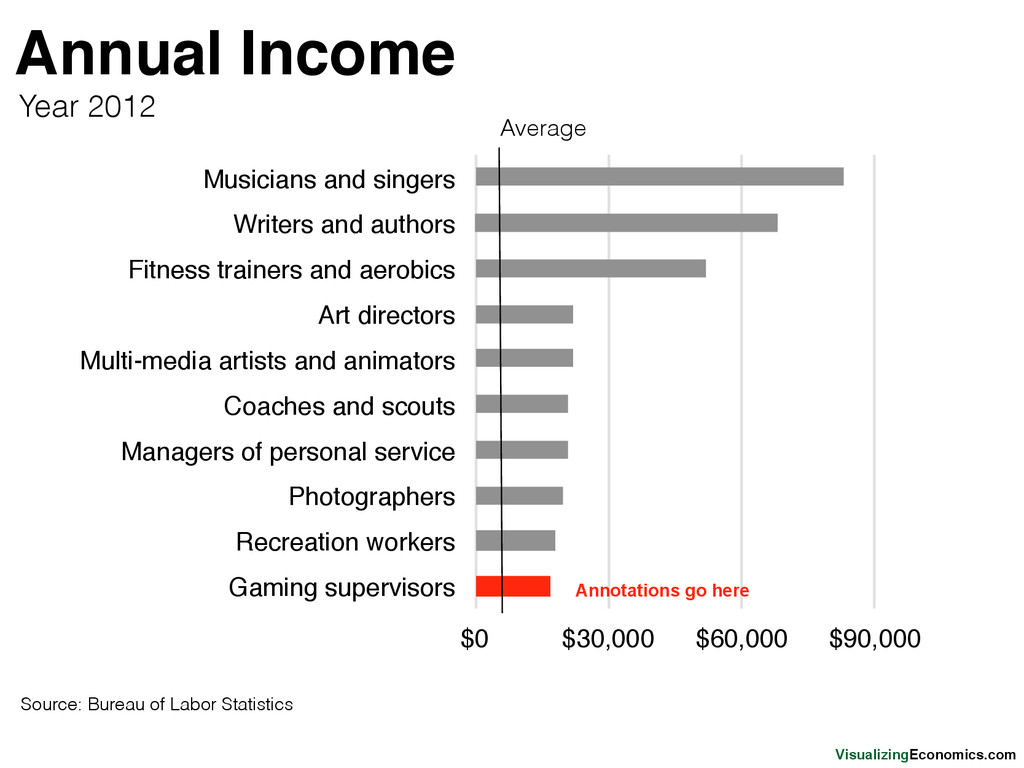
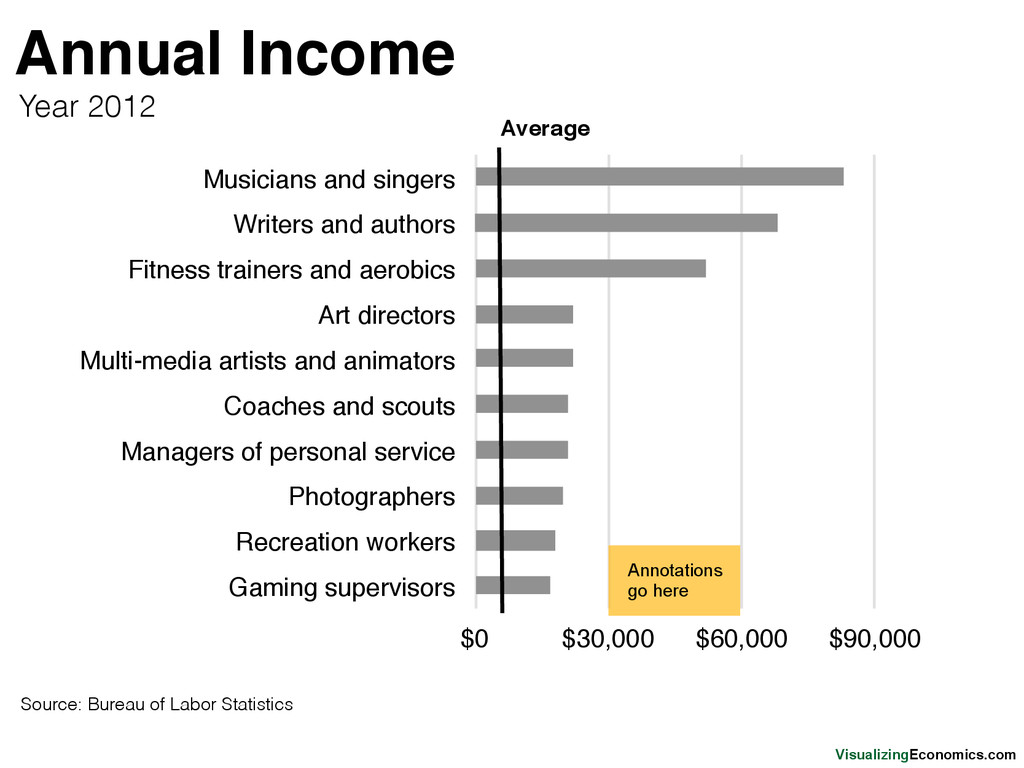
20,000 30,000 40,000 50,000 60,000 70,000 80,000 Gaming supervisors Photographers Coaches and scouts Art directors Writers and authors 90,000 20,000 30,000 40,000 50,000 60,000 70,000 80,000 Gaming supervisors Photographers Coaches and scouts Art directors Writers and authors 90,000 20,000 30,000 40,000 50,000 60,000 70,000 80,000 Gaming supervisors Photographers Coaches and scouts Art directors Writers and authors 90,000 20,000 30,000 40,000 50,000 60,000 70,000 80,000 Gaming supervisors Photographers Coaches and scouts Art directors Writers and authors Top to Bottom Left to Right
![Best Practices in Data Visualization VisualizingEconomics.com Catherine Mulbrandon [email protected] @visualecon](https://files.speakerdeck.com/presentations/dcd1c060c26b013182a106bc48385697/slide_0.jpg)
![VisualizingEconomics.com Catherine Mulbrandon [email protected] @visualecon](https://files.speakerdeck.com/presentations/dcd1c060c26b013182a106bc48385697/slide_52.jpg)