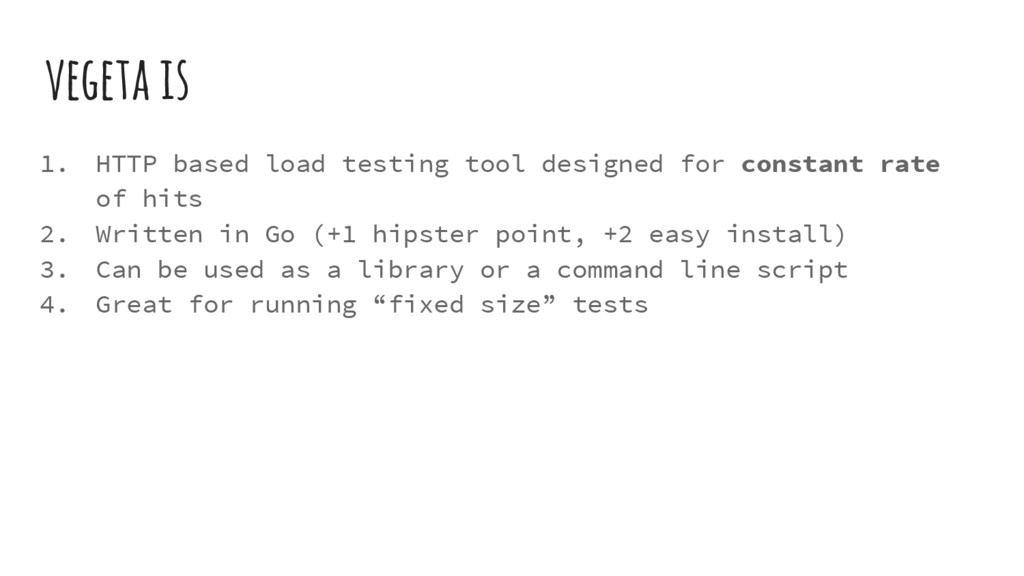
constant rate of hits 2. Written in Go (+1 hipster point, +2 easy install) 3. Can be used as a library or a command line script 4. Great for running “fixed size” tests
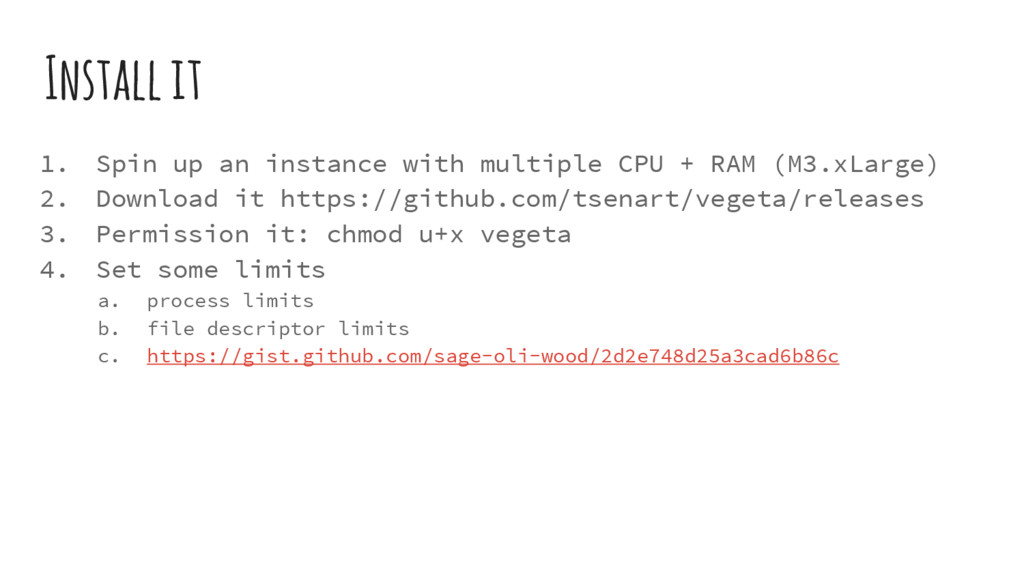
+ RAM (M3.xLarge) 2. Download it https://github.com/tsenart/vegeta/releases 3. Permission it: chmod u+x vegeta 4. Set some limits a. process limits b. file descriptor limits c. https://gist.github.com/sage-oli-wood/2d2e748d25a3cad6b86c
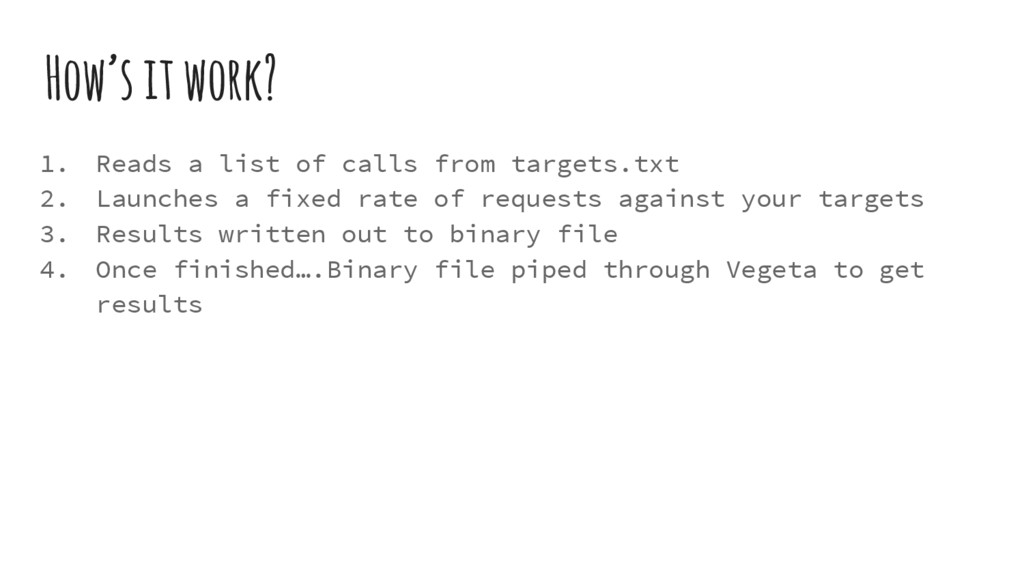
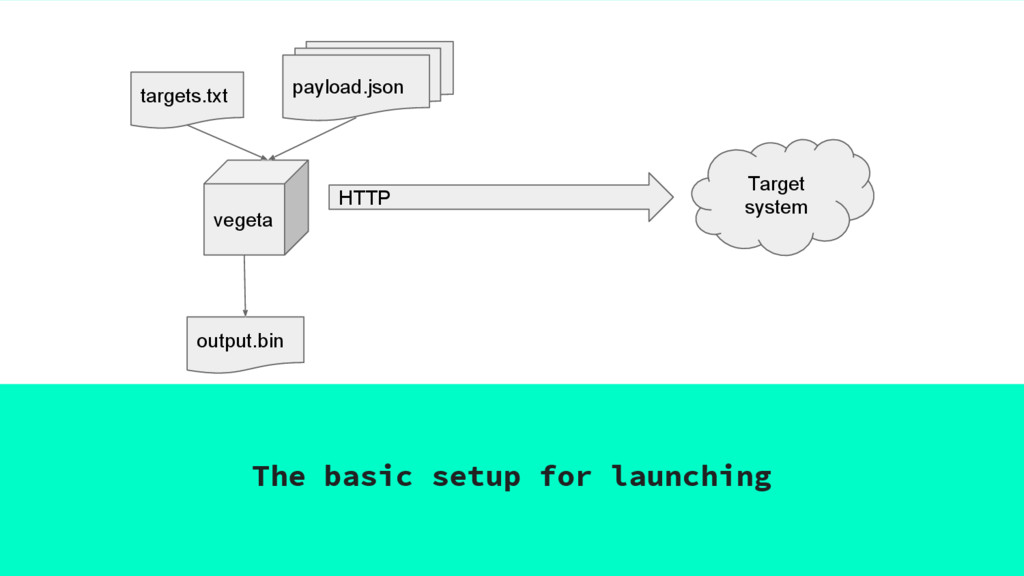
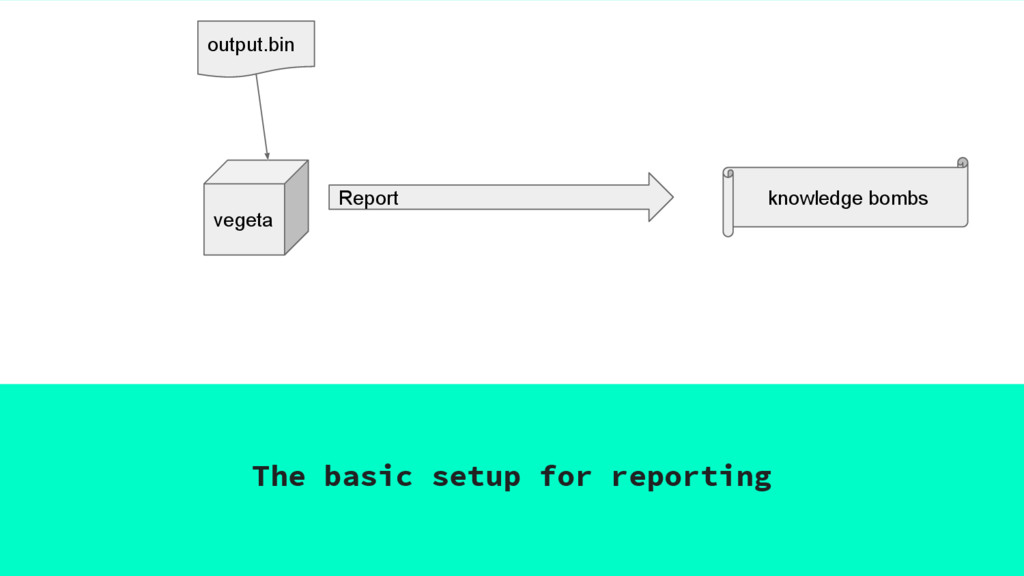
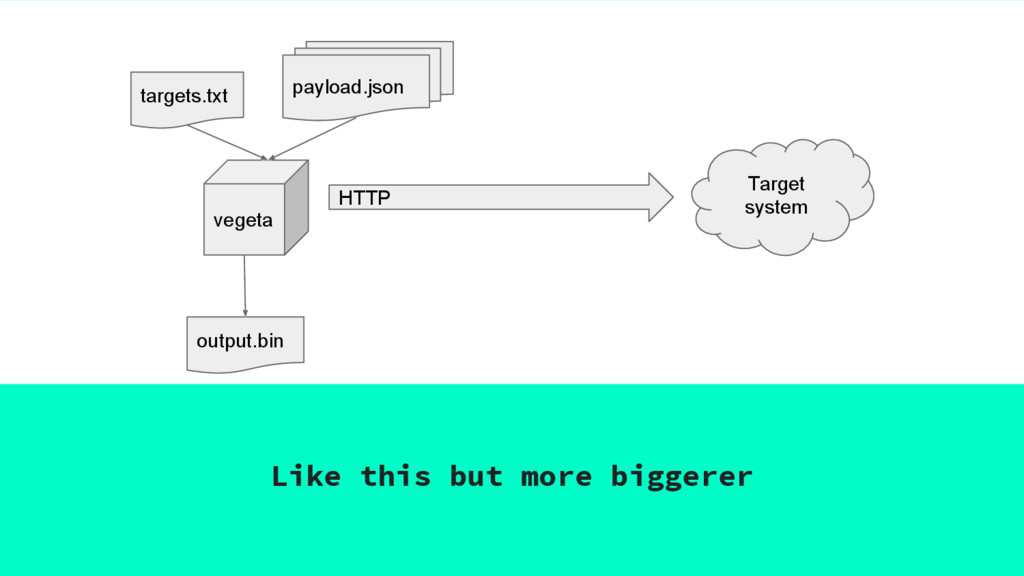
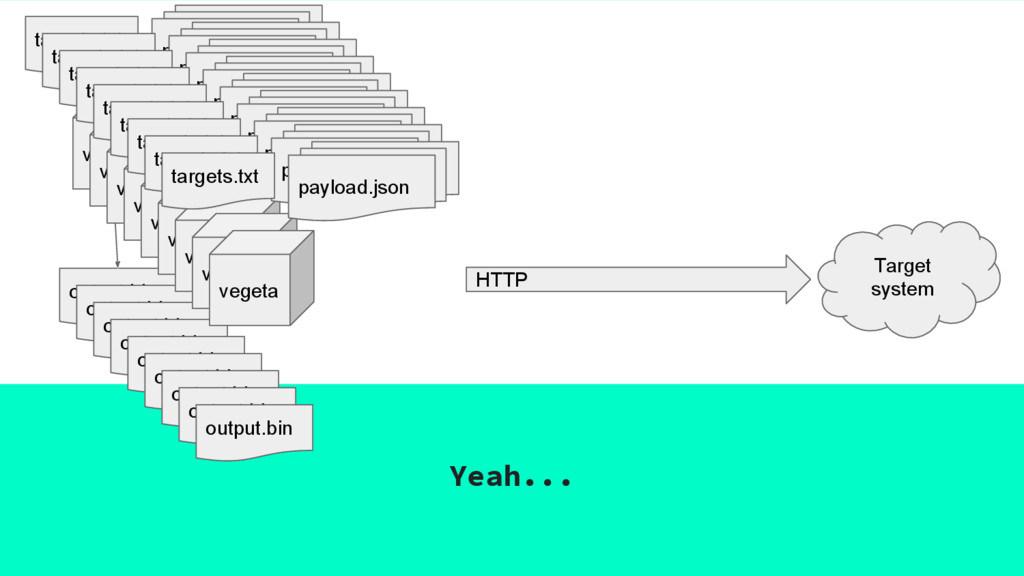
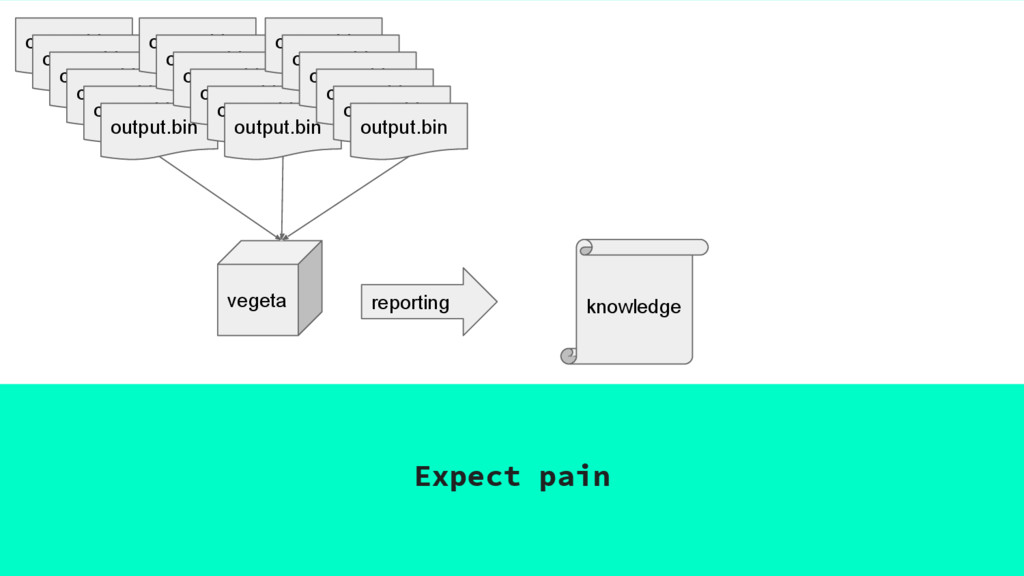
targets.txt 2. Launches a fixed rate of requests against your targets 3. Results written out to binary file 4. Once finished….Binary file piped through Vegeta to get results
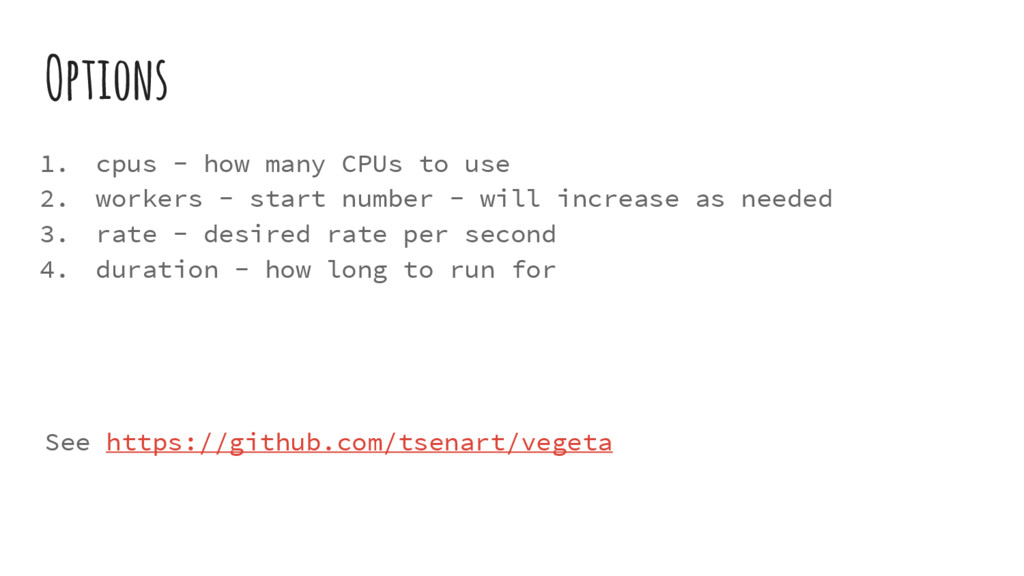
workers - start number - will increase as needed 3. rate - desired rate per second 4. duration - how long to run for See https://github.com/tsenart/vegeta
an S3 bucket 2. Download 3. awk out the right column 4. Replace any GUIDs using sed 5. sort | uniq -c | sort -rn See https://www.theapproachablegeek.co.uk/blog/parsing-elb- logs/
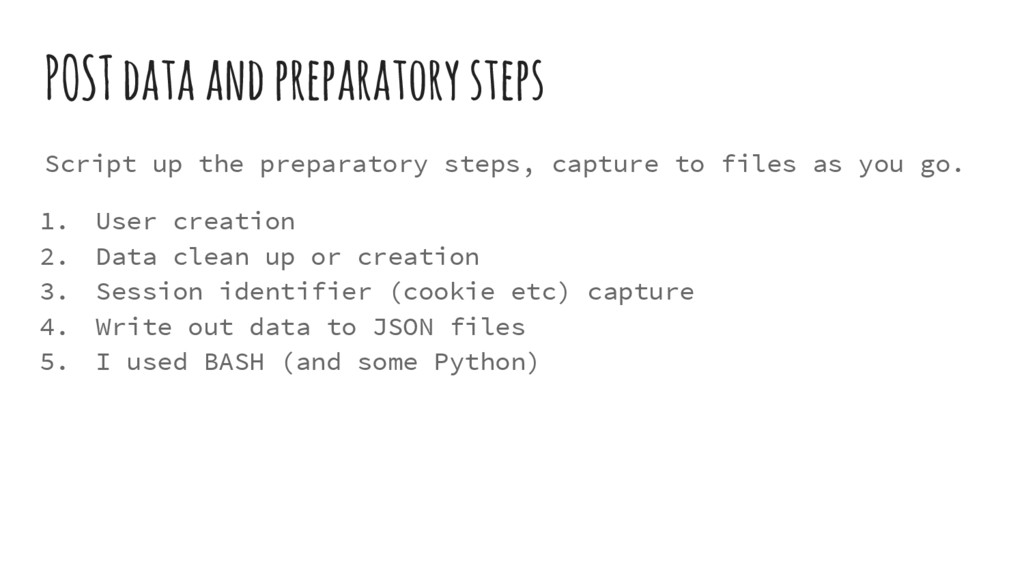
capture to files as you go. 1. User creation 2. Data clean up or creation 3. Session identifier (cookie etc) capture 4. Write out data to JSON files 5. I used BASH (and some Python)
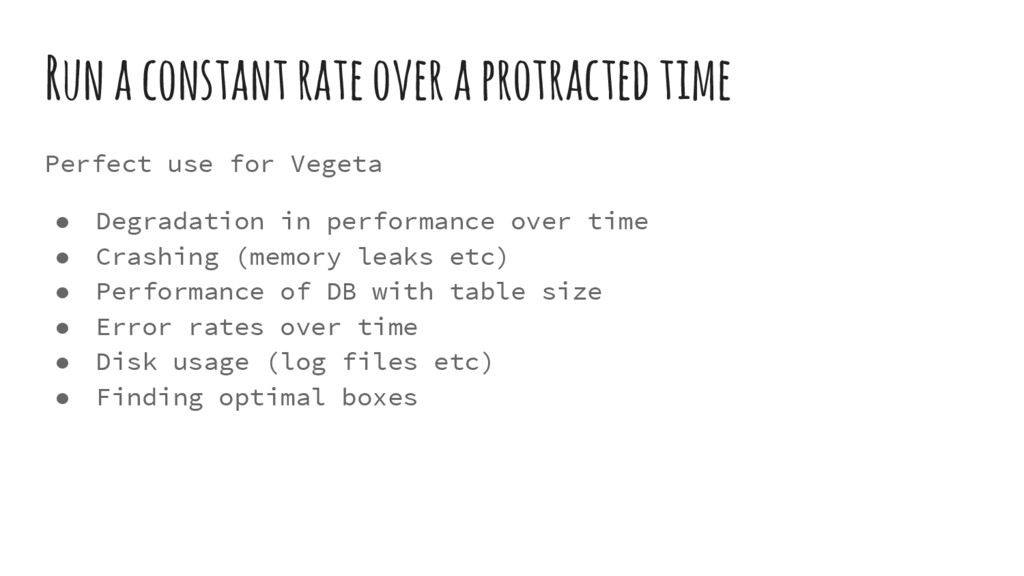
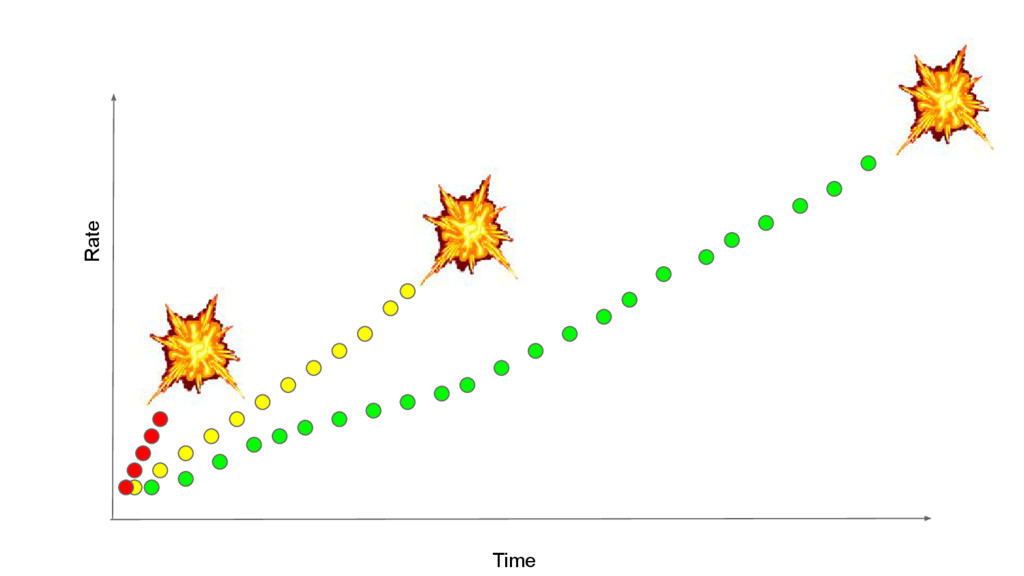
for Vegeta • Degradation in performance over time • Crashing (memory leaks etc) • Performance of DB with table size • Error rates over time • Disk usage (log files etc) • Finding optimal boxes
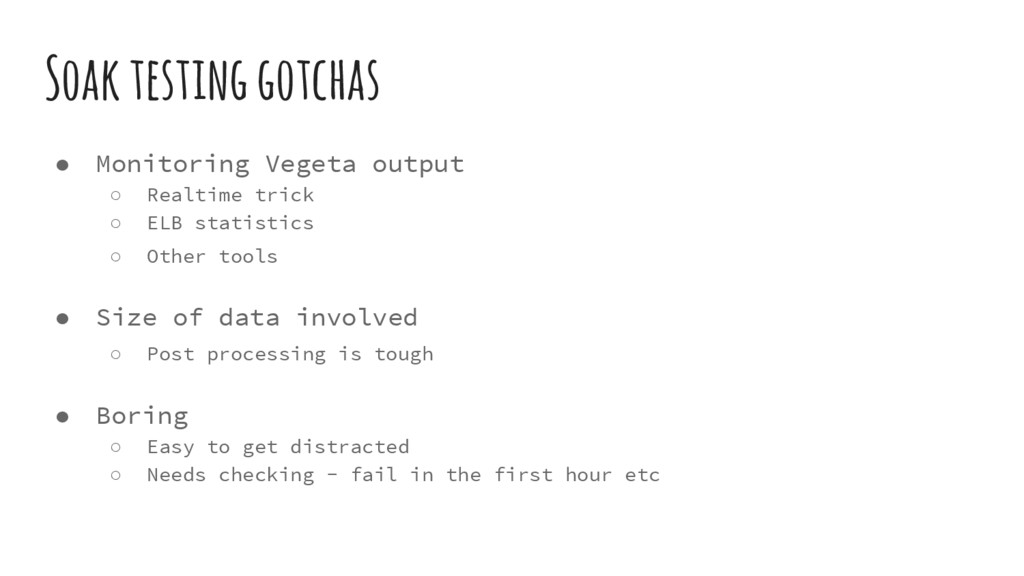
◦ ELB statistics ◦ Other tools • Size of data involved ◦ Post processing is tough • Boring ◦ Easy to get distracted ◦ Needs checking - fail in the first hour etc
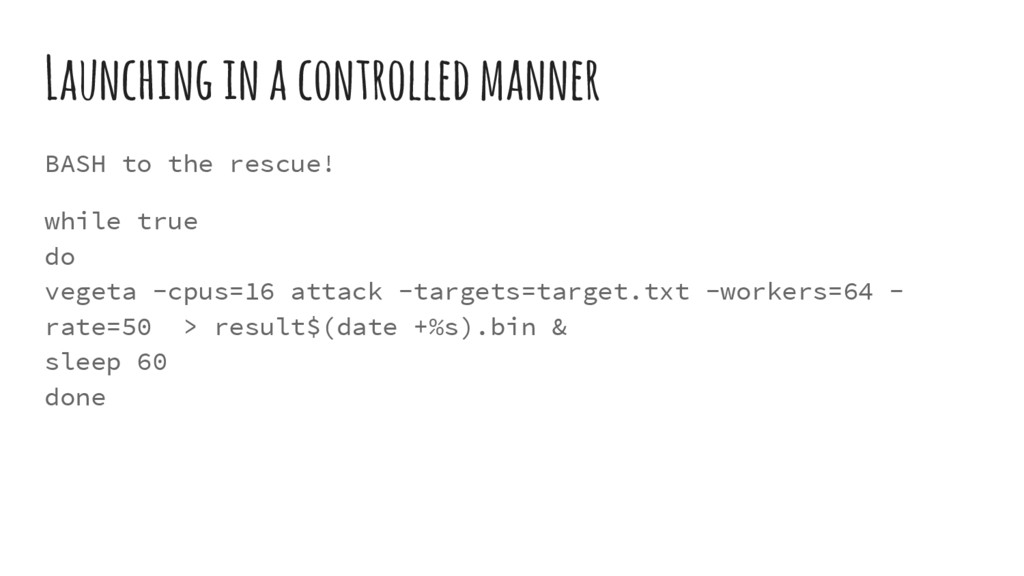
• Launch multiple instances of Vegeta in a controlled manner • Monitor in real time until ◦ Errors ◦ Latency (define in advance) • Use this info in your other tests
• sar/iostat/ et al on box • CloudWatch (ELB info) • DB tools (MONyog) • See http://techblog.netflix.com/2015/11/linux- performance-analysis-in-60s.html
boxes 2. Build hostname and timestamp into binary results 3. Consolidate output binaries to one place 4. CSSH for coordination (also alt-~) 5. EC2 to EC2 instance transfer for speed
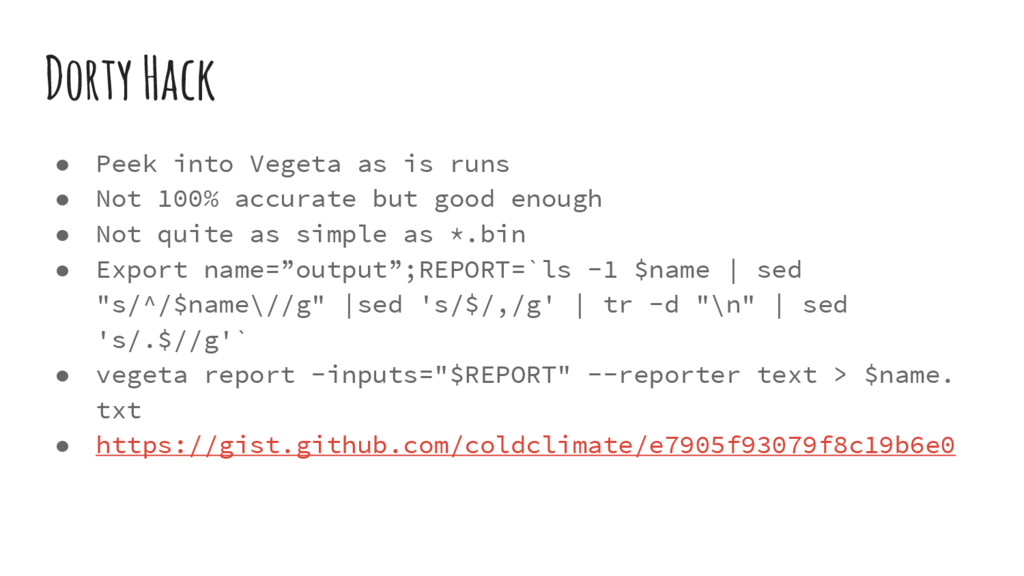
Not 100% accurate but good enough • Not quite as simple as *.bin • Export name=”output”;REPORT=`ls -1 $name | sed "s/^/$name\//g" |sed 's/$/,/g' | tr -d "\n" | sed 's/.$//g'` • vegeta report -inputs="$REPORT" --reporter text > $name. txt • https://gist.github.com/coldclimate/e7905f93079f8c19b6e0
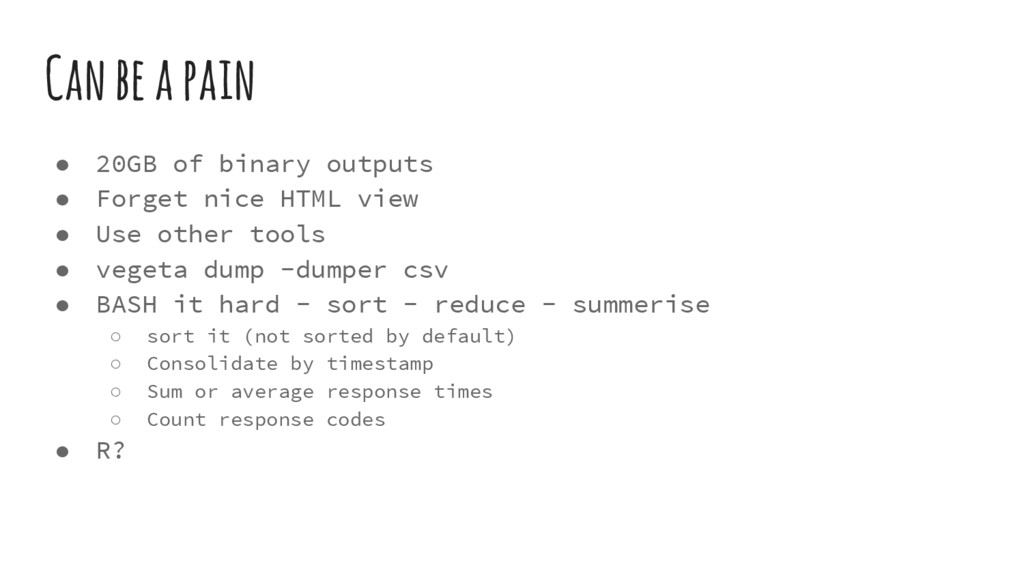
Forget nice HTML view • Use other tools • vegeta dump -dumper csv • BASH it hard - sort - reduce - summerise ◦ sort it (not sorted by default) ◦ Consolidate by timestamp ◦ Sum or average response times ◦ Count response codes • R?
![Output Requests [total, rate] 4000, 200.05 Duration [total, attack, wait]](https://files.speakerdeck.com/presentations/730eba4aed5544e9a37195dc6cea5e3a/slide_15.jpg)