Upgrade to Pro — share decks privately, control downloads, hide ads and more …

Production Infrastructure Monitoring Platform u...

Sponsored · Ship Features Fearlessly Turn features on and off without deploys. Used by thousands of Ruby developers.

Production Infrastructure Monitoring Platform using Terraform, Ansible, Docker & GitLab CI/CD on AWS

This presentation demonstrates the design and implementation of a production-style infrastructure monitoring platform using Infrastructure as Code (Terraform), Configuration Management (Ansible), Docker containers, and GitLab CI/CD. The project provisions AWS infrastructure, automates server configuration, deploys Prometheus, Grafana, and Alertmanager, and provides real-time monitoring with automated alerting. It covers the complete deployment workflow, architecture, monitoring stack, challenges encountered, and future enhancements.

Avatar for Sazad Ahemad

Sazad Ahemad

August 02, 2026

Other Decks in Technology

Transcript

  1. Setting up Infrastructure Monitoring Platform using Terraform, Ansible, Docker &

    GitLab CI/CD Infrastructure as Code | AWS | DevOps | Monitoring | Automation Presented by Sazad Ahemad gitlab.com/connect2sazad/prometheus-grafana-infra-setup gitlab.com/connect2sazad/prometheus-grafana-infra-setup
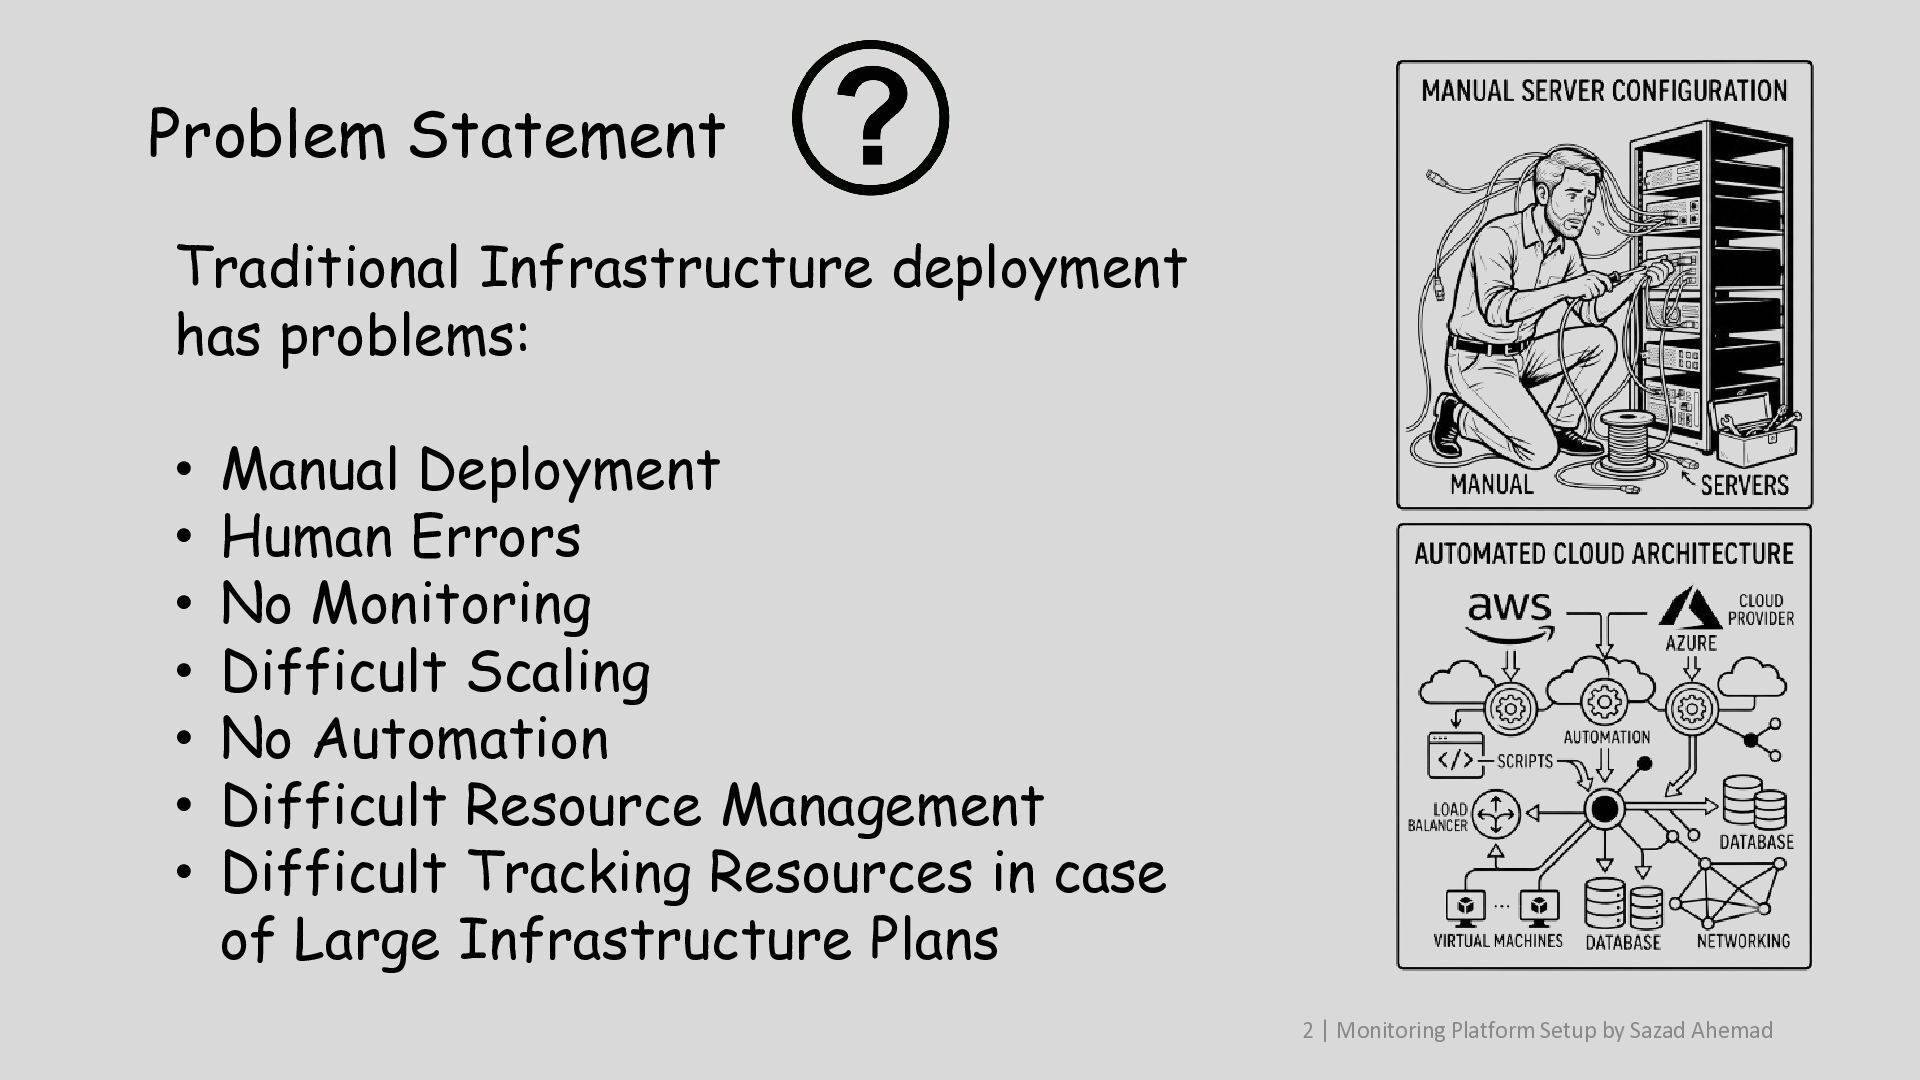
  2. Problem Statement Traditional Infrastructure deployment has problems: • Manual Deployment

    • Human Errors • No Monitoring • Difficult Scaling • No Automation • Difficult Resource Management • Difficult Tracking Resources in case of Large Infrastructure Plans 2 | Monitoring Platform Setup by Sazad Ahemad
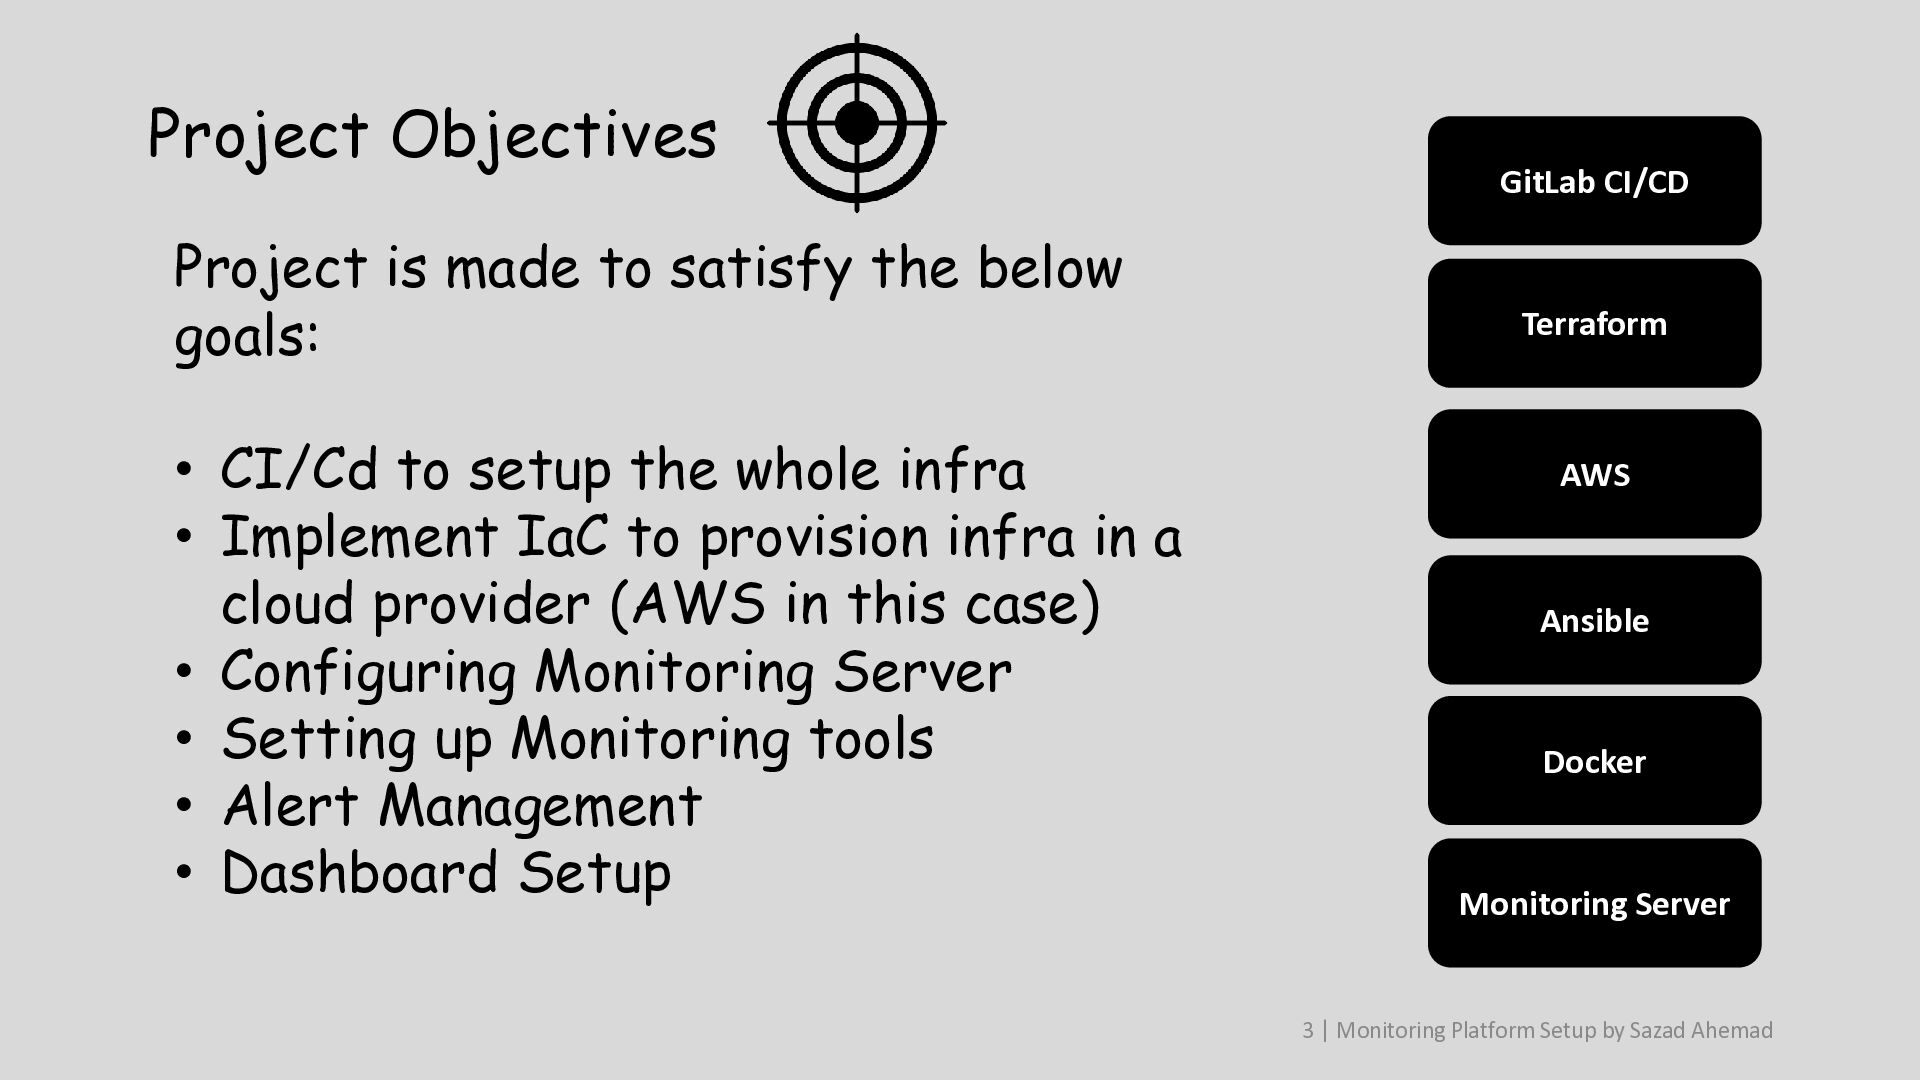
  3. Project Objectives Project is made to satisfy the below goals:

    • CI/Cd to setup the whole infra • Implement IaC to provision infra in a cloud provider (AWS in this case) • Configuring Monitoring Server • Setting up Monitoring tools • Alert Management • Dashboard Setup GitLab CI/CD Terraform AWS Ansible Docker Monitoring Server 3 | Monitoring Platform Setup by Sazad Ahemad
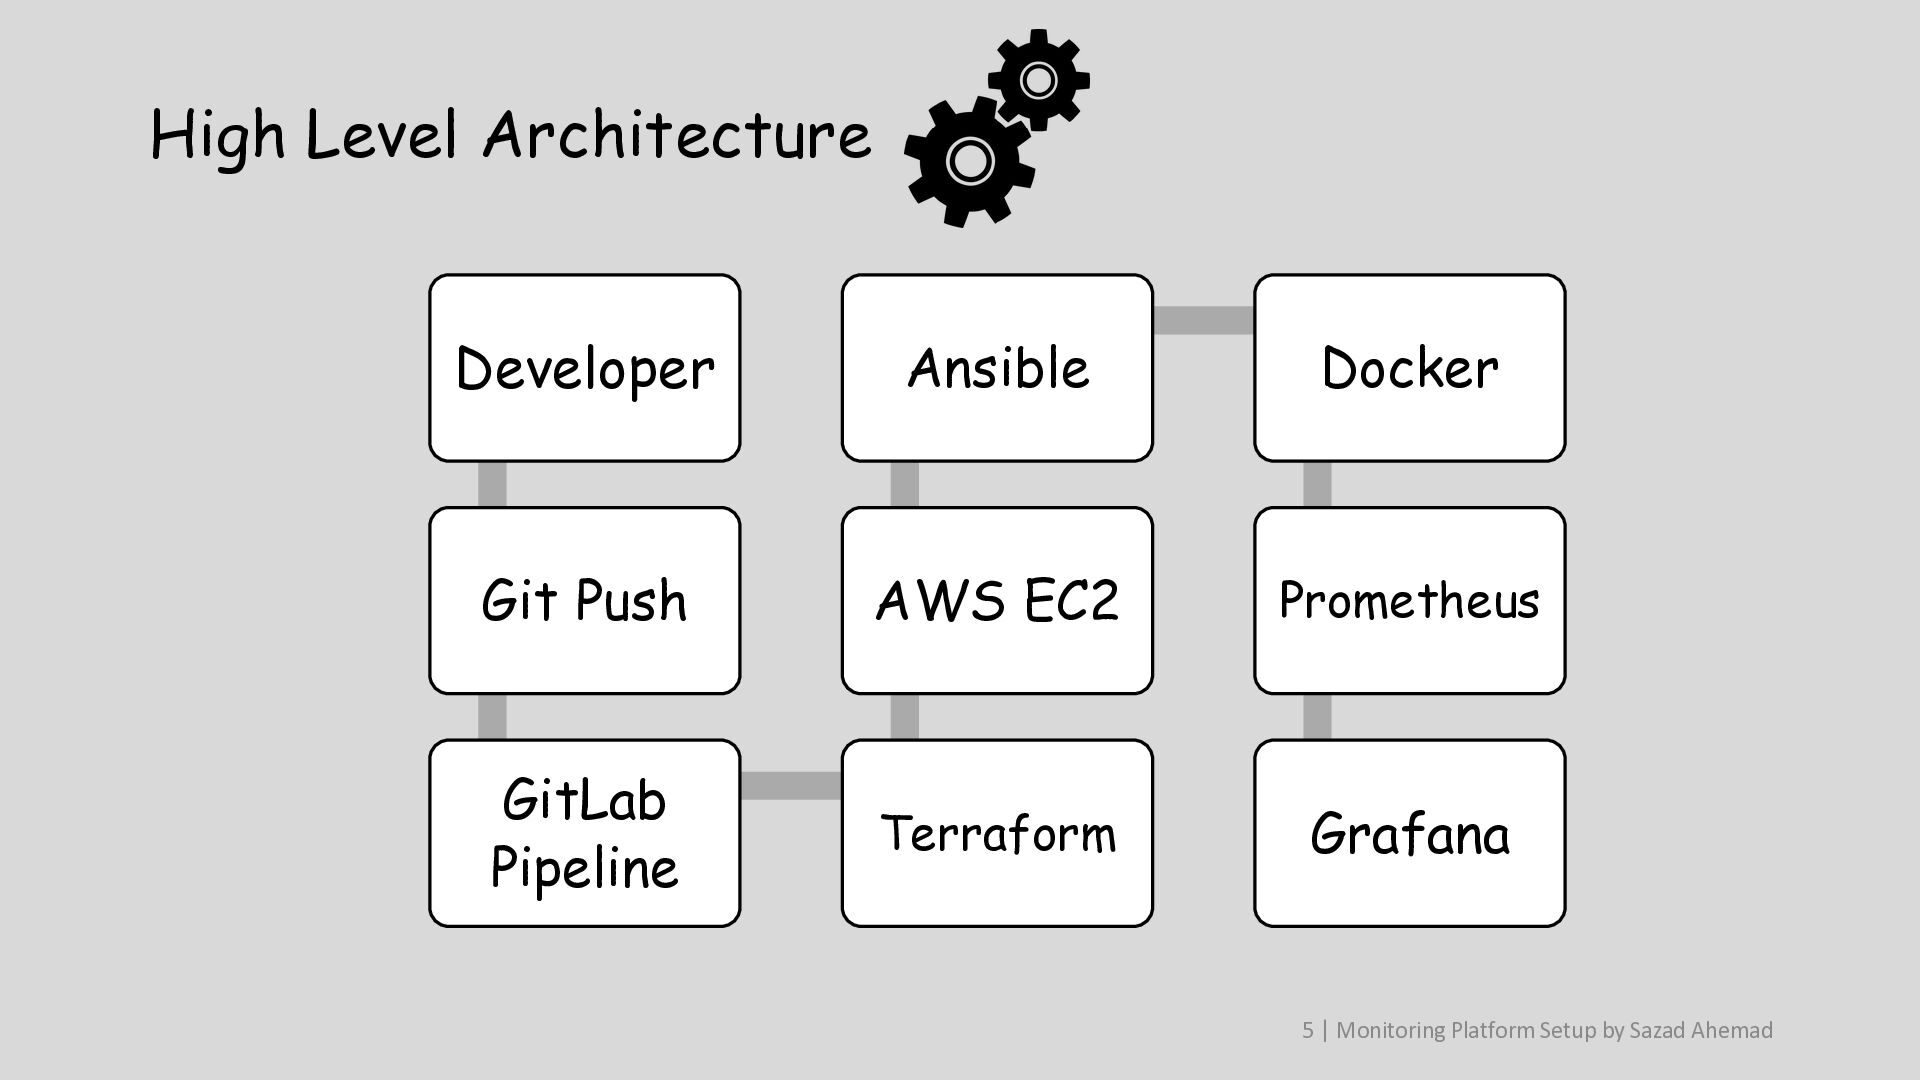
  4. High Level Architecture Developer Ansible Docker Git Push AWS EC2

    Prometheus GitLab Pipeline Terraform Grafana 5 | Monitoring Platform Setup by Sazad Ahemad
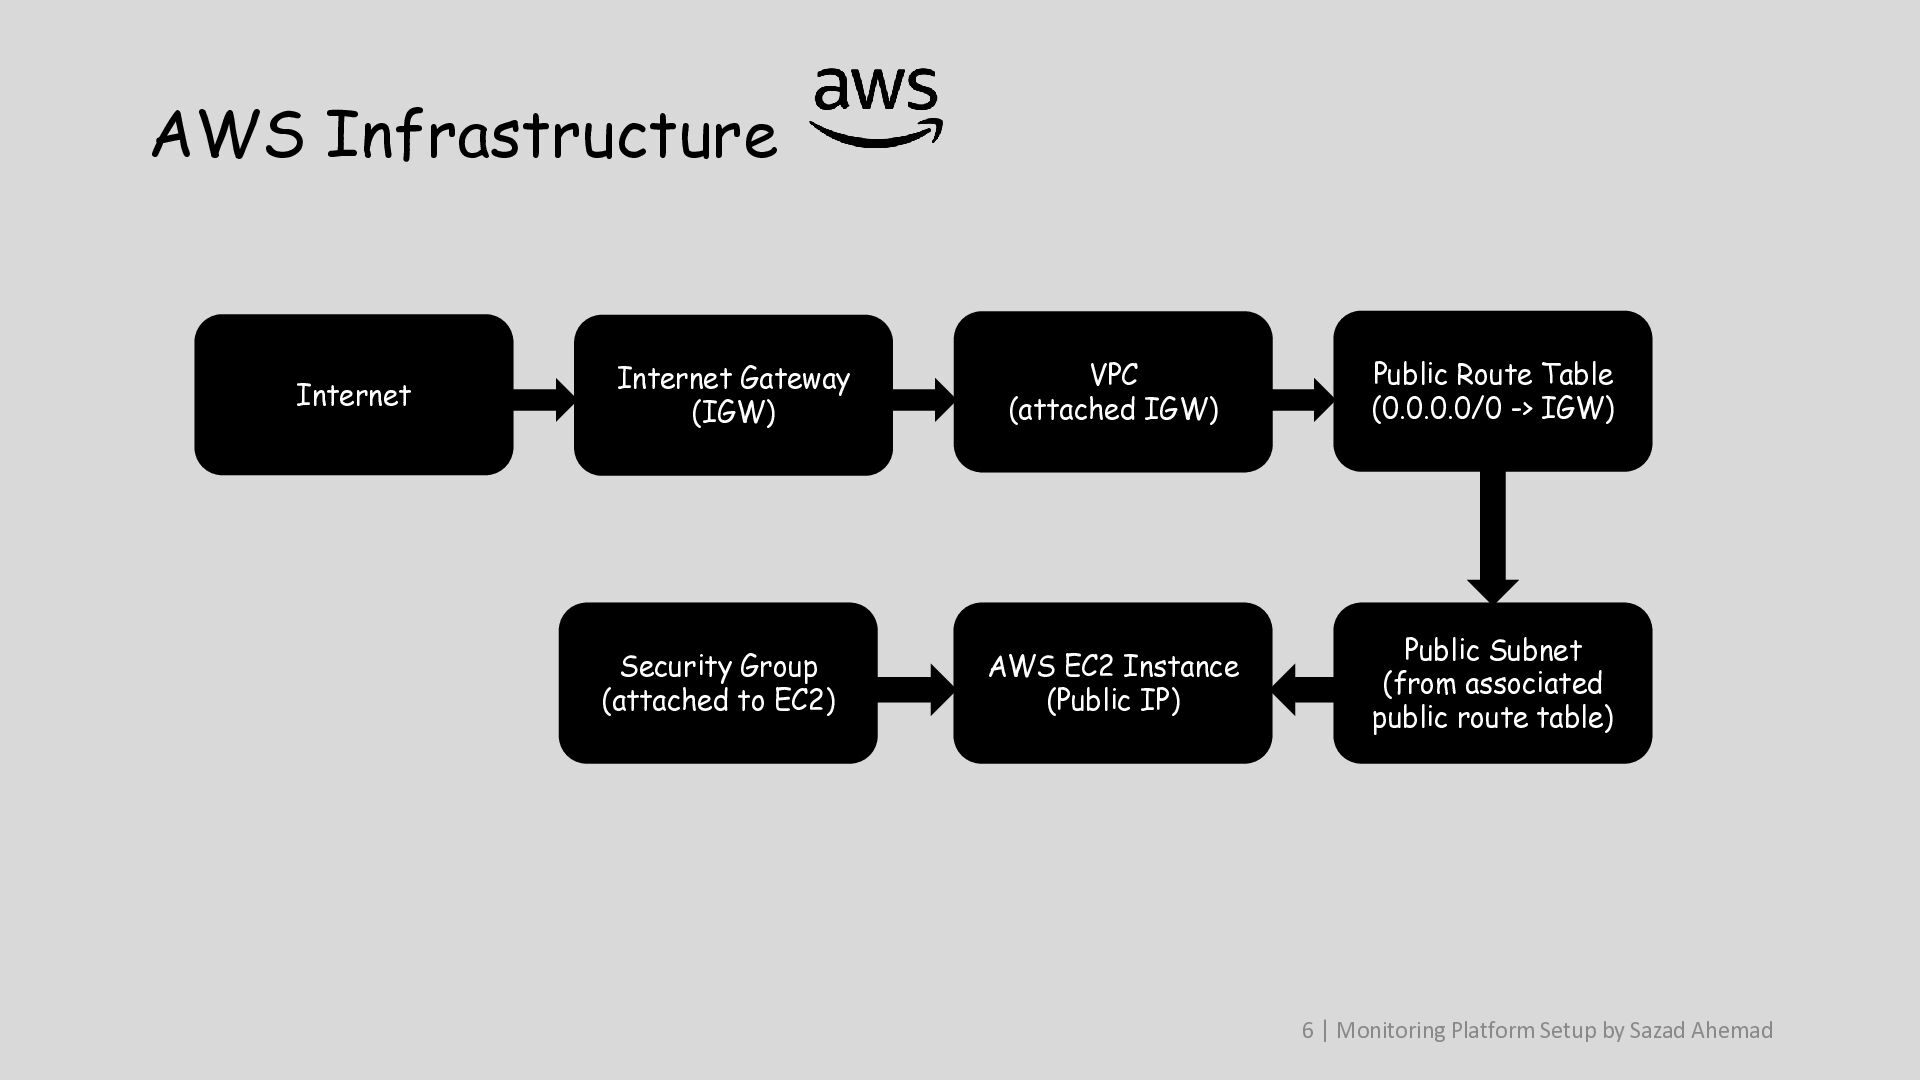
  5. AWS Infrastructure Internet Internet Gateway (IGW) VPC (attached IGW) Public

    Route Table (0.0.0.0/0 -> IGW) Security Group (attached to EC2) AWS EC2 Instance (Public IP) Public Subnet (from associated public route table) 6 | Monitoring Platform Setup by Sazad Ahemad
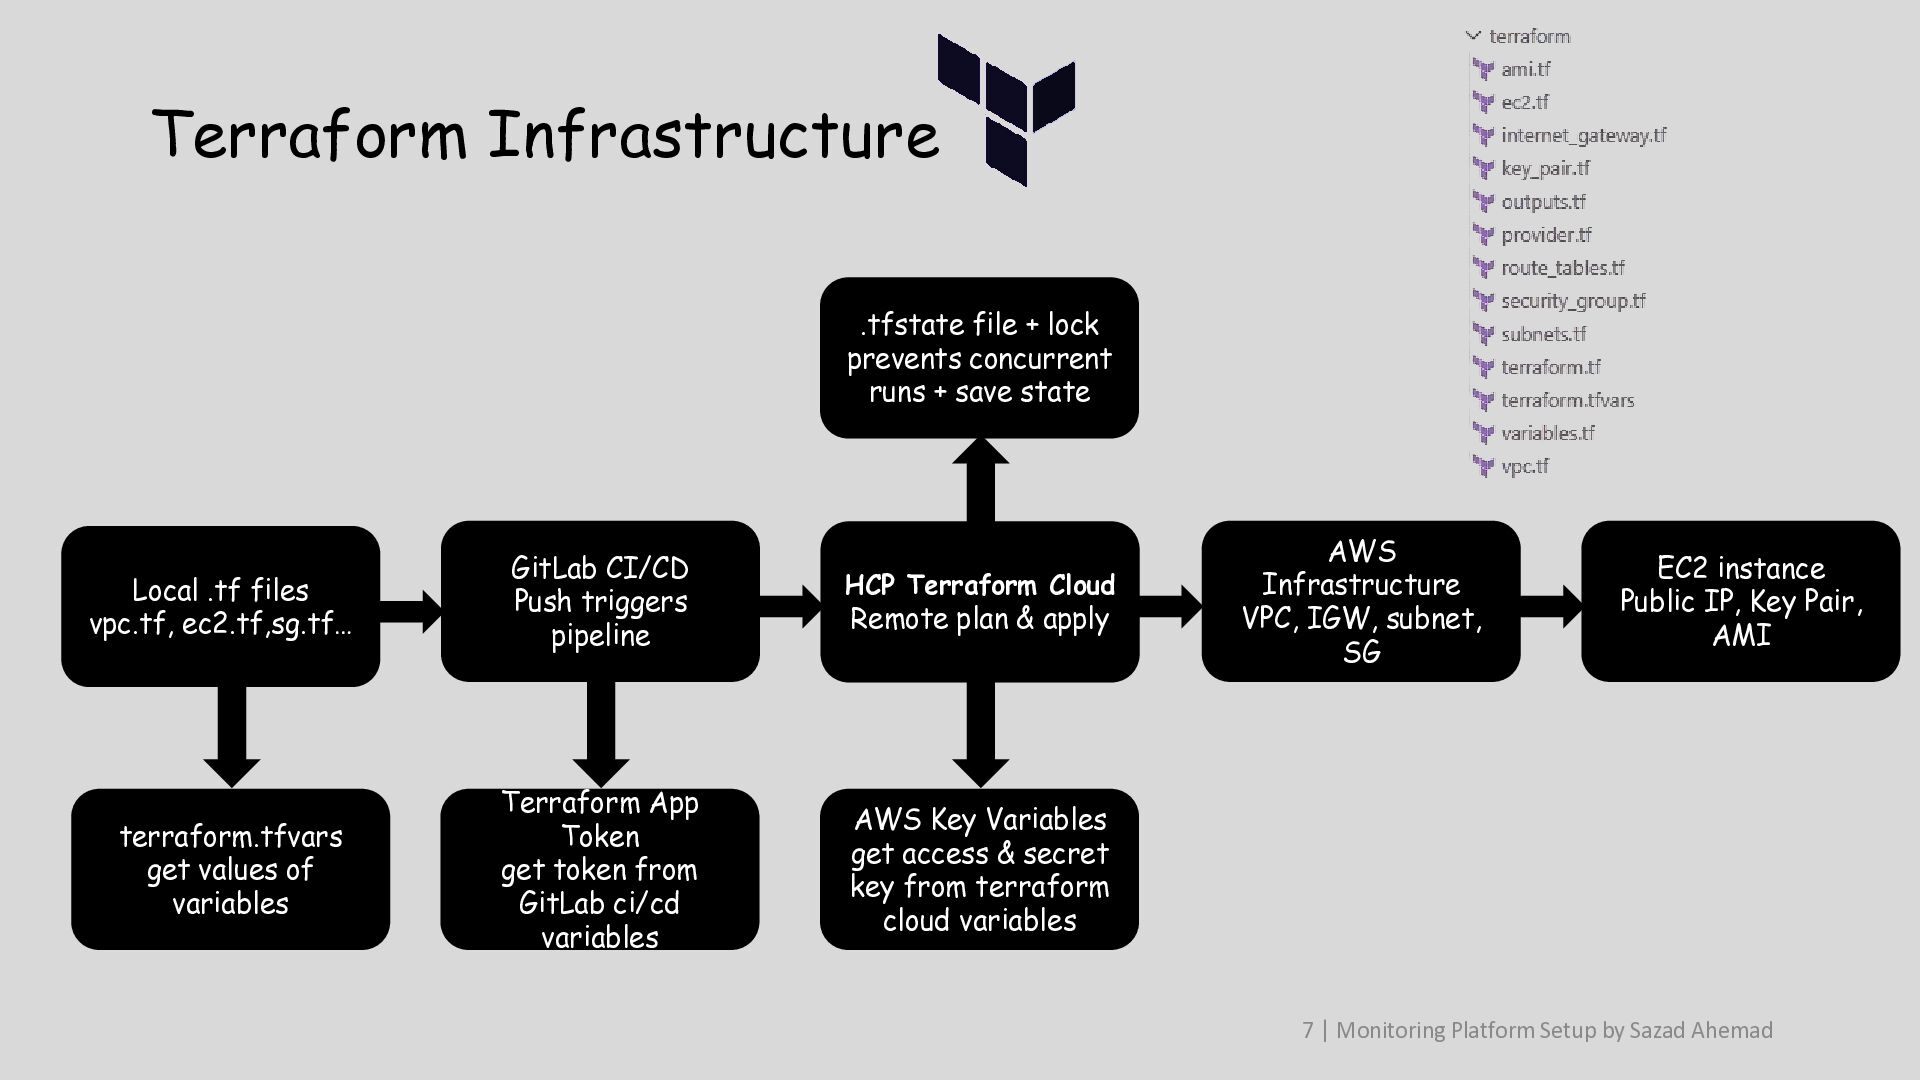
  6. Terraform Infrastructure .tfstate file + lock prevents concurrent runs +

    save state Local .tf files vpc.tf, ec2.tf,sg.tf… GitLab CI/CD Push triggers pipeline terraform.tfvars get values of variables Terraform App Token get token from GitLab ci/cd variables HCP Terraform Cloud Remote plan & apply AWS Infrastructure VPC, IGW, subnet, SG EC2 instance Public IP, Key Pair, AMI AWS Key Variables get access & secret key from terraform cloud variables 7 | Monitoring Platform Setup by Sazad Ahemad
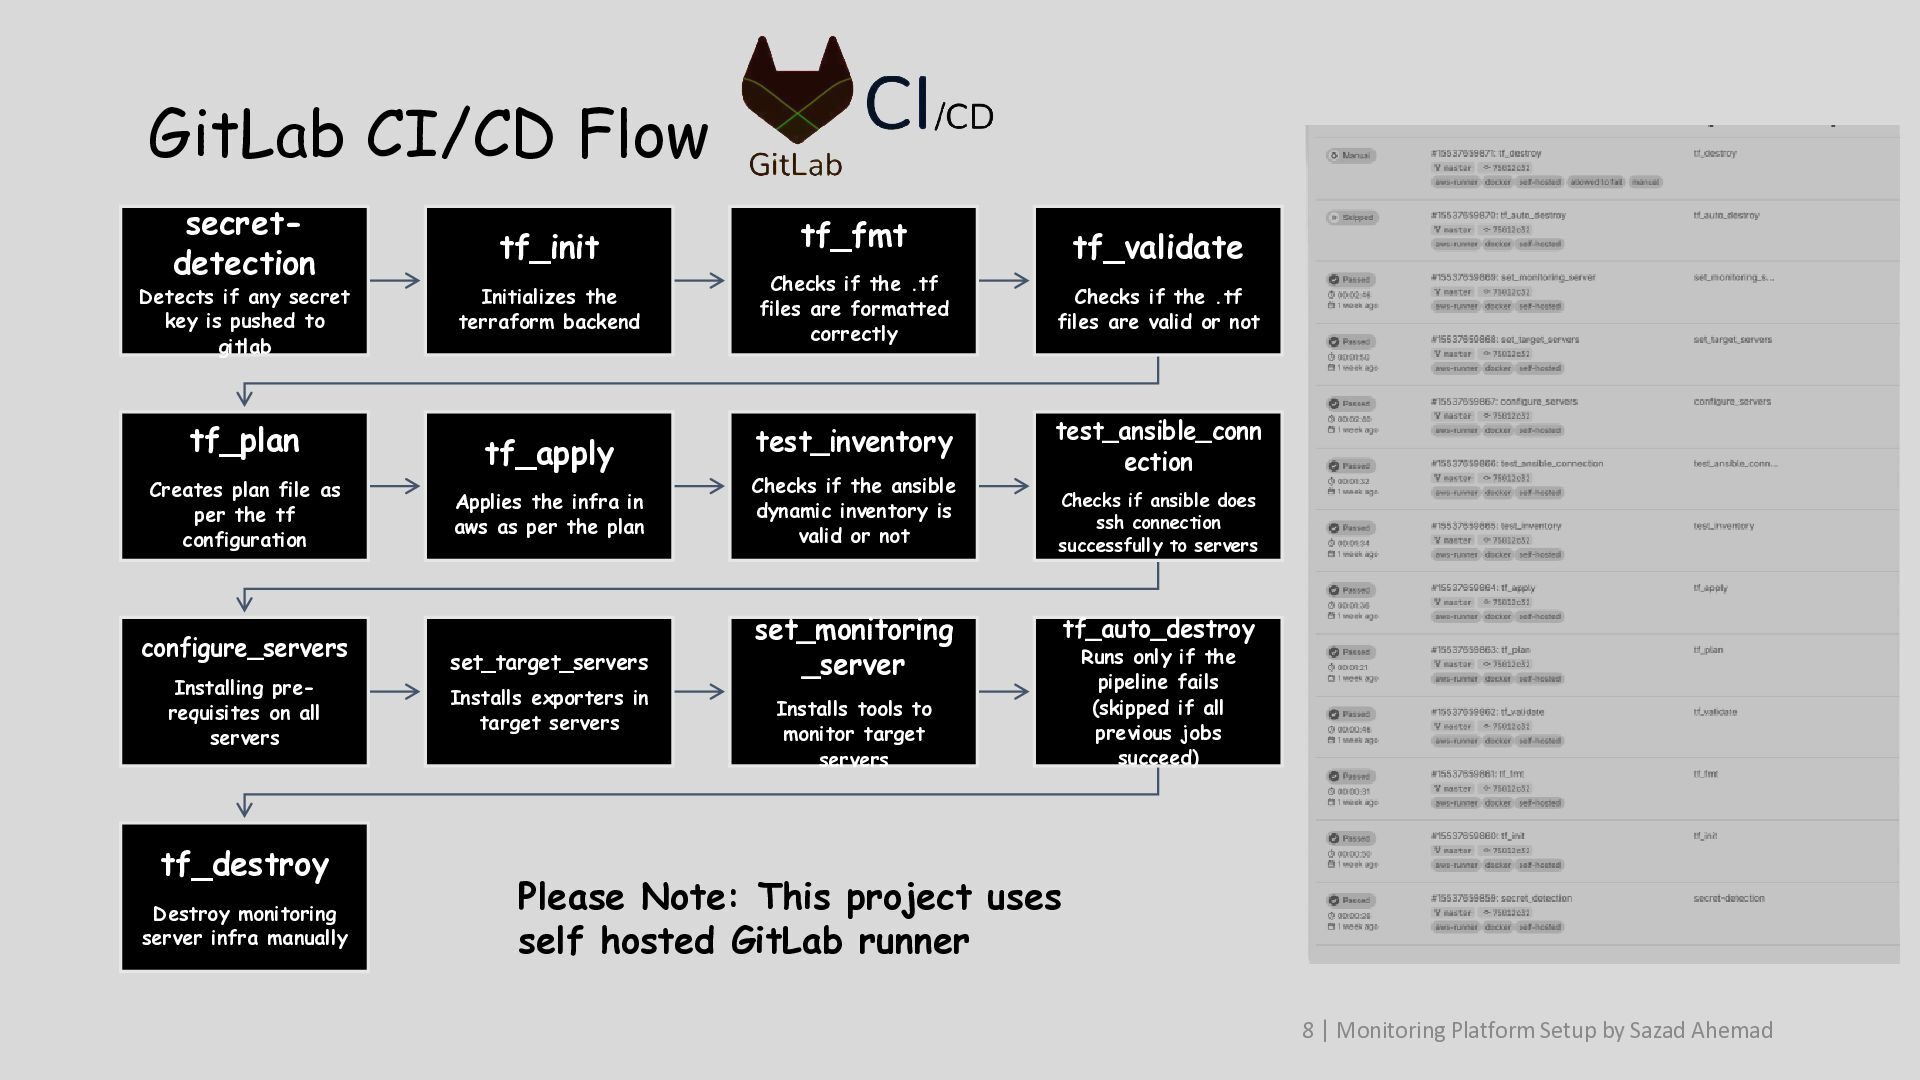
  7. GitLab CI/CD Flow secretdetection Detects if any secret key is

    pushed to gitlab tf_plan Creates plan file as per the tf configuration configure_servers Installing prerequisites on all servers tf_destroy Destroy monitoring server infra manually tf_init Initializes the terraform backend tf_apply tf_fmt Checks if the .tf files are formatted correctly Checks if the .tf files are valid or not test_inventory test_ansible_conn ection Applies the infra in aws as per the plan Checks if the ansible dynamic inventory is valid or not set_target_servers set_monitoring _server Installs exporters in target servers tf_validate Checks if ansible does ssh connection successfully to servers Installs tools to monitor target servers tf_auto_destroy Runs only if the pipeline fails (skipped if all previous jobs succeed) Please Note: This project uses self hosted GitLab runner 8 | Monitoring Platform Setup by Sazad Ahemad
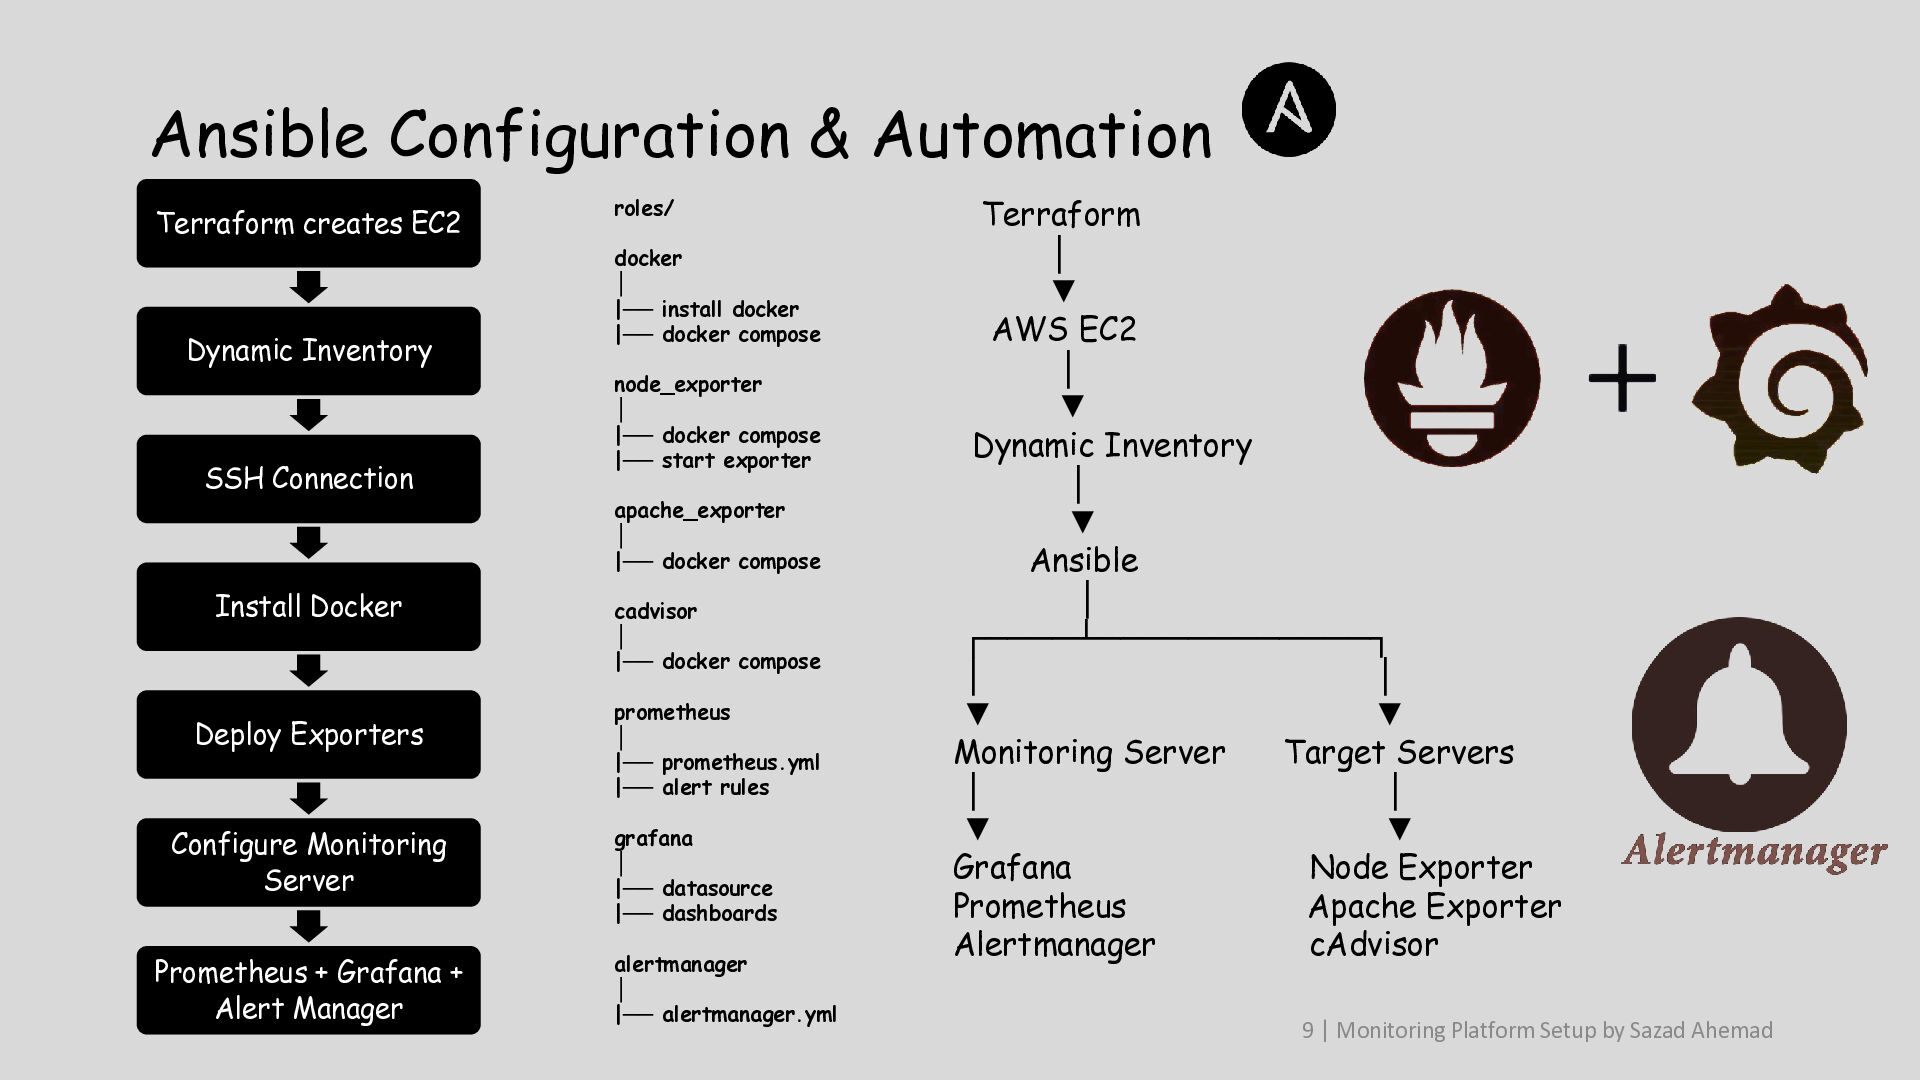
  8. Ansible Configuration & Automation Terraform creates EC2 Dynamic Inventory SSH

    Connection Install Docker Deploy Exporters Configure Monitoring Server Prometheus + Grafana + Alert Manager roles/ docker │ |── install docker |── docker compose node_exporter │ |── docker compose |── start exporter apache_exporter │ |── docker compose cadvisor │ |── docker compose prometheus │ |── prometheus.yml |── alert rules grafana │ |── datasource |── dashboards alertmanager │ |── alertmanager.yml Terraform │ ▼ AWS EC2 │ ▼ Dynamic Inventory │ ▼ Ansible │ ┌────┴────────────┐ │ │ ▼ ▼ Monitoring Server Target Servers │ │ ▼ ▼ Grafana Node Exporter Prometheus Apache Exporter Alertmanager cAdvisor 9 | Monitoring Platform Setup by Sazad Ahemad
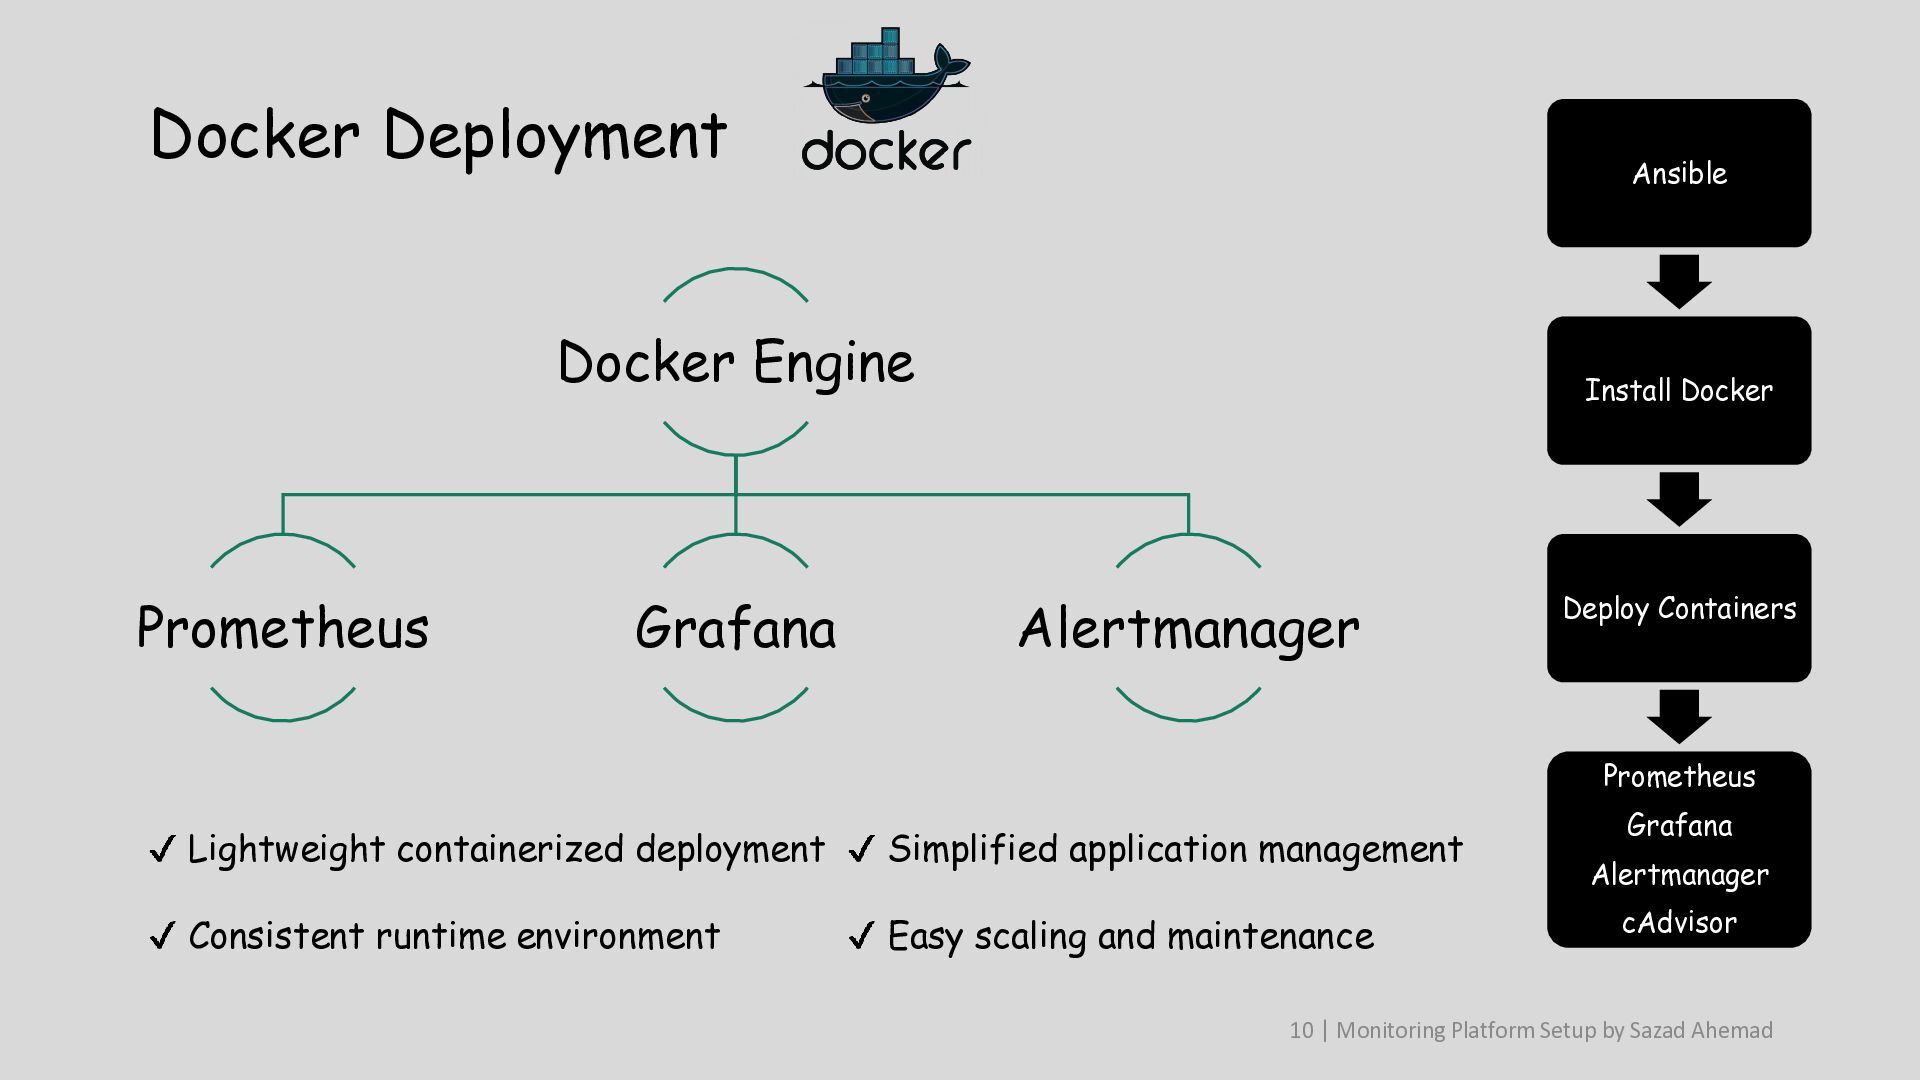
  9. Docker Deployment Ansible Docker Engine Prometheus Grafana Install Docker Alertmanager

    Deploy Containers Prometheus Lightweight containerized deployment Simplified application management Consistent runtime environment Easy scaling and maintenance Grafana Alertmanager cAdvisor 10 | Monitoring Platform Setup by Sazad Ahemad
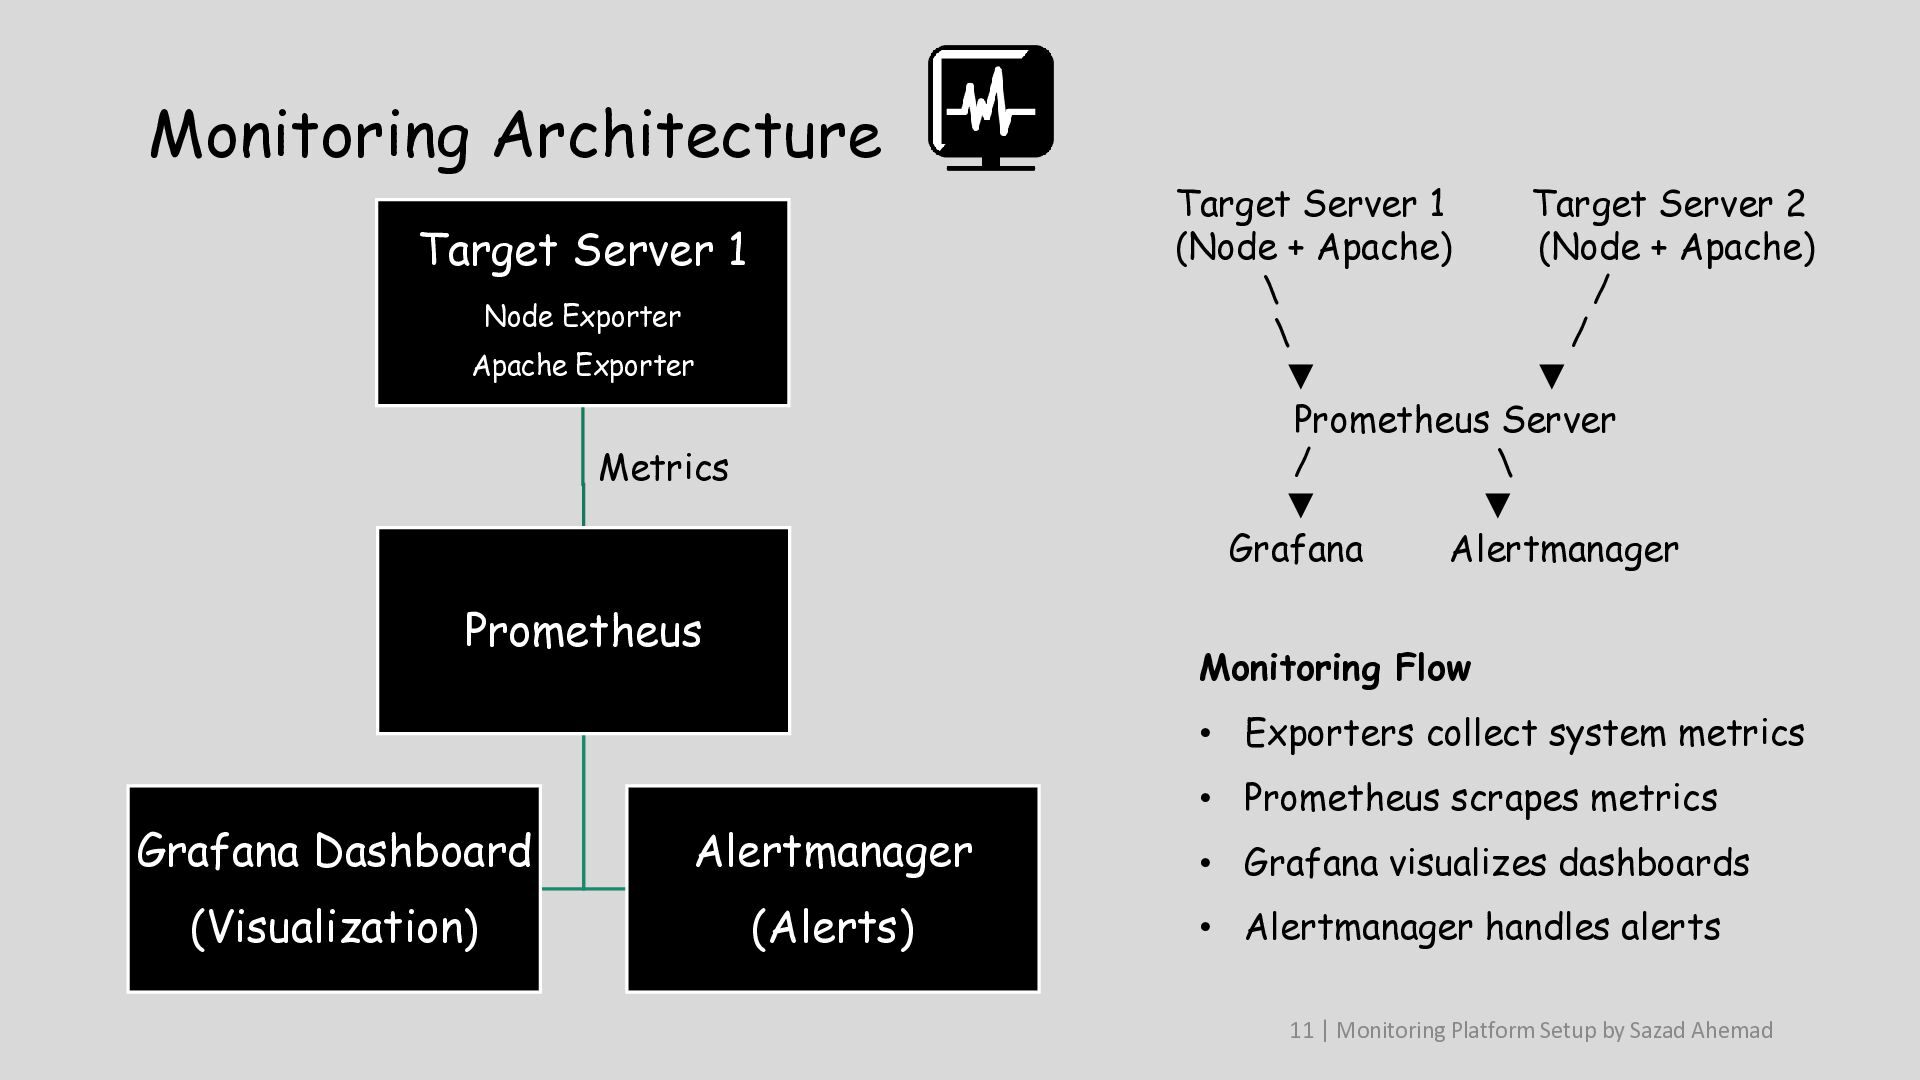
  10. Monitoring Architecture Target Server 1 Target Server 2 (Node +

    Apache) (Node + Apache) \ / \ / ▼ ▼ Prometheus Server / \ ▼ ▼ Grafana Alertmanager Target Server 1 Node Exporter Apache Exporter Metrics Prometheus Monitoring Flow • Exporters collect system metrics Grafana Dashboard Alertmanager (Visualization) (Alerts) • Prometheus scrapes metrics • Grafana visualizes dashboards • Alertmanager handles alerts 11 | Monitoring Platform Setup by Sazad Ahemad
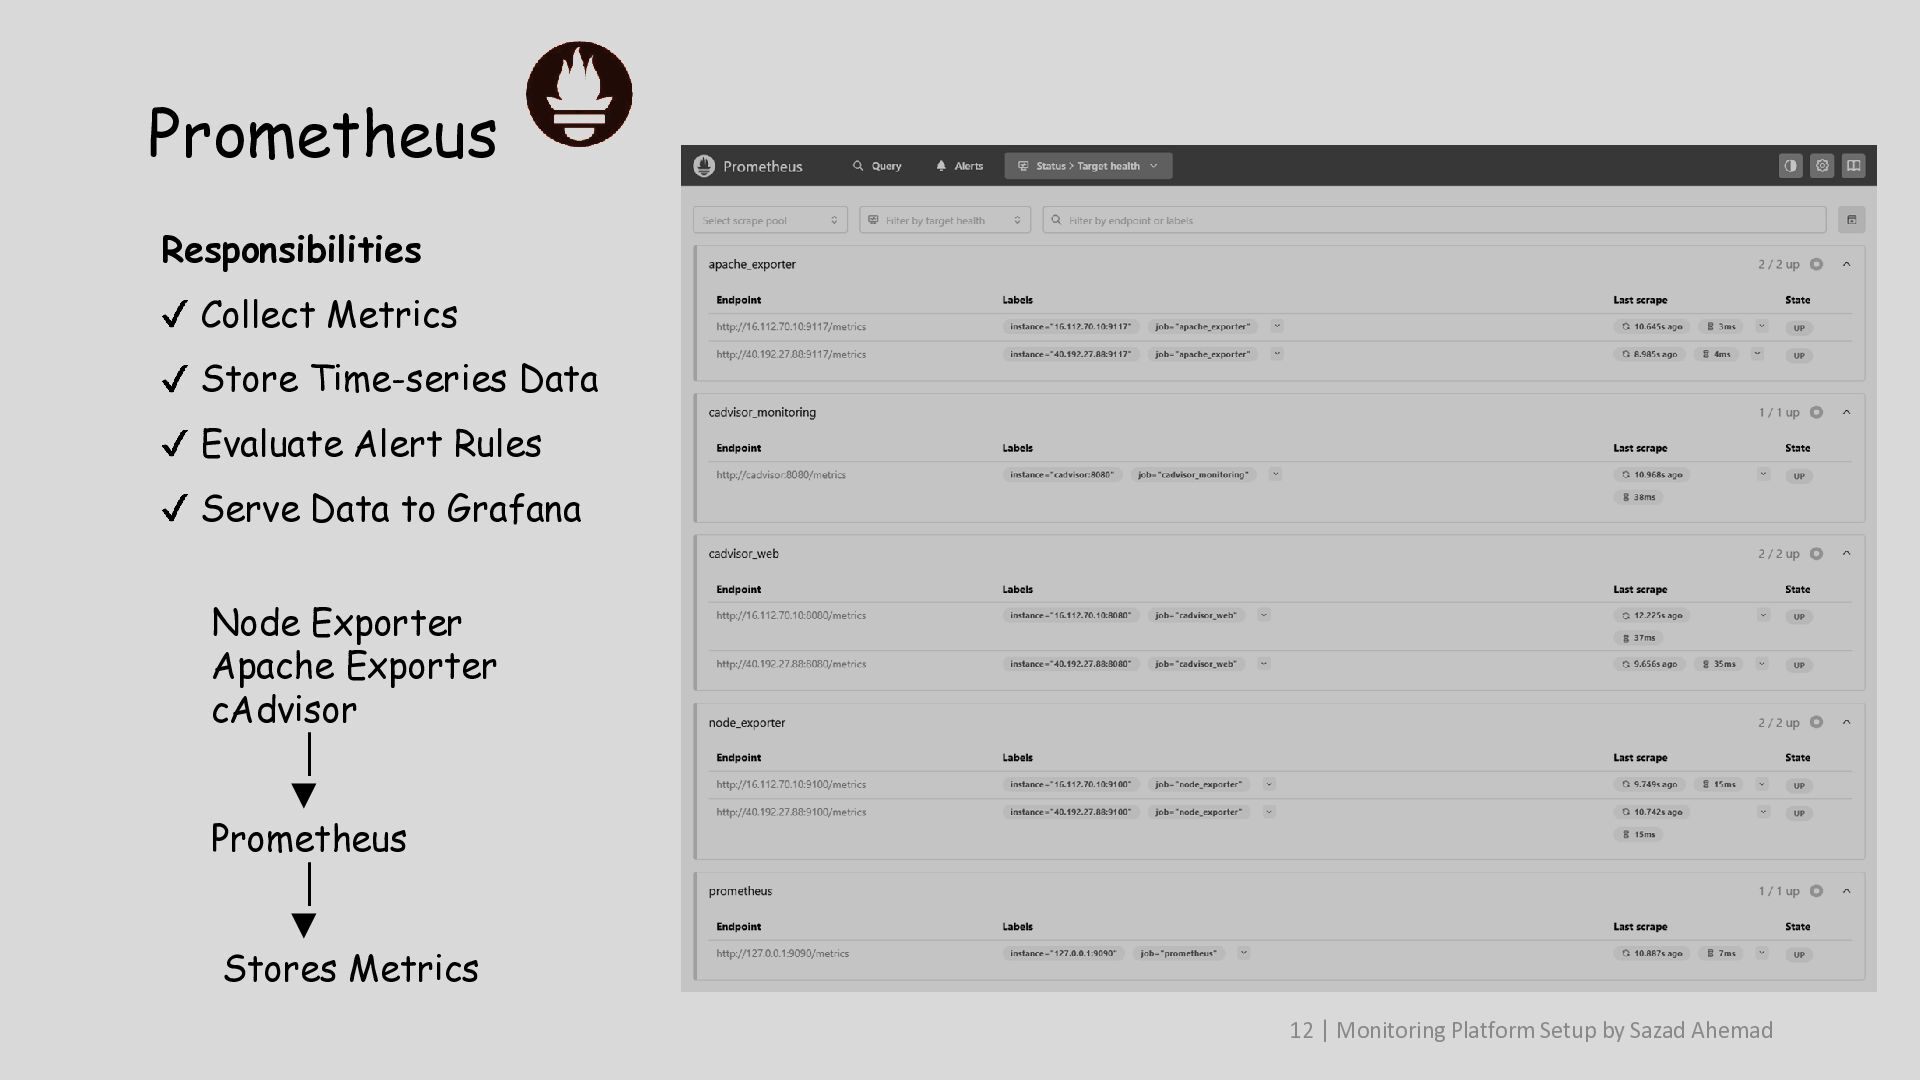
  11. Prometheus Responsibilities Collect Metrics Store Time-series Data Evaluate Alert Rules

    Serve Data to Grafana Node Exporter Apache Exporter cAdvisor │ ▼ Prometheus │ ▼ Stores Metrics 12 | Monitoring Platform Setup by Sazad Ahemad
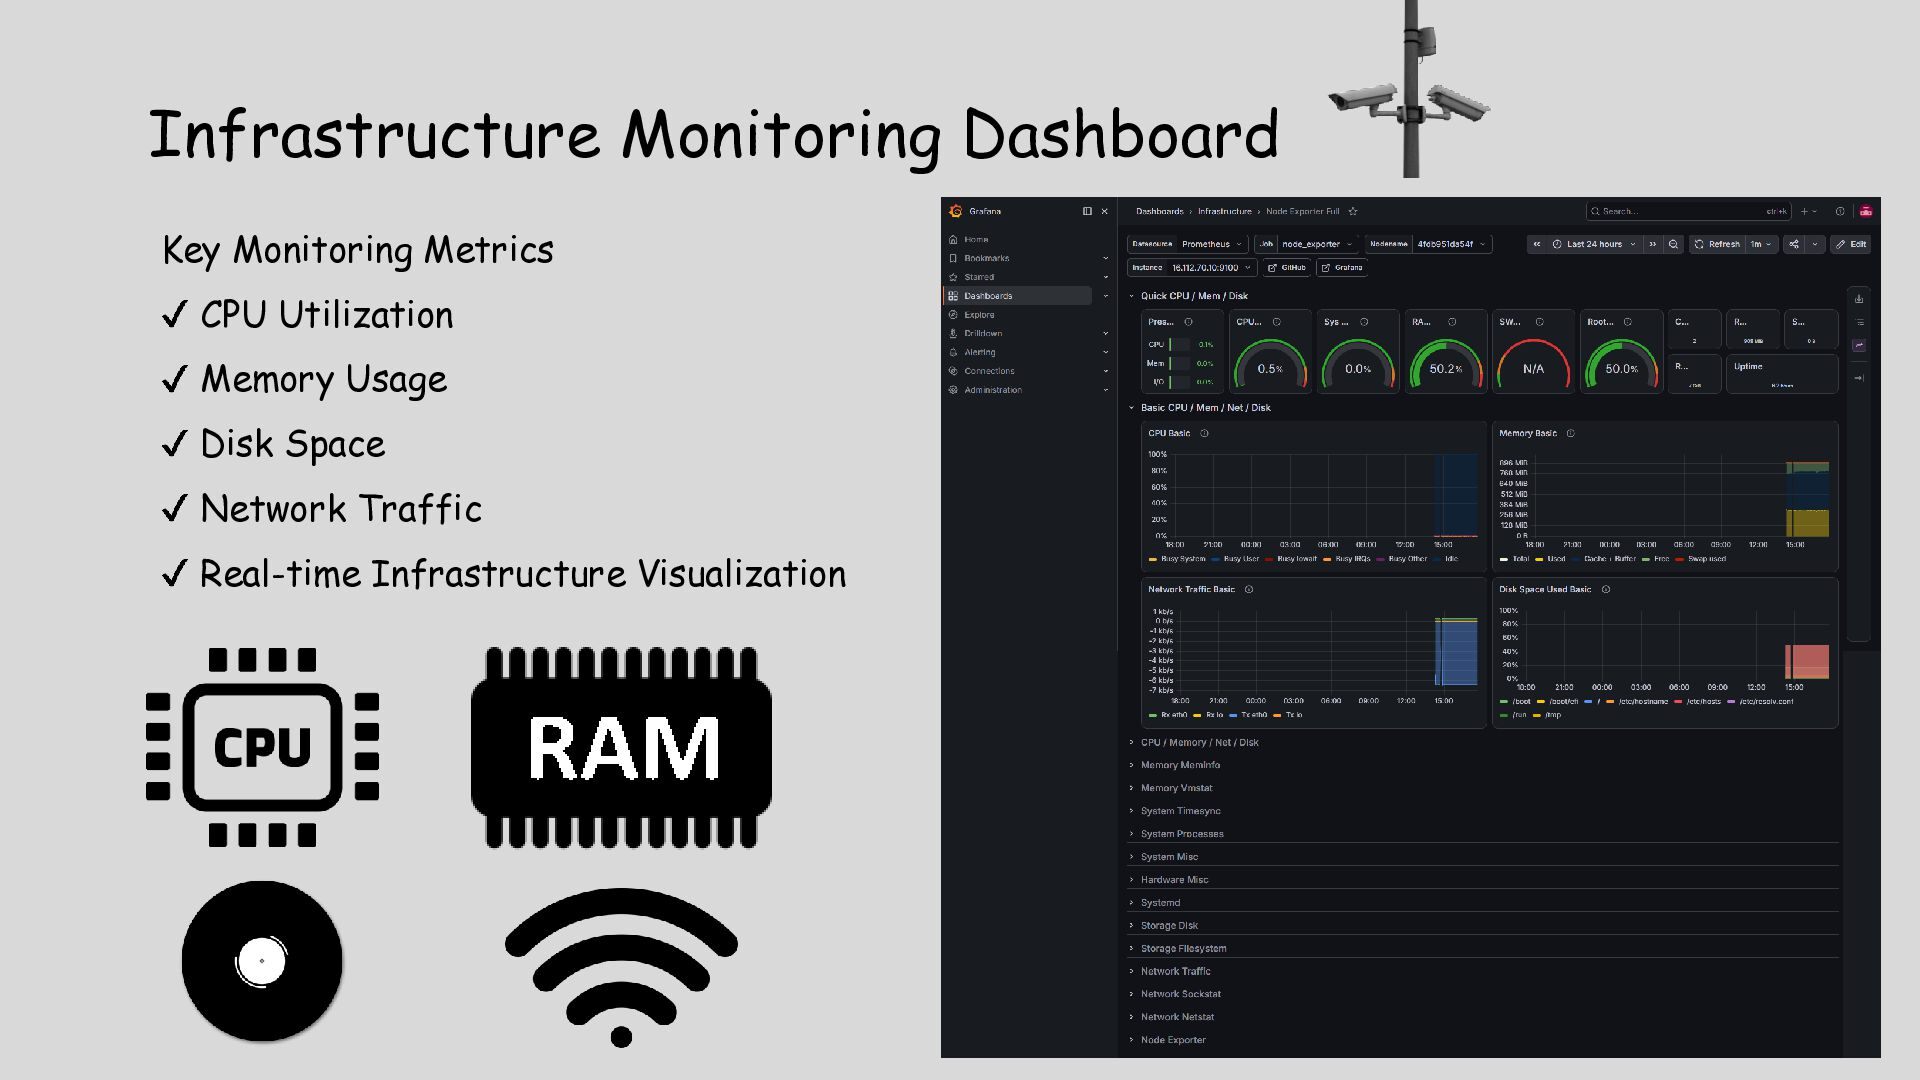
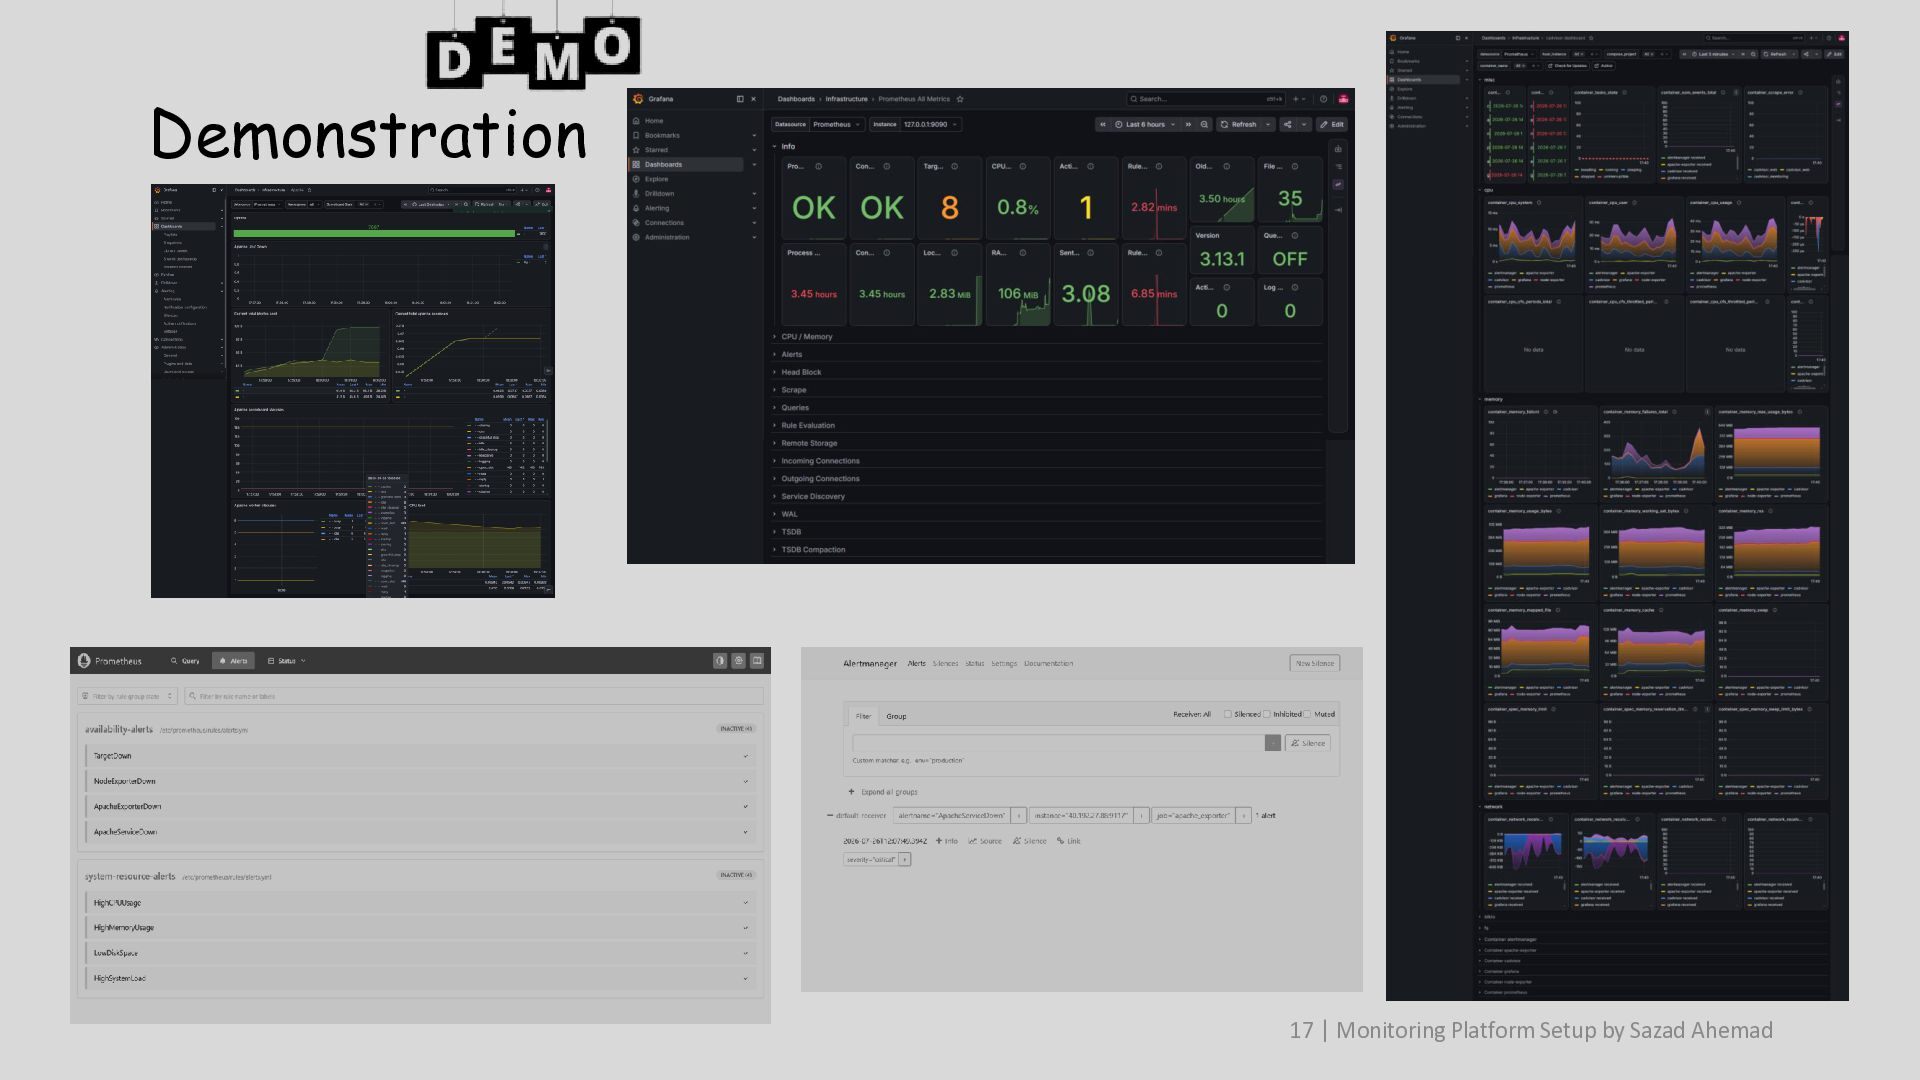
  12. Infrastructure Monitoring Dashboard Key Monitoring Metrics CPU Utilization Memory Usage

    Disk Space Network Traffic Real-time Infrastructure Visualization 13 | Monitoring Platform Setup by Sazad Ahemad
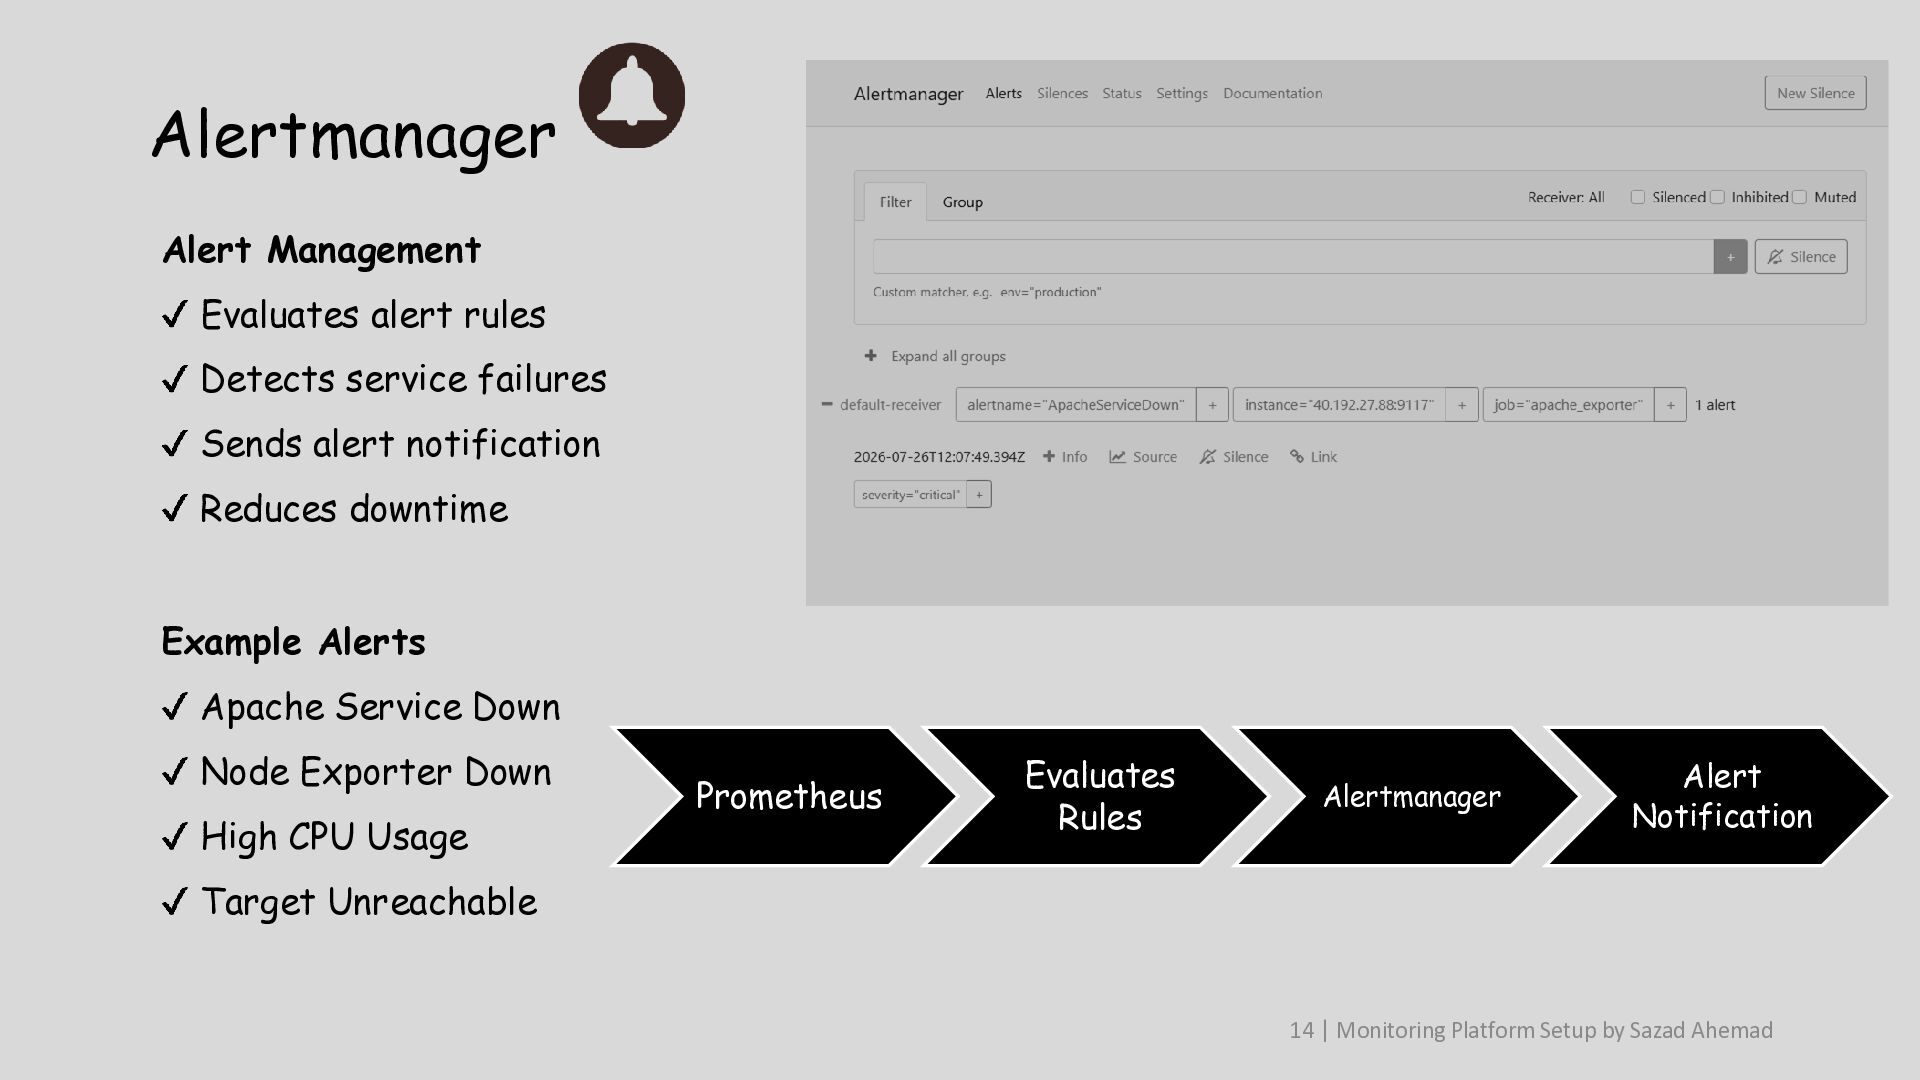
  13. Alertmanager Alert Management Evaluates alert rules Detects service failures Sends

    alert notification Reduces downtime Example Alerts Apache Service Down Node Exporter Down High CPU Usage Prometheus Evaluates Rules Alertmanager Alert Notification Target Unreachable 14 | Monitoring Platform Setup by Sazad Ahemad
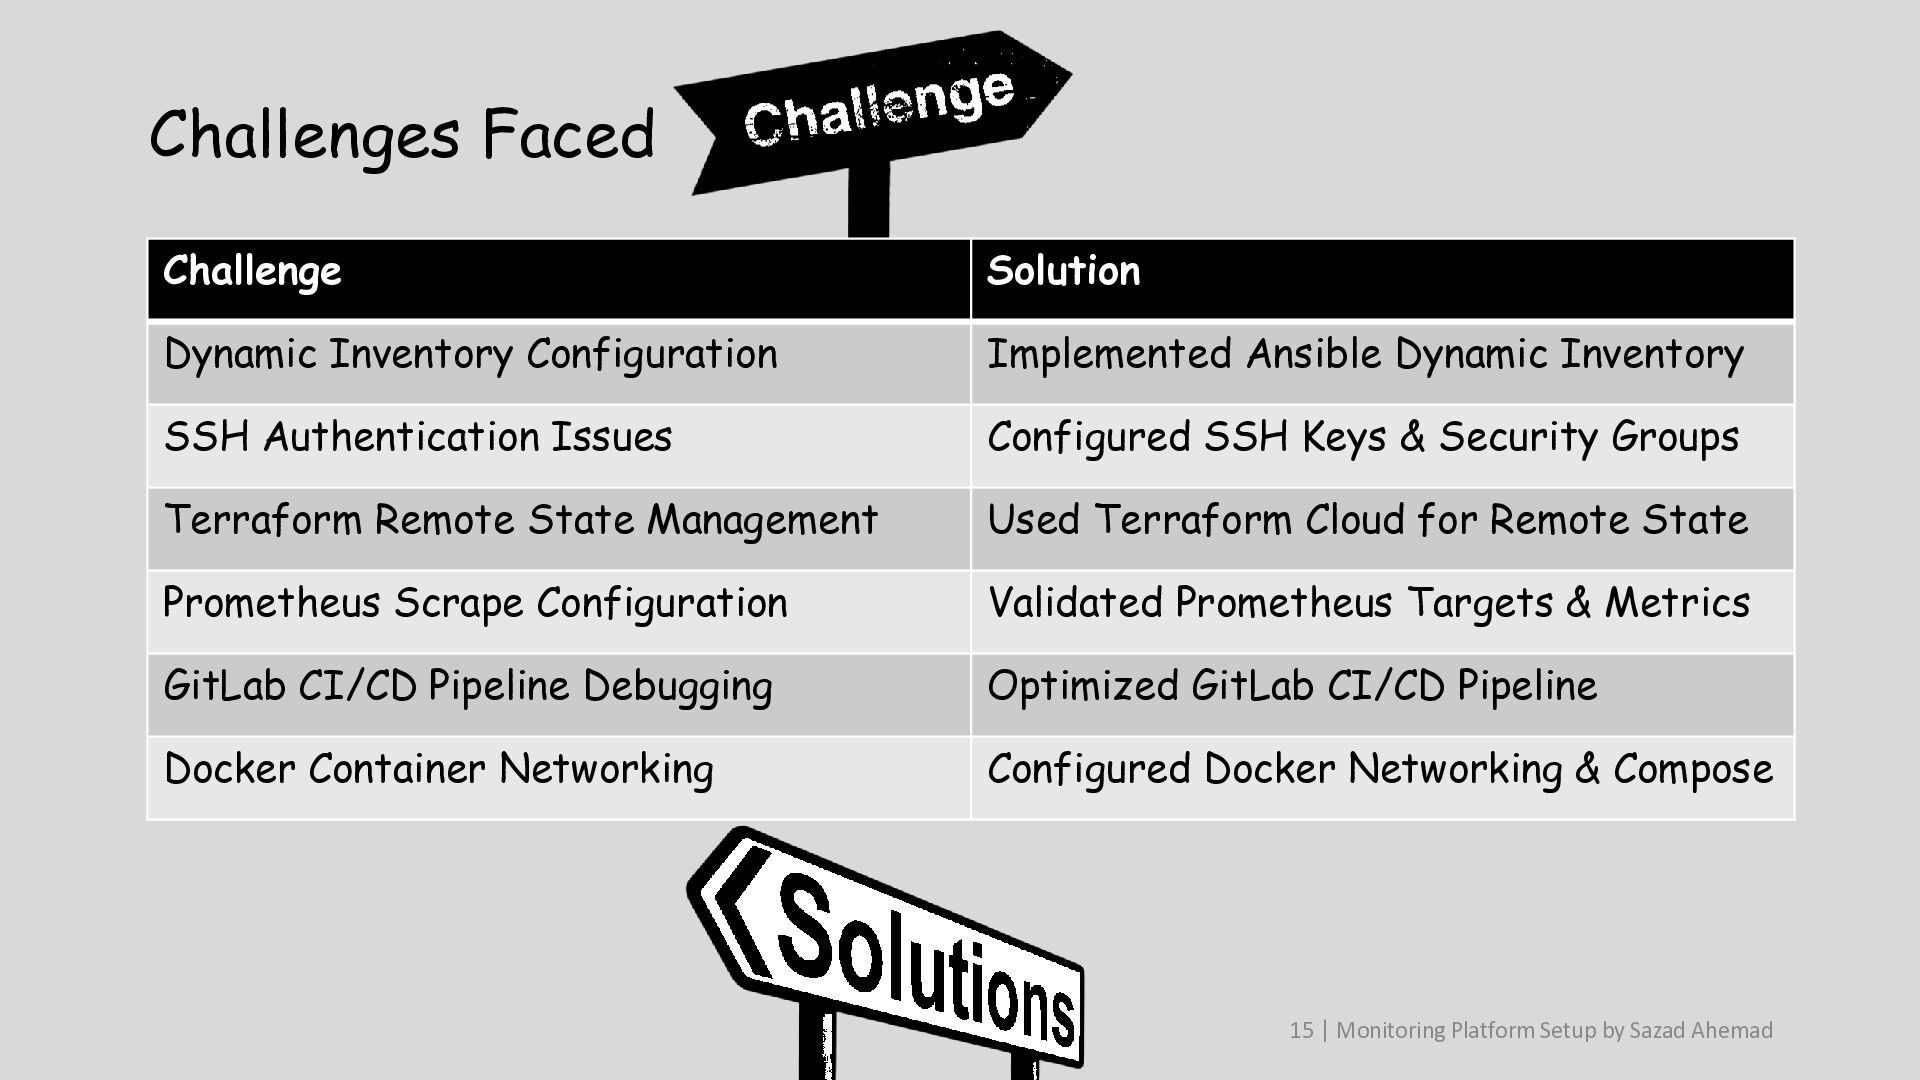
  14. Challenges Faced Challenge Solution Dynamic Inventory Configuration Implemented Ansible Dynamic

    Inventory SSH Authentication Issues Configured SSH Keys & Security Groups Terraform Remote State Management Used Terraform Cloud for Remote State Prometheus Scrape Configuration Validated Prometheus Targets & Metrics GitLab CI/CD Pipeline Debugging Optimized GitLab CI/CD Pipeline Docker Container Networking Configured Docker Networking & Compose 15 | Monitoring Platform Setup by Sazad Ahemad
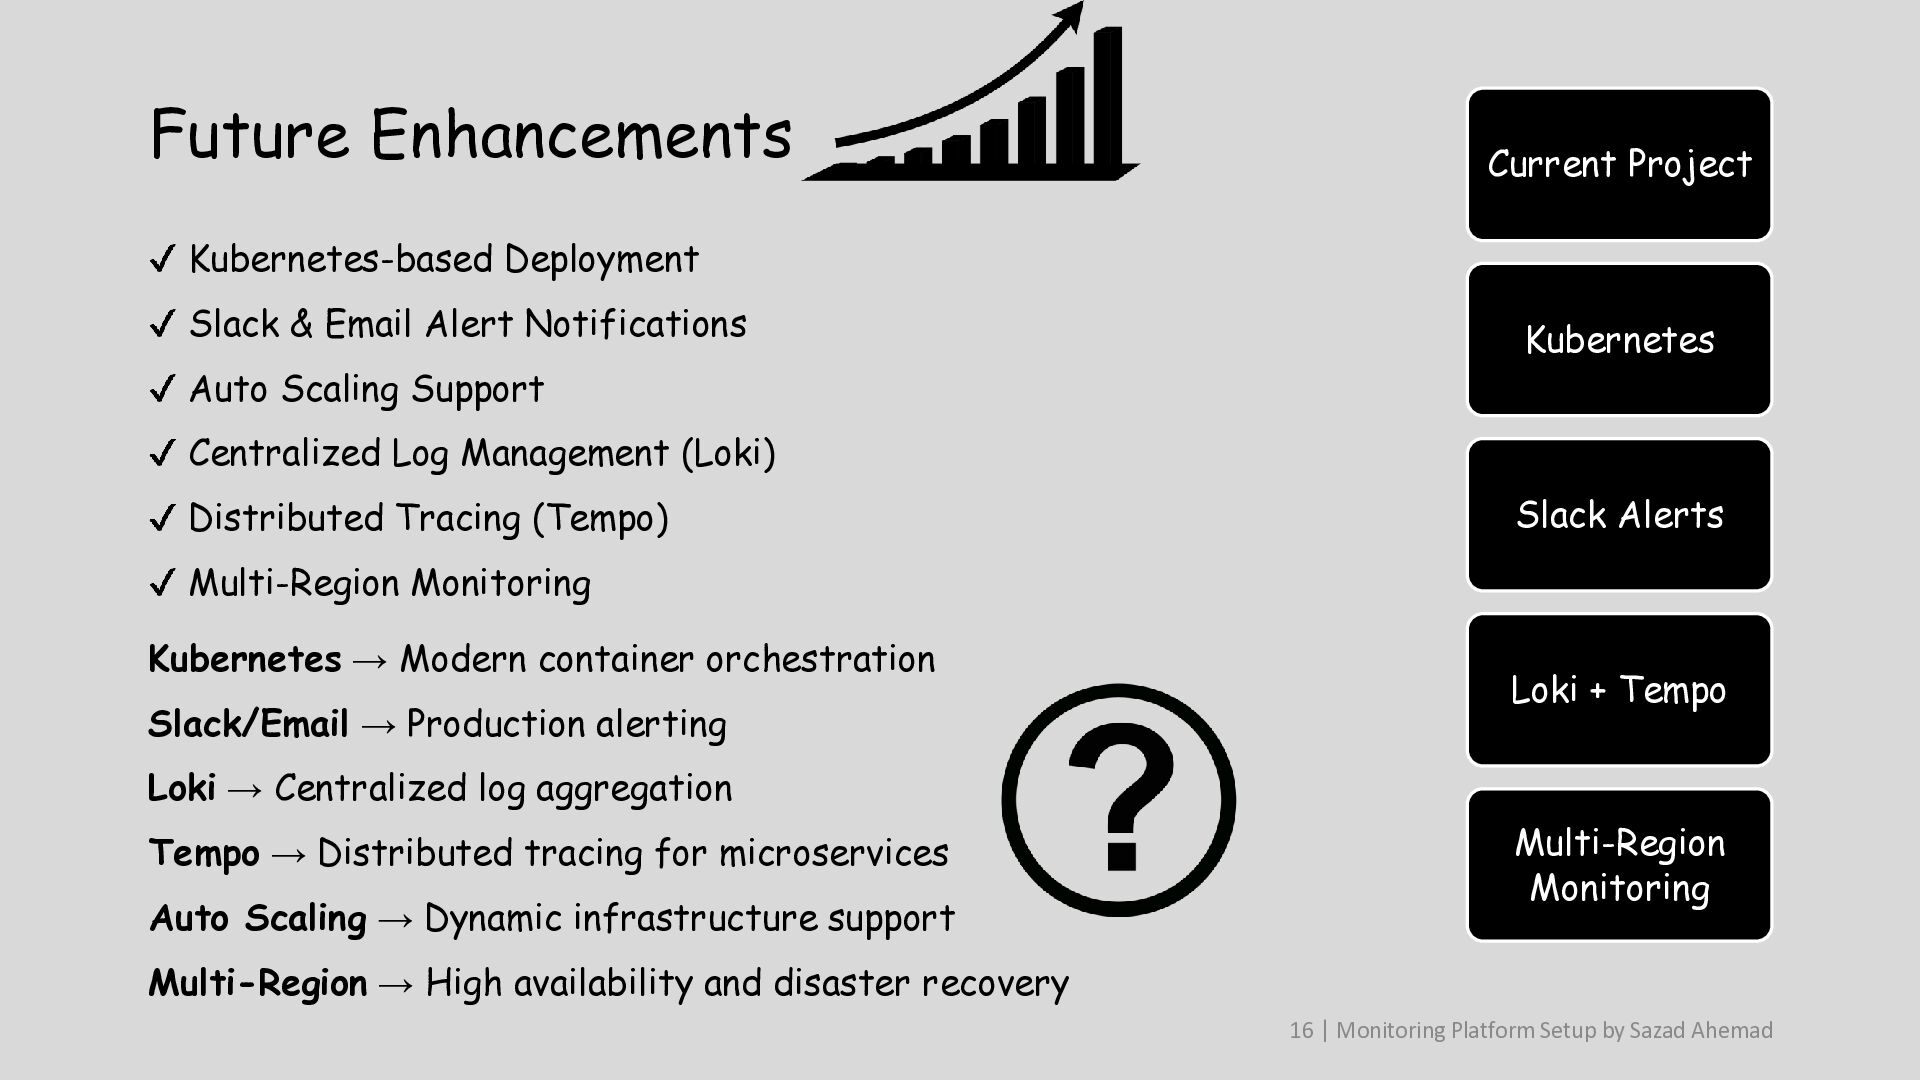
  15. Future Enhancements Current Project Kubernetes-based Deployment Slack & Email Alert

    Notifications Auto Scaling Support Kubernetes Centralized Log Management (Loki) Distributed Tracing (Tempo) Slack Alerts Multi-Region Monitoring Kubernetes → Modern container orchestration Slack/Email → Production alerting Loki + Tempo Loki → Centralized log aggregation Tempo → Distributed tracing for microservices Auto Scaling → Dynamic infrastructure support Multi-Region Monitoring Multi-Region → High availability and disaster recovery 16 | Monitoring Platform Setup by Sazad Ahemad