Upgrade to Pro — share decks privately, control downloads, hide ads and more …

Validation through variation

Avatar for Cory Jog Cory Jog
September 17, 2015

Validation through variation

Using patter of production to validate pre-construction predictions

Avatar for Cory Jog

Cory Jog

September 17, 2015

More Decks by Cory Jog

Other Decks in Technology

Transcript

  1. VALIDATION THROUGH VARIATION: Using Pattern of Production to Validate Wind

    Flow, Wakes, and Uncertainty 17 September 2015 Cory Sieg AWEA Resource Assessment Workshop, New Orleans
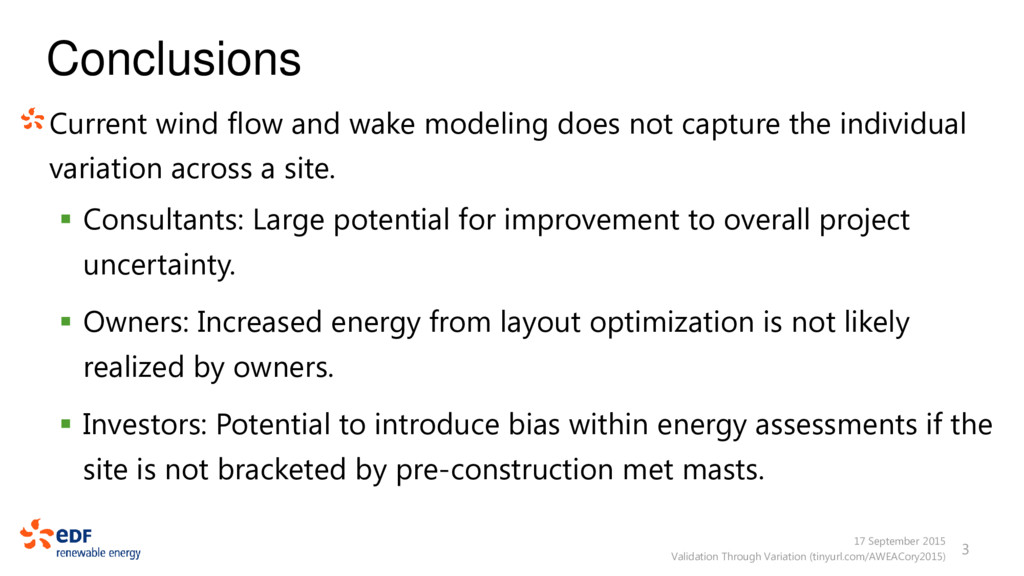
  2. Conclusions 17 September 2015 Validation Through Variation (tinyurl.com/AWEACory2015) 3 Current

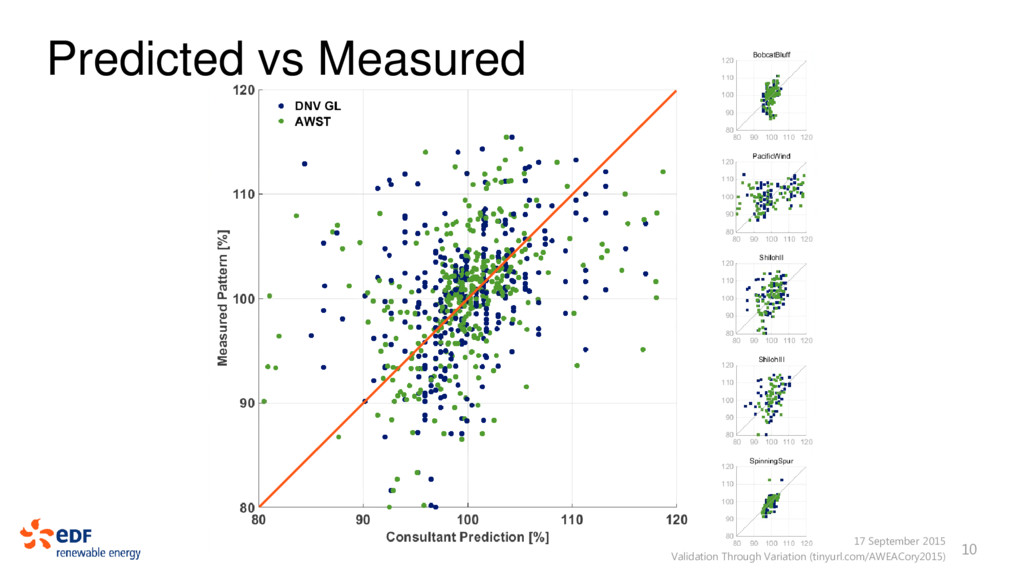
    wind flow and wake modeling does not capture the individual variation across a site.  Consultants: Large potential for improvement to overall project uncertainty.  Owners: Increased energy from layout optimization is not likely realized by owners.  Investors: Potential to introduce bias within energy assessments if the site is not bracketed by pre-construction met masts.
  3. 17 September 2015 Validation Through Variation (tinyurl.com/AWEACory2015) 5 Pattern of

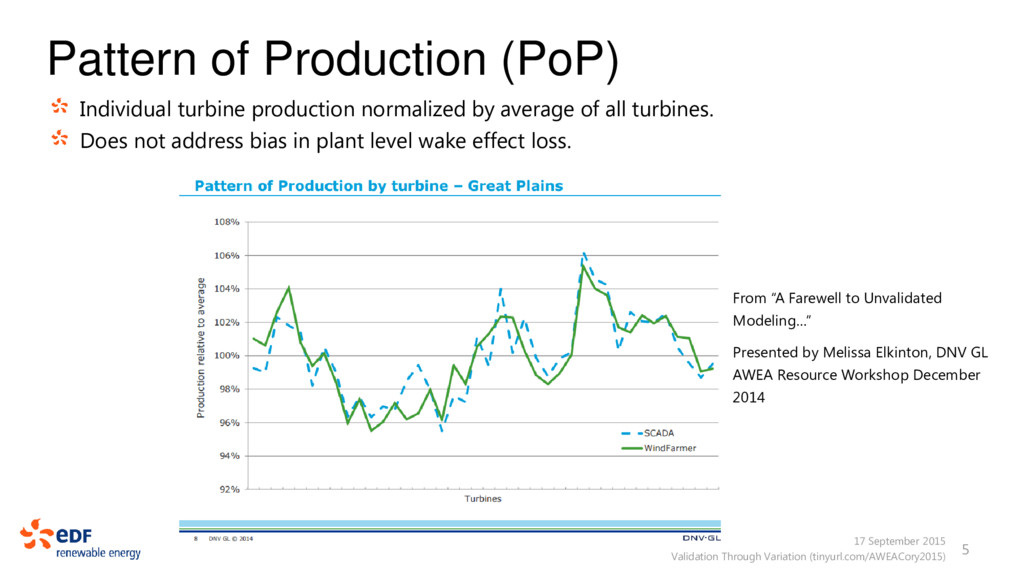
    Production (PoP) Individual turbine production normalized by average of all turbines. Does not address bias in plant level wake effect loss. From “A Farewell to Unvalidated Modeling…” Presented by Melissa Elkinton, DNV GL AWEA Resource Workshop December 2014
  4. 17 September 2015 Validation Through Variation (tinyurl.com/AWEACory2015) 6 Pattern of

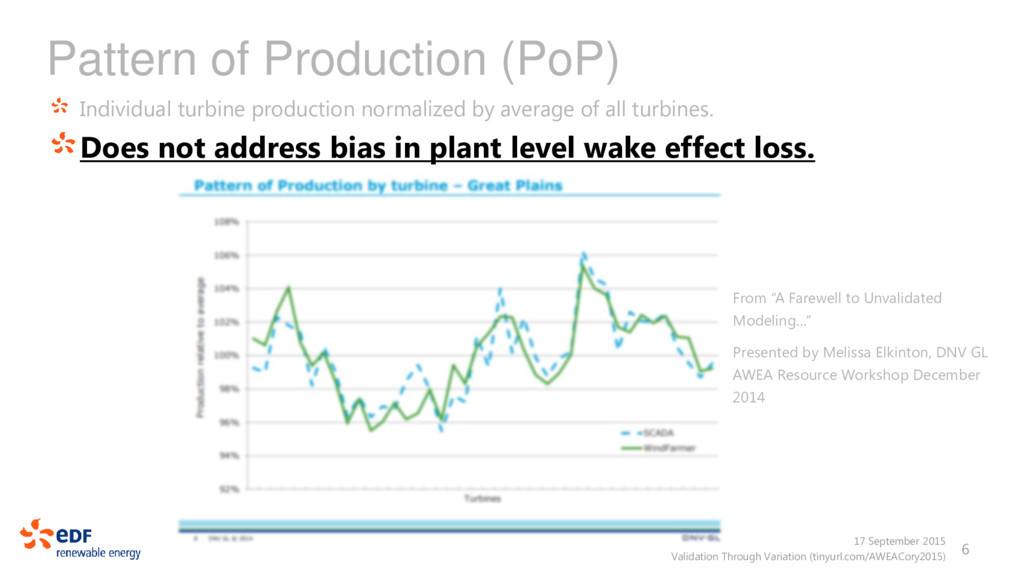
    Production (PoP) Individual turbine production normalized by average of all turbines. Does not address bias in plant level wake effect loss. From “A Farewell to Unvalidated Modeling…” Presented by Melissa Elkinton, DNV GL AWEA Resource Workshop December 2014
  5. 17 September 2015 Validation Through Variation (tinyurl.com/AWEACory2015) 7 PoP with

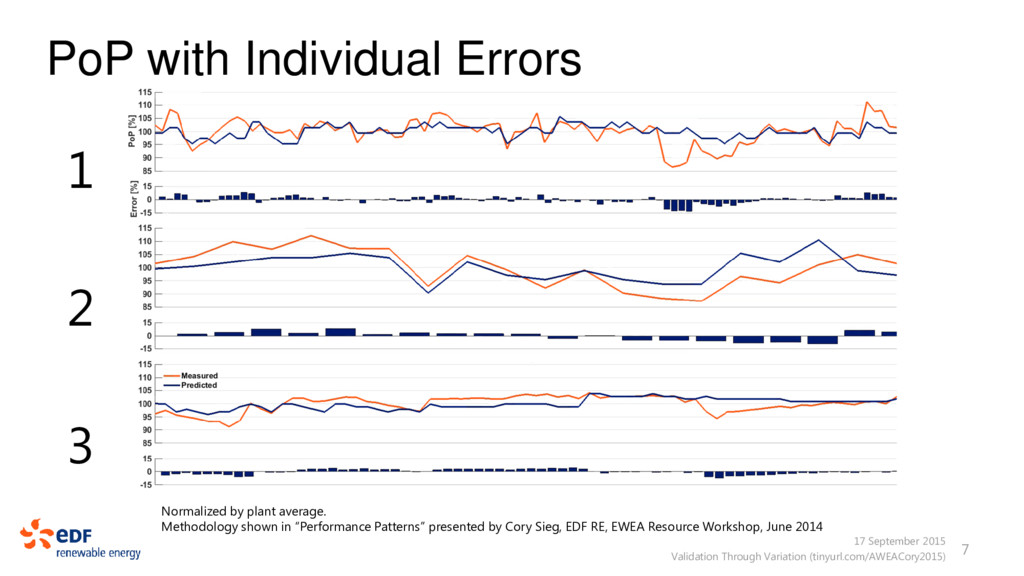
    Individual Errors Normalized by plant average. Methodology shown in “Performance Patterns” presented by Cory Sieg, EDF RE, EWEA Resource Workshop, June 2014 1 2 3
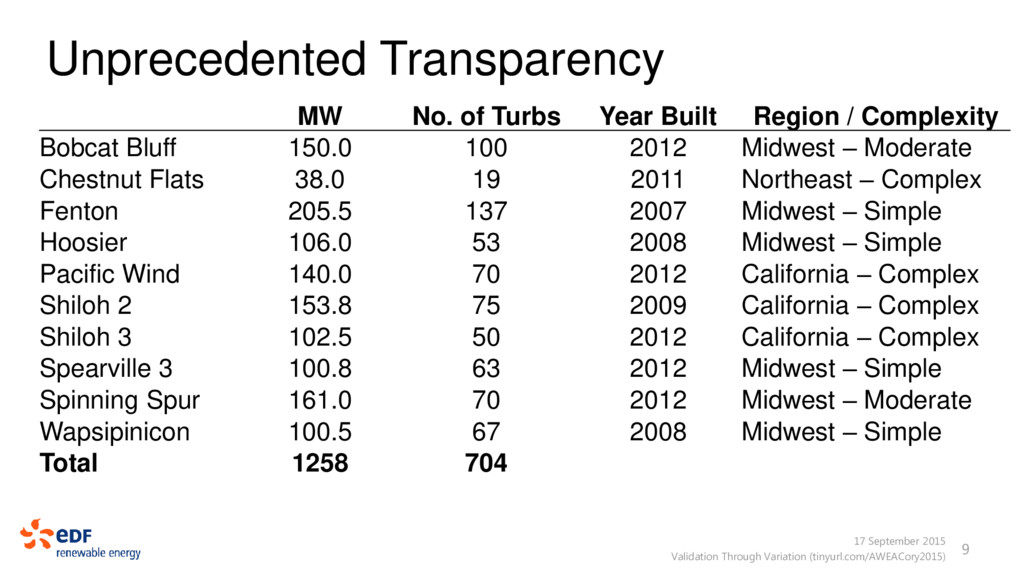
  6. Data 17 September 2015 Validation Through Variation (tinyurl.com/AWEACory2015) 8 Wind

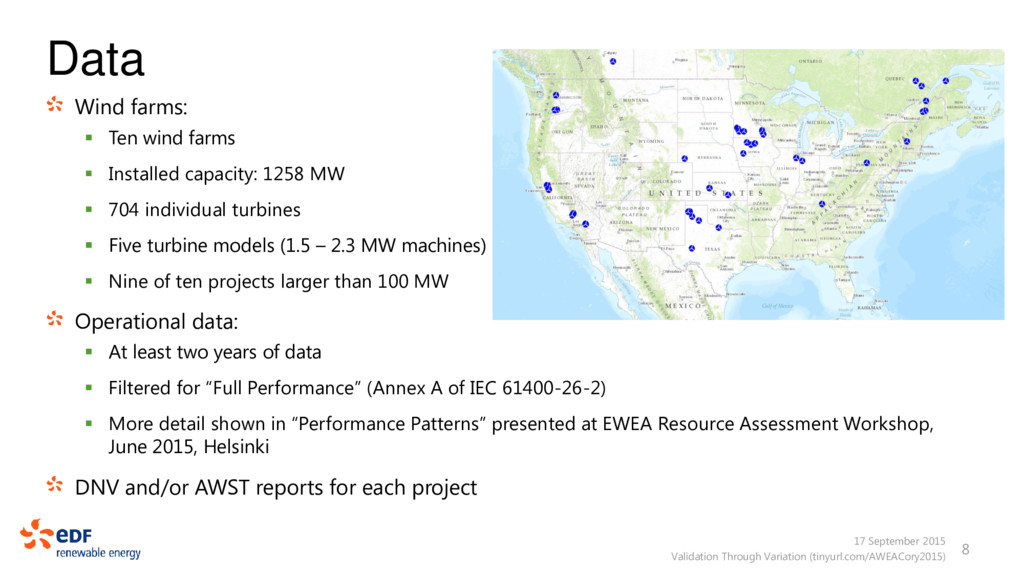
    farms:  Ten wind farms  Installed capacity: 1258 MW  704 individual turbines  Five turbine models (1.5 – 2.3 MW machines)  Nine of ten projects larger than 100 MW Operational data:  At least two years of data  Filtered for “Full Performance” (Annex A of IEC 61400-26-2)  More detail shown in “Performance Patterns” presented at EWEA Resource Assessment Workshop, June 2015, Helsinki DNV and/or AWST reports for each project
  7. Unprecedented Transparency 17 September 2015 Validation Through Variation (tinyurl.com/AWEACory2015) 9

    MW No. of Turbs Year Built Region / Complexity Bobcat Bluff 150.0 100 2012 Midwest – Moderate Chestnut Flats 38.0 19 2011 Northeast – Complex Fenton 205.5 137 2007 Midwest – Simple Hoosier 106.0 53 2008 Midwest – Simple Pacific Wind 140.0 70 2012 California – Complex Shiloh 2 153.8 75 2009 California – Complex Shiloh 3 102.5 50 2012 California – Complex Spearville 3 100.8 63 2012 Midwest – Simple Spinning Spur 161.0 70 2012 Midwest – Moderate Wapsipinicon 100.5 67 2008 Midwest – Simple Total 1258 704
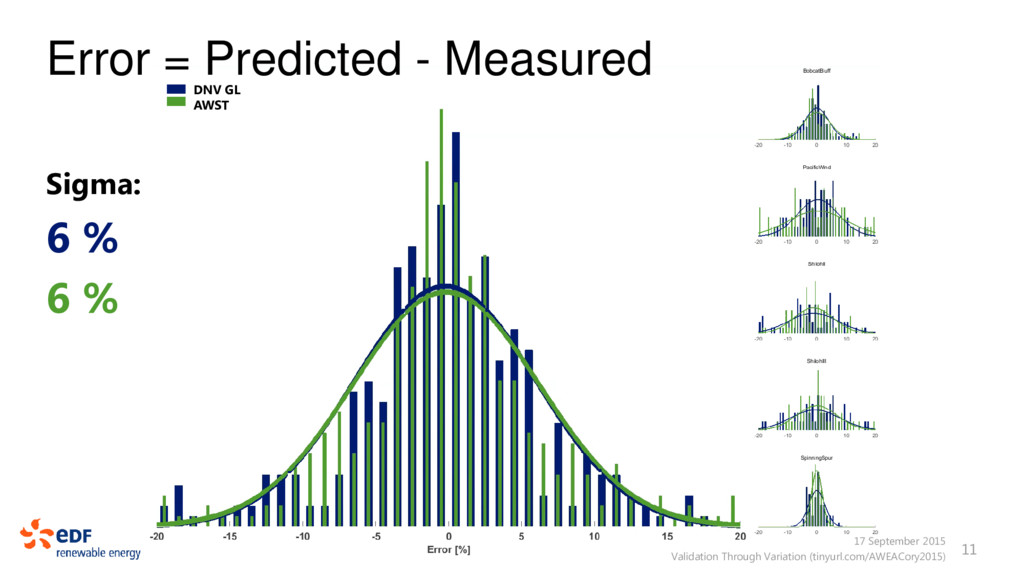
  8. Sigma: 6 % 6 % 17 September 2015 Validation Through

    Variation (tinyurl.com/AWEACory2015) 11 Error = Predicted - Measured DNV GL AWST
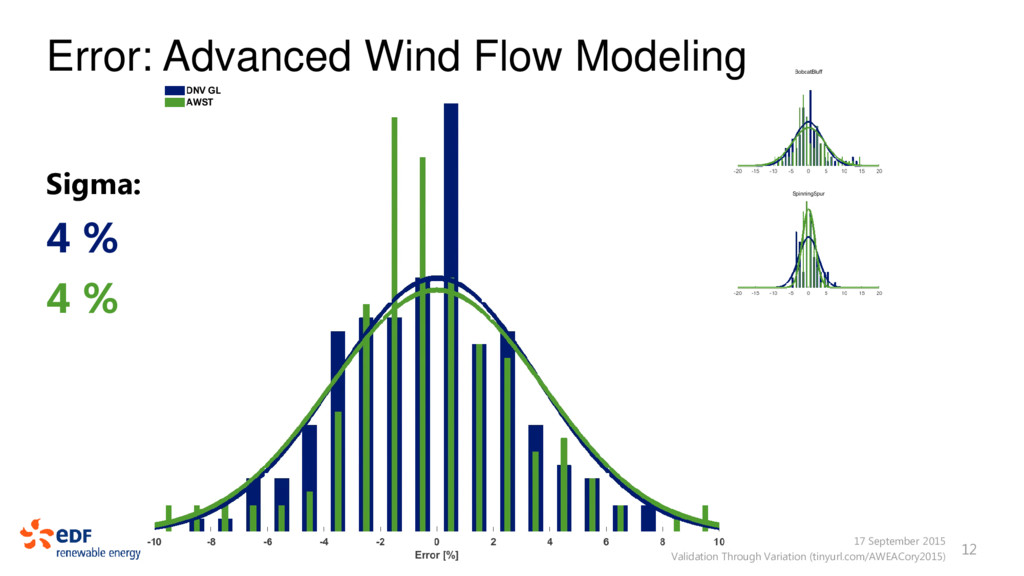
  9. Sigma: 4 % 4 % 17 September 2015 Validation Through

    Variation (tinyurl.com/AWEACory2015) 12 Error: Advanced Wind Flow Modeling
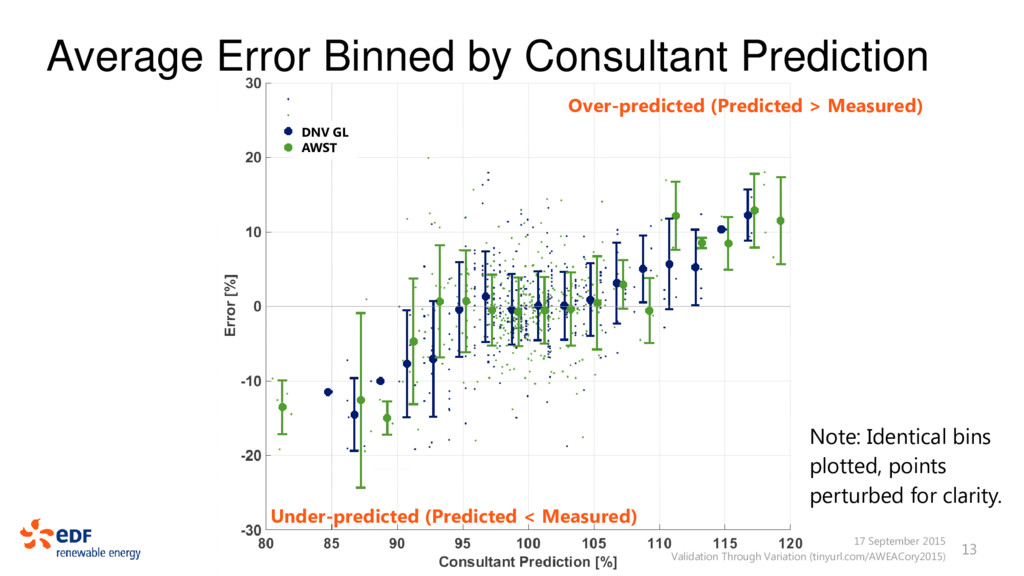
  10. Note: Identical bins plotted, points perturbed for clarity. 17 September

    2015 Validation Through Variation (tinyurl.com/AWEACory2015) 13 Average Error Binned by Consultant Prediction DNV GL AWST Under-predicted (Predicted < Measured) Over-predicted (Predicted > Measured)
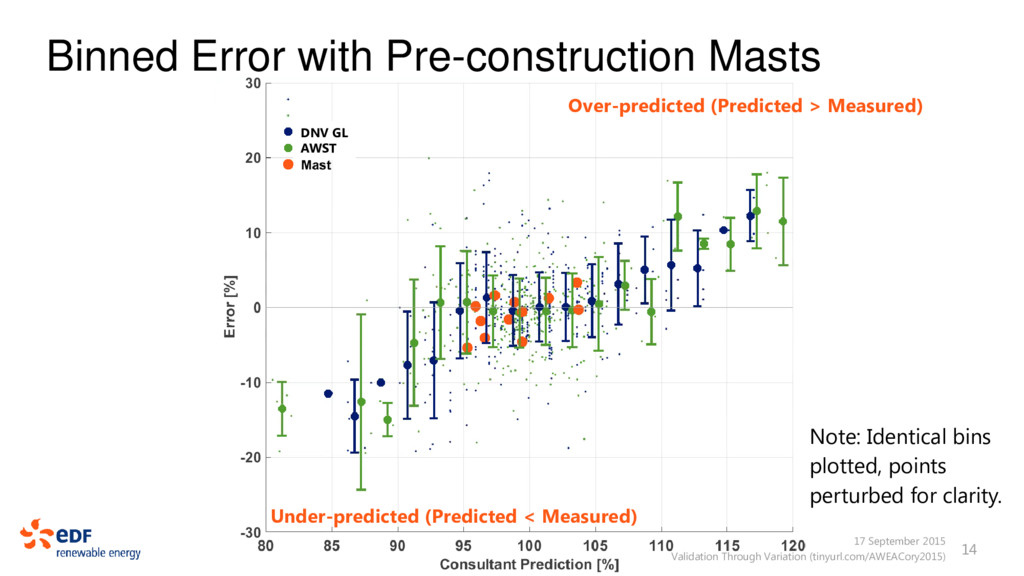
  11. Note: Identical bins plotted, points perturbed for clarity. 17 September

    2015 Validation Through Variation (tinyurl.com/AWEACory2015) 14 Binned Error with Pre-construction Masts DNV GL AWST Under-predicted (Predicted < Measured) Over-predicted (Predicted > Measured)
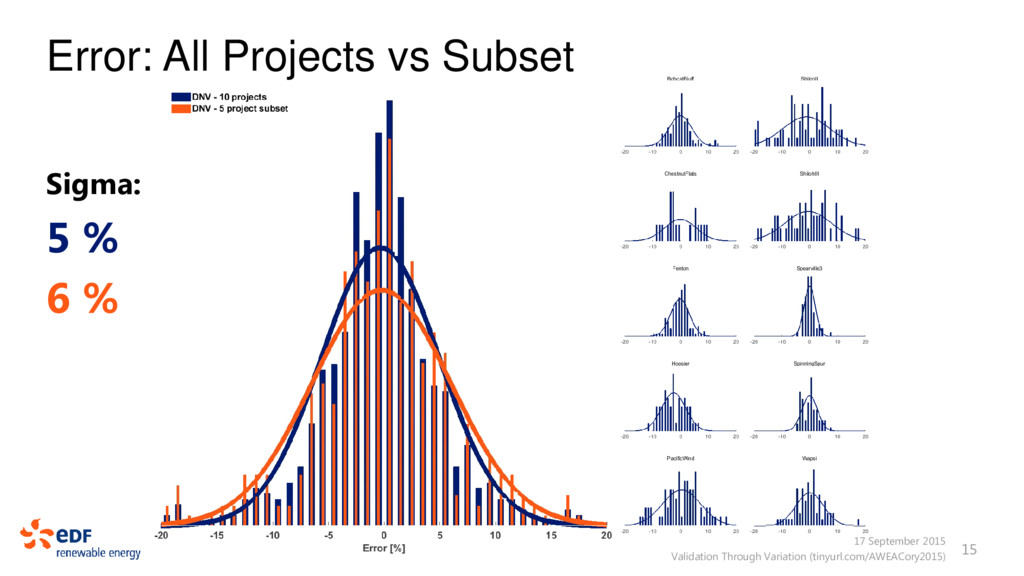
  12. Sigma: 5 % 6 % 17 September 2015 Validation Through

    Variation (tinyurl.com/AWEACory2015) 15 Error: All Projects vs Subset
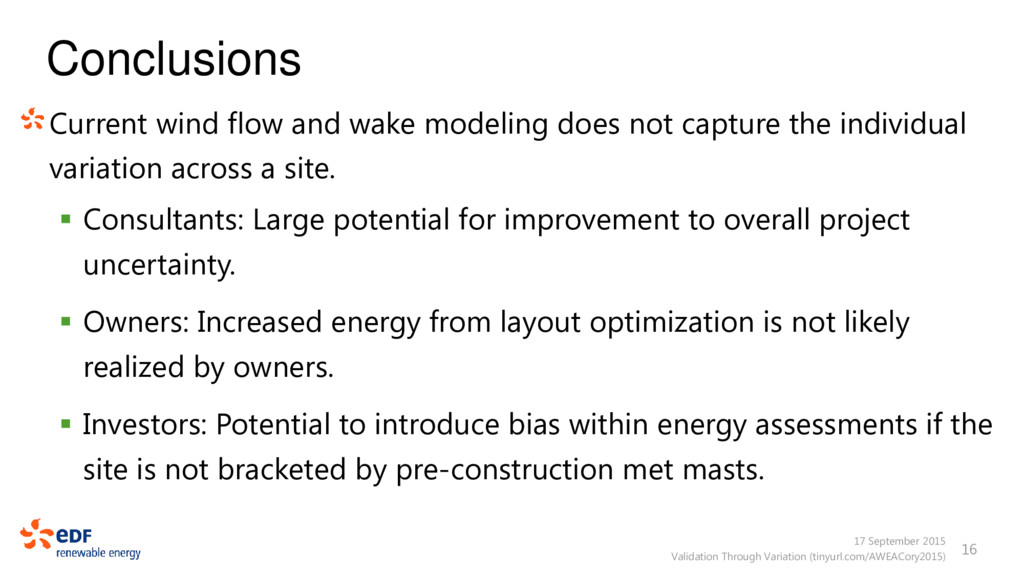
  13. Conclusions 17 September 2015 Validation Through Variation (tinyurl.com/AWEACory2015) 16 Current

    wind flow and wake modeling does not capture the individual variation across a site.  Consultants: Large potential for improvement to overall project uncertainty.  Owners: Increased energy from layout optimization is not likely realized by owners.  Investors: Potential to introduce bias within energy assessments if the site is not bracketed by pre-construction met masts.
  14. Many Thanks Thanks to:  Erik Hale, EDF Renewable Energy

     Brad Johnson, EDF Renewable Energy  Benjamin Kandel, PhD, EDF Renewable Energy  AWST and DNV GL For questions or comments please contact: Cory Sieg [email protected] www.edf-re.com