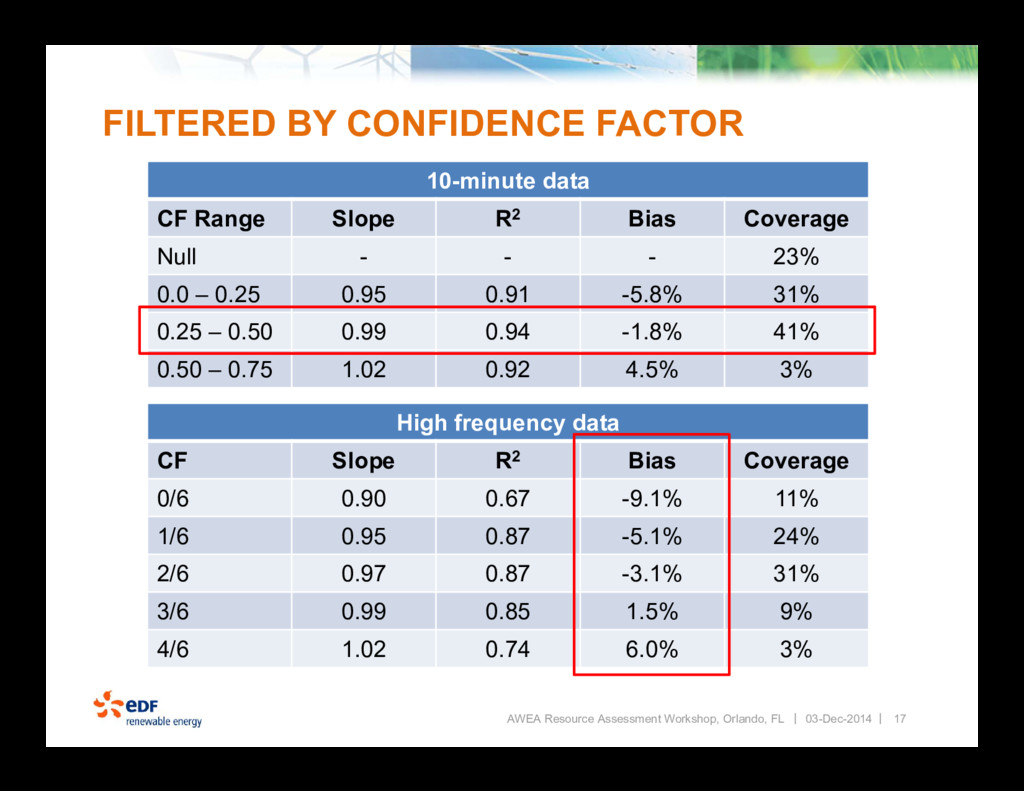
Improve energy assessments which includes increasing accuracy and reducing uncertainty. How do we continue to economically reduce wind flow model uncertainty? 03-Dec-2014
location – ideal but sadly not practical Coupled mesoscale and CFD models – seems to be a point of emphasis by the industry over the past couple years Measure wind speed across the entire site – still new technology with potential AWEA Resource Assessment Workshop, Orlando, FL 3 03-Dec-2014
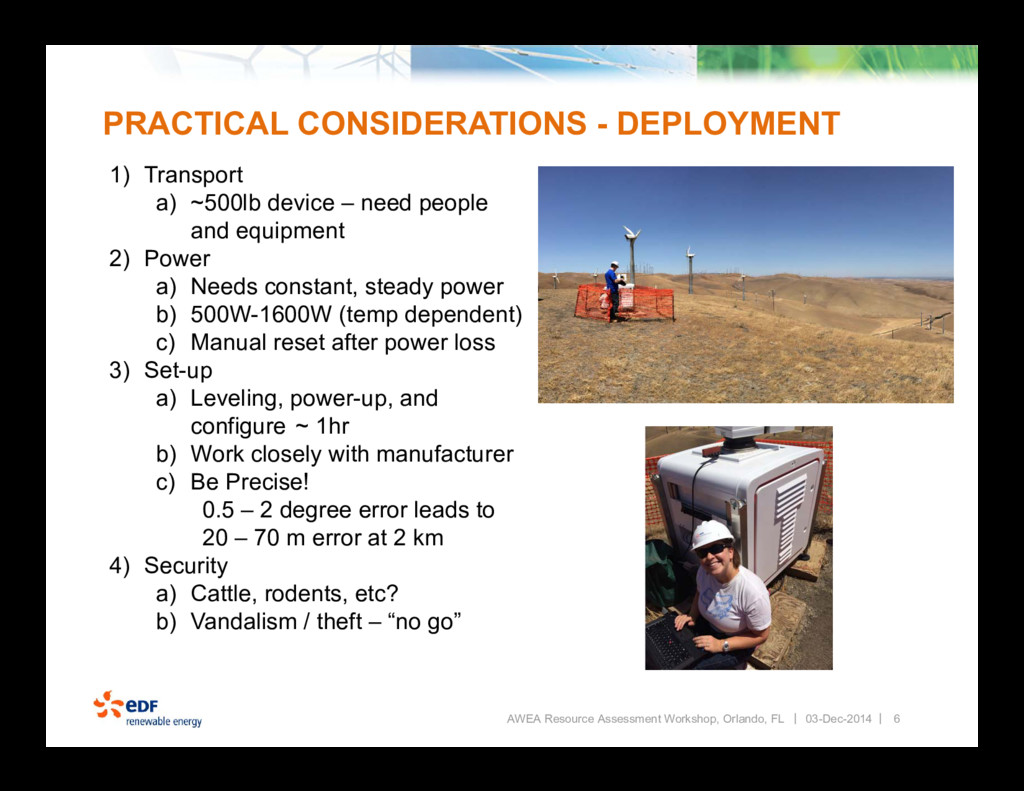
~500lb device – need people and equipment 2) Power a) Needs constant, steady power b) 500W-1600W (temp dependent) c) Manual reset after power loss 3) Set-up a) Leveling, power-up, and configure ~ 1hr b) Work closely with manufacturer c) Be Precise! 0.5 – 2 degree error leads to 20 – 70 m error at 2 km 4) Security a) Cattle, rodents, etc? b) Vandalism / theft – “no go” AWEA Resource Assessment Workshop, Orlando, FL 03-Dec-2014
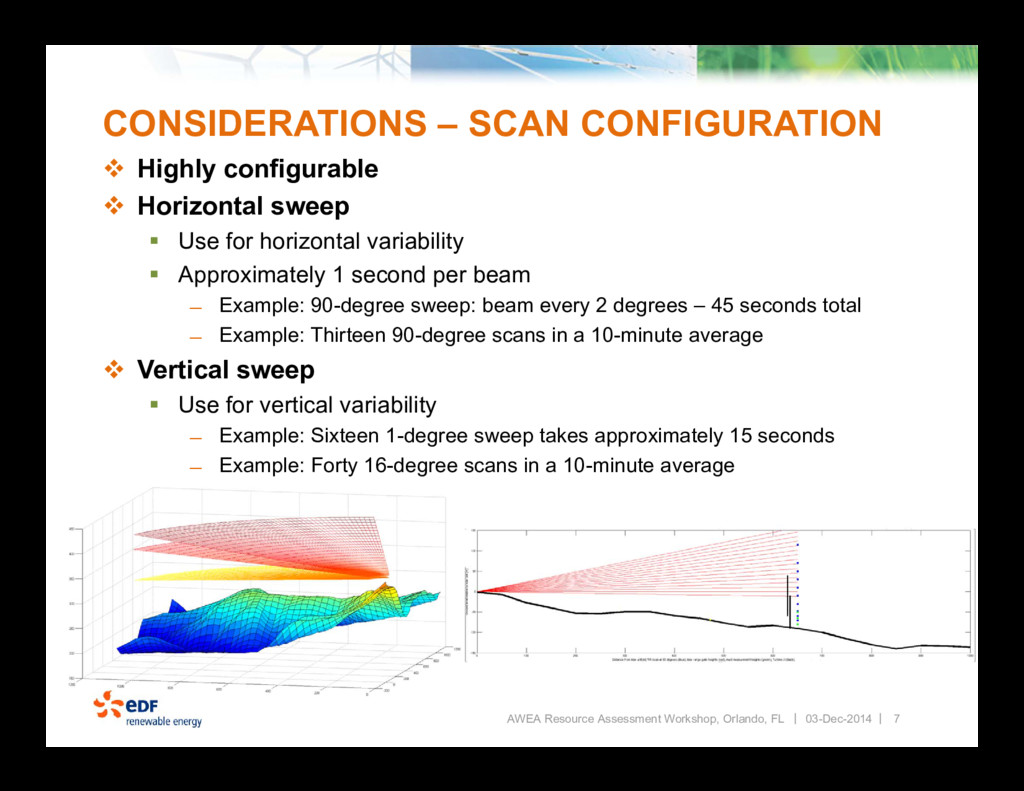
Workshop, Orlando, FL 03-Dec-2014 Highly configurable Horizontal sweep Use for horizontal variability Approximately 1 second per beam ̶ Example: 90-degree sweep: beam every 2 degrees – 45 seconds total ̶ Example: Thirteen 90-degree scans in a 10-minute average Vertical sweep Use for vertical variability ̶ Example: Sixteen 1-degree sweep takes approximately 15 seconds ̶ Example: Forty 16-degree scans in a 10-minute average
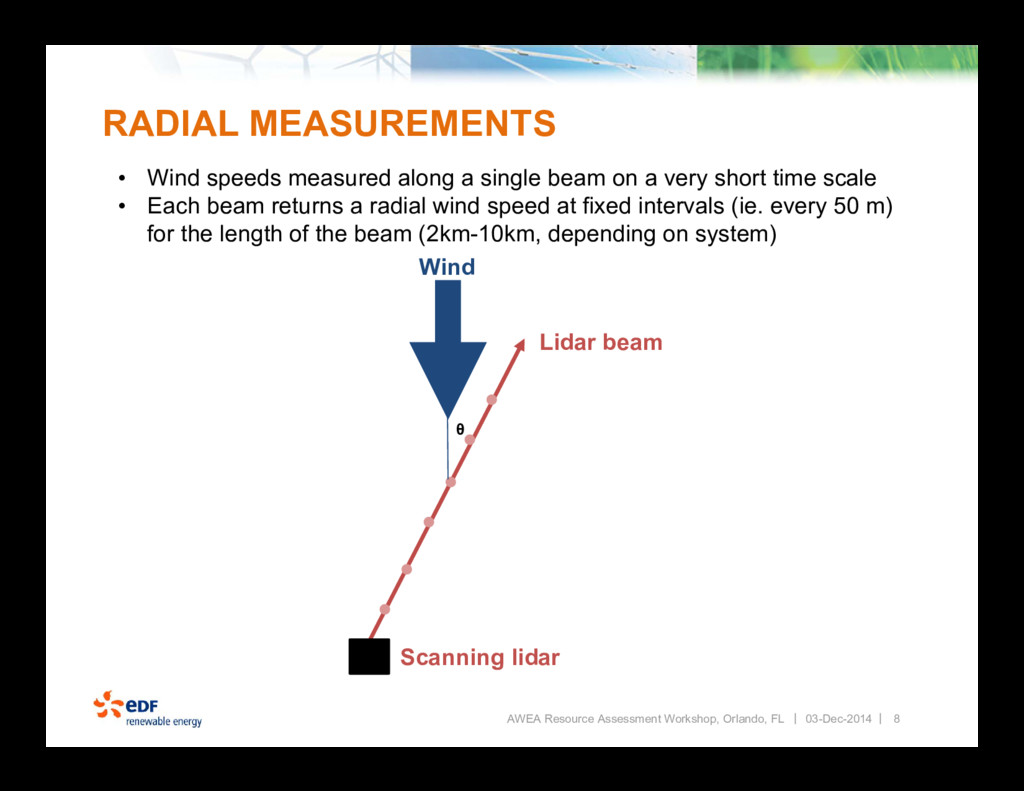
a single beam on a very short time scale • Each beam returns a radial wind speed at fixed intervals (ie. every 50 m) for the length of the beam (2km-10km, depending on system) AWEA Resource Assessment Workshop, Orlando, FL Wind Lidar beam Scanning lidar ᶿ 03-Dec-2014
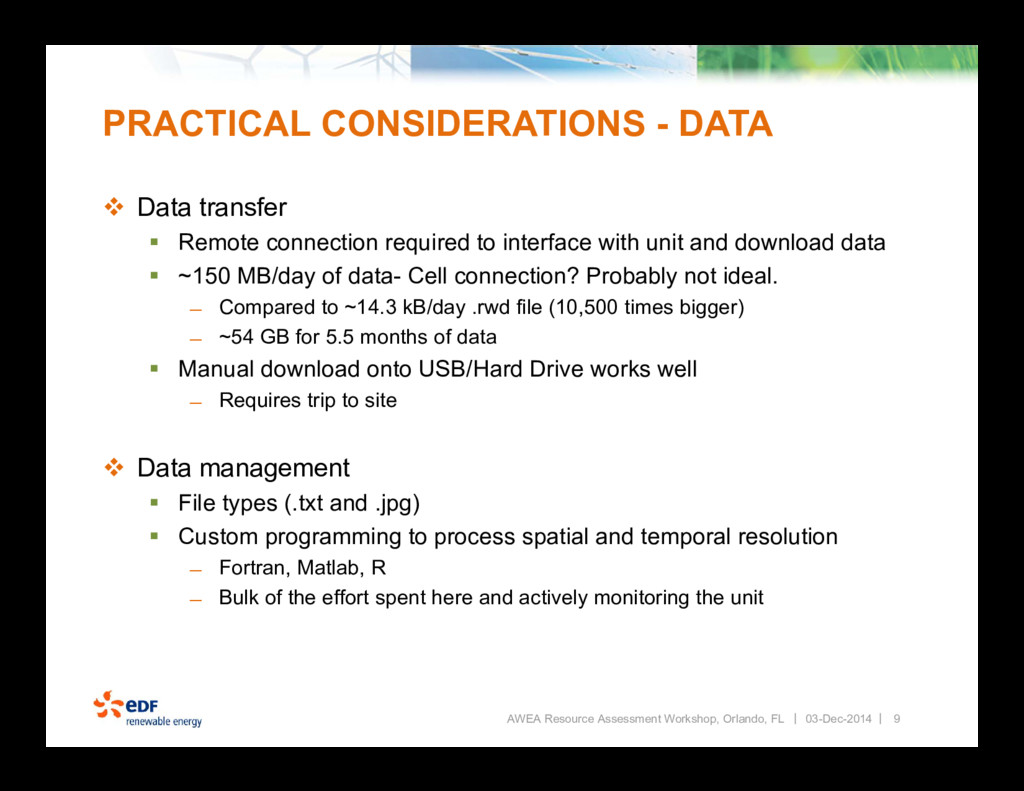
Remote connection required to interface with unit and download data ~150 MB/day of data- Cell connection? Probably not ideal. ̶ Compared to ~14.3 kB/day .rwd file (10,500 times bigger) ̶ ~54 GB for 5.5 months of data Manual download onto USB/Hard Drive works well ̶ Requires trip to site Data management File types (.txt and .jpg) Custom programming to process spatial and temporal resolution ̶ Fortran, Matlab, R ̶ Bulk of the effort spent here and actively monitoring the unit AWEA Resource Assessment Workshop, Orlando, FL 9 03-Dec-2014
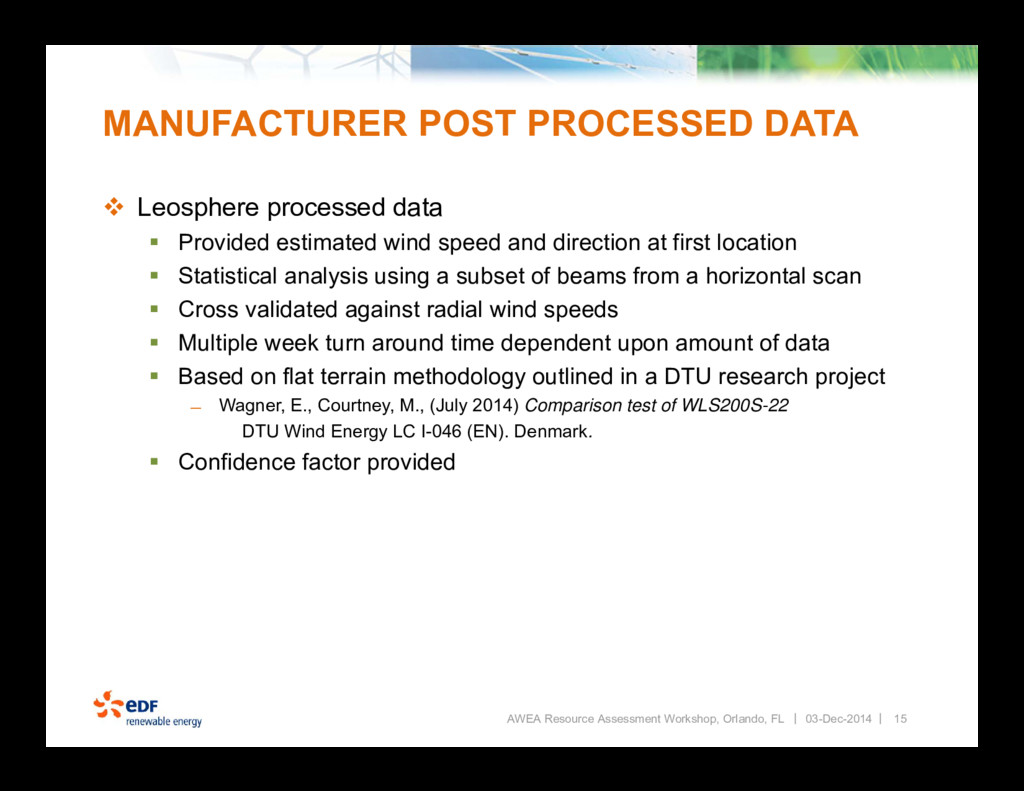
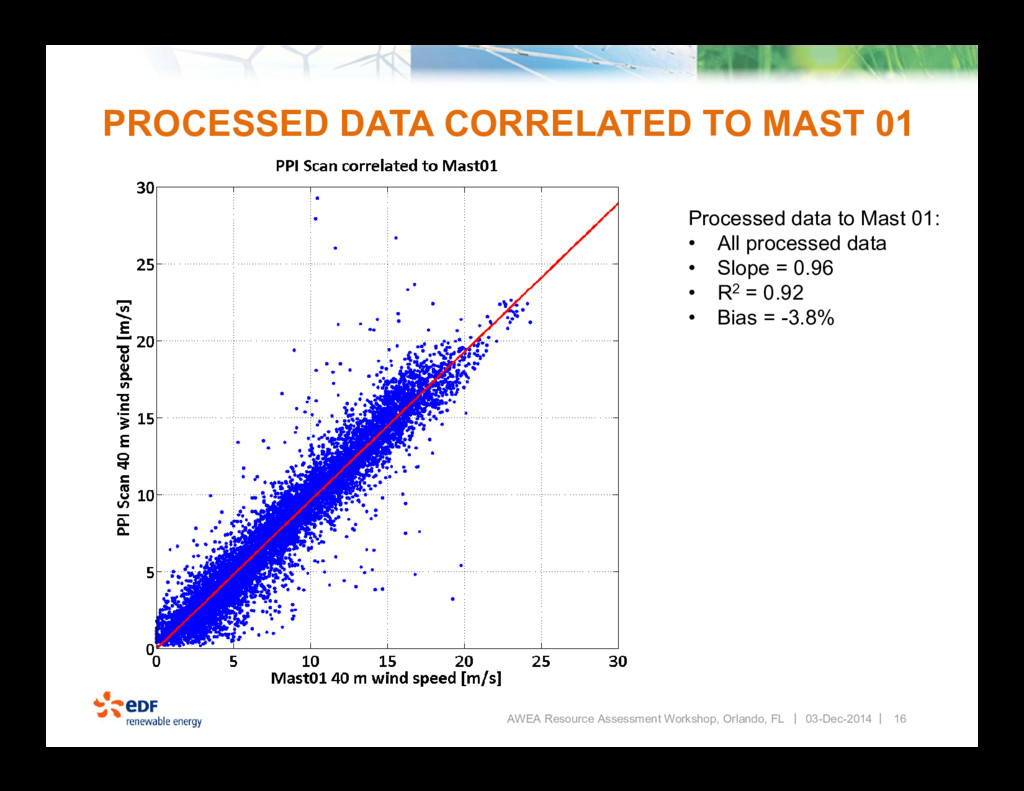
Provided estimated wind speed and direction at first location Statistical analysis using a subset of beams from a horizontal scan Cross validated against radial wind speeds Multiple week turn around time dependent upon amount of data Based on flat terrain methodology outlined in a DTU research project ̶ Wagner, E., Courtney, M., (July 2014) Comparison test of WLS200S-22 DTU Wind Energy LC I-046 (EN). Denmark. Confidence factor provided AWEA Resource Assessment Workshop, Orlando, FL 15 03-Dec-2014
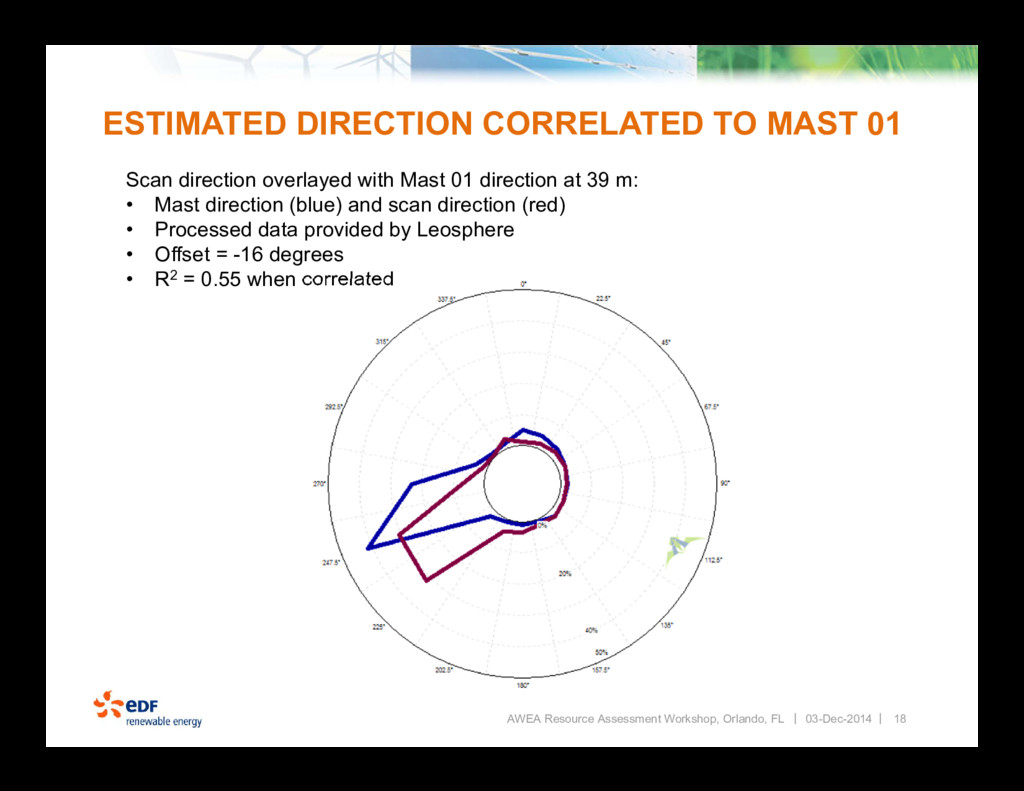
Resource Assessment Workshop, Orlando, FL Scan direction overlayed with Mast 01 direction at 39 m: • Mast direction (blue) and scan direction (red) • Processed data provided by Leosphere • Offset = -16 degrees • R2 = 0.55 when correlated 03-Dec-2014
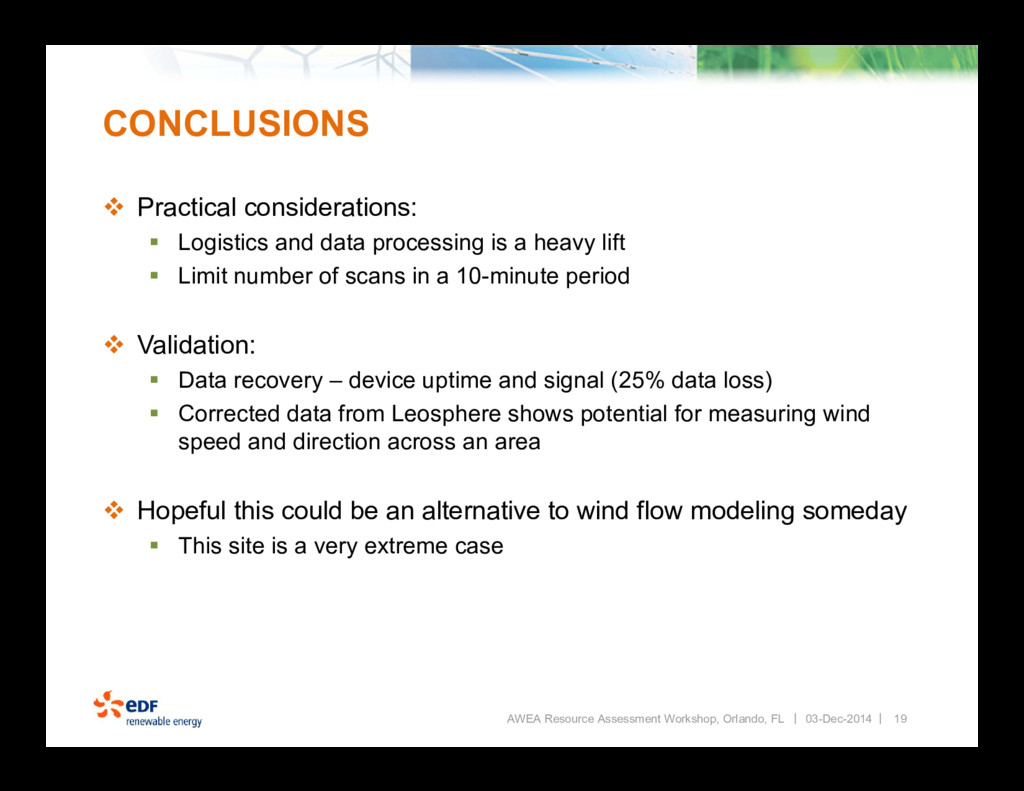
processing is a heavy lift Limit number of scans in a 10-minute period Validation: Data recovery – device uptime and signal (25% data loss) Corrected data from Leosphere shows potential for measuring wind speed and direction across an area Hopeful this could be an alternative to wind flow modeling someday This site is a very extreme case AWEA Resource Assessment Workshop, Orlando, FL 19 03-Dec-2014


 coryjog
 tokuty
 teamlab
 jyouryuusui
 pfn
 codmoninc
 ykanoh
 takonda
 moznion
 yamanoku
 ymotongpoo
 lauravandoore
 inesmontani
 tmiket
 katarinadahlin
 reverentgeek
 sachag
 ammeep
 aleyda
 gr2m
 cassininazir
 samtorres