Upgrade to Pro — share decks privately, control downloads, hide ads and more …

Metrics, beyond “it depends”

Coté
September 22, 2018

Metrics, beyond “it depends”

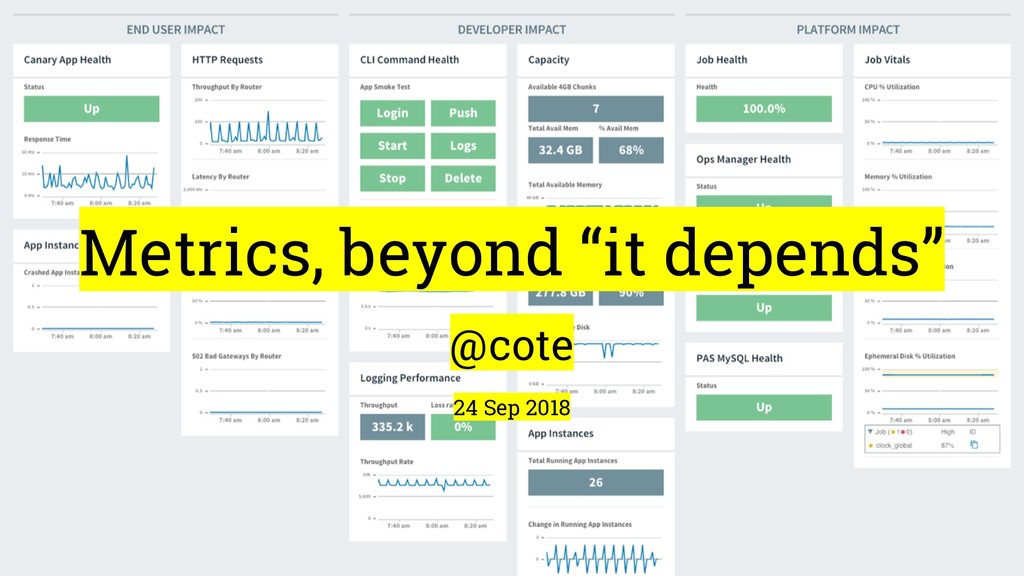
If you ask people for good DevOps and agile metrics, they tell you “it depends.” Few people want to get pinned down on metrics it seems. Well, they might be right, of course, it does depend. But, you still need a framework for de-it-dependsing yourself: how do you figure which metrics to pay attention to? This talk will go over thinking through that model and suggest a few metrics for IT performance to more product-centric, business focused metrics. All based on what organizations are actually doing. Well, all except for the part where I just make things up because they sound good.

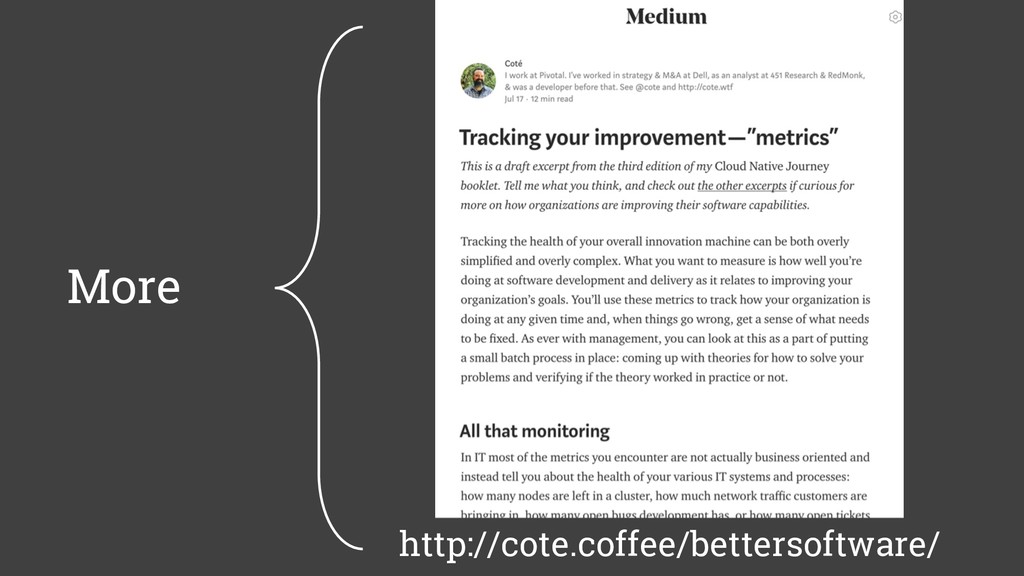
This is based on my work-in-progress book on DevOps-y, agile, etc organizational change. In particular, [the chapter on metrics](https://medium.com/@cote/tracking-your-improvement-metrics-f47eff38772d). See [the listing in PaperCall.io](https://www.papercall.io/speakers/cote/speaker_talks/89527-metrics-beyond-it-depends) as well.

Coté

September 22, 2018
Tweet

More Decks by Coté

Other Decks in Technology

Transcript

  1. Why? • Optimize – speed, better design • Monitoring –

    find problems • Be useful – helping the business
  2. LEAD TIME request created start work in production cycle time

    Source: modified from “Kanban: Definition of Lead Time and Cycle Time,” Stefan Roock, March, 2010.
  3. Example 6 week lead time Lead Time Request Delivery Value

    Added Process Time Non Value Added Process Time f Initial Env Setup Network Config Prod deploy ! ! ! ! ! ! ! White = wait time Red = ops time Green = dev time Source: scenario based on Pivotal customers; "Crossing the Value Stream: Improving Development with Pivotal and Cloud Foundry," Matt Gunter, Pivotal, 2018.
  4. Better value stream, 3-6 weeks lead time Apply ruthless automation

    Remove “bullshit” work ~85% reduction in ops time ~50% reduction in release timeline ! ! ! Source: scenario based on Pivotal customers; "Crossing the Value Stream: Improving Development with Pivotal and Cloud Foundry," Matt Gunter, Pivotal, 2018.
  5. 7 Halve cycles for more feedback or Deliver more in

    each cycle or Don’t tell no one, work less
  6. “53% of mobile users abandon sites that take longer than

    3 seconds to load” 12 Source: "Mobile Load Time and User Abandonment," Tammy Everts, Akamai, Sep, 2016.
  7. All the great hipster metrics • Google SRE: Latency, Traffic,

    Errors, and Saturation • USE Method: Utilization, Saturation, and Errors • RED Method: Rate, Errors, and Duration Source: ”How to Monitor the SRE Golden Signals,” Steve Mushero, Nov, 2017.
  8. TIME TO MARKET MTTR Velocity Lead Time HA HA SMARTART

    (Get money faster, grab marketshare before competition)
  9. Source: "Cost of Delay - How PCF Helped Demonstrate the

    DoD Can't Afford Business as Usual,” Capt. Bryon Kroger & Tory Galvin, USAF, CF Summit NA 2018, April, 2018. (Theoretic) opportunity cost: If we stay the same, how much money we will not make (or, “lose”)