r t o o l f o r t h e q u a l i t y t o o l b o x M B A A d i s t r i c t S E F a l l m e e t i n g O c t o b e r 2 0 , 2 0 1 8 A r t h u r R u d o l p h c r a f t b e e r s c i @ g m a i l . c o m @ c r a f t b e e r s c i
in brewhouse & taproom in 2015 – Became quality manager in 2016 • PhD candidate in the Department of Biology, University of Florida – Researching flocculation and the evolution of flocculins genes • 2010 B.S. Integrative Biology from the University of Illinois • Over 10 years of research experience in genetics, genomics, and evolutionary biology
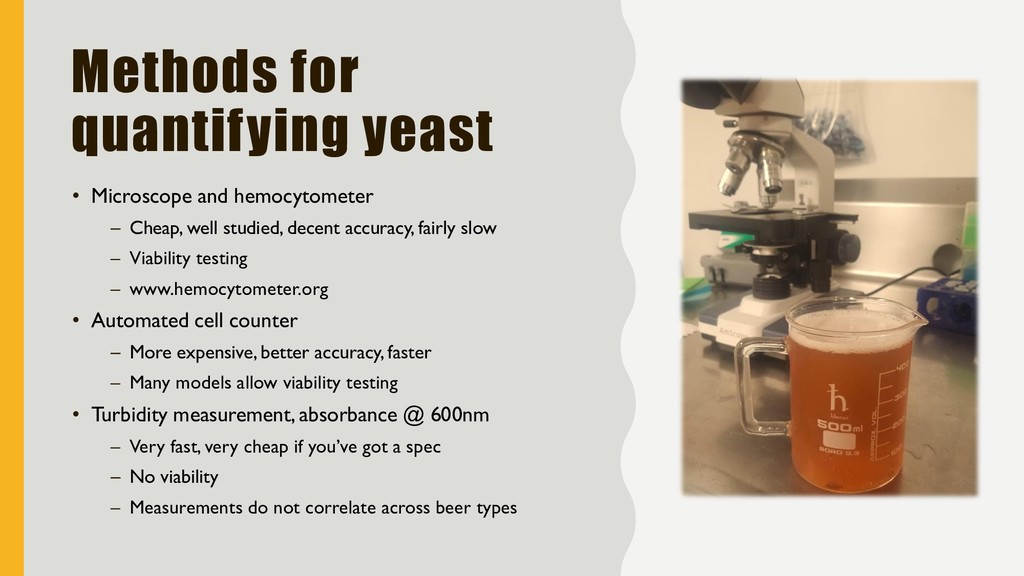
well studied, decent accuracy, fairly slow – Viability testing – www.hemocytometer.org • Automated cell counter – More expensive, better accuracy, faster – Many models allow viability testing • Turbidity measurement, absorbance @ 600nm – Very fast, very cheap if you’ve got a spec – No viability – Measurements do not correlate across beer types
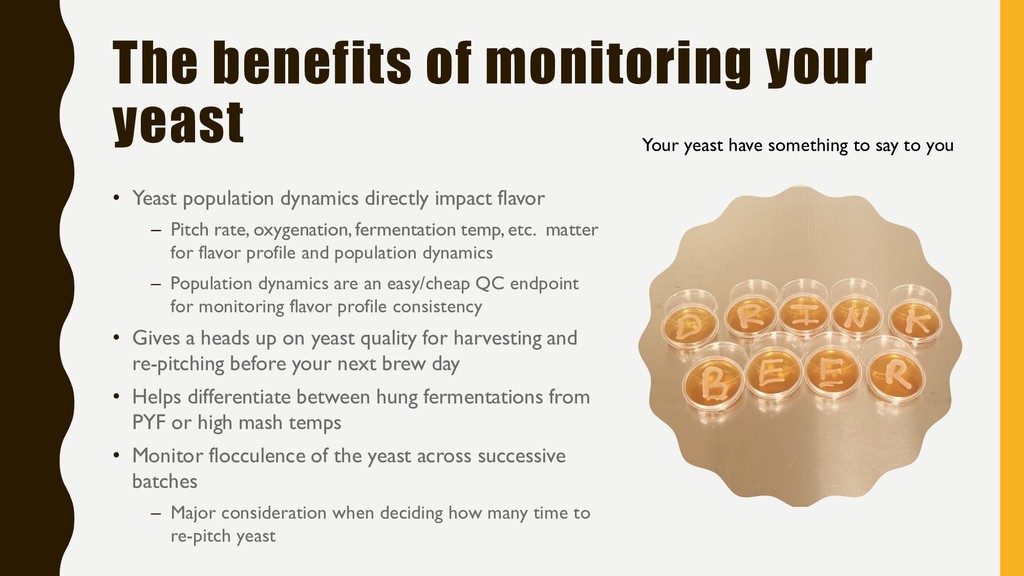
directly impact flavor – Pitch rate, oxygenation, fermentation temp, etc. matter for flavor profile and population dynamics – Population dynamics are an easy/cheap QC endpoint for monitoring flavor profile consistency • Gives a heads up on yeast quality for harvesting and re-pitching before your next brew day • Helps differentiate between hung fermentations from PYF or high mash temps • Monitor flocculence of the yeast across successive batches – Major consideration when deciding how many time to re-pitch yeast Your yeast have something to say to you
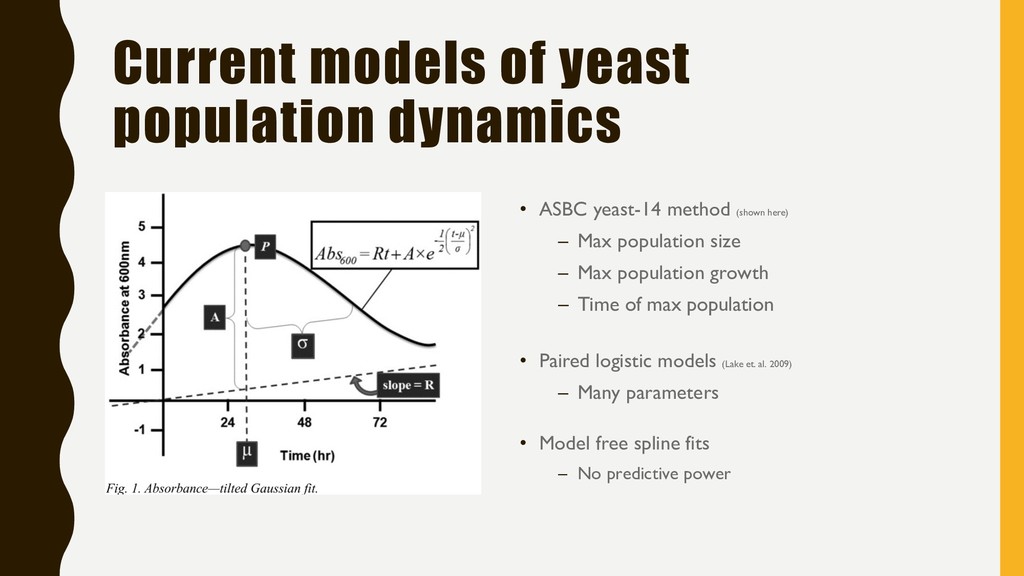
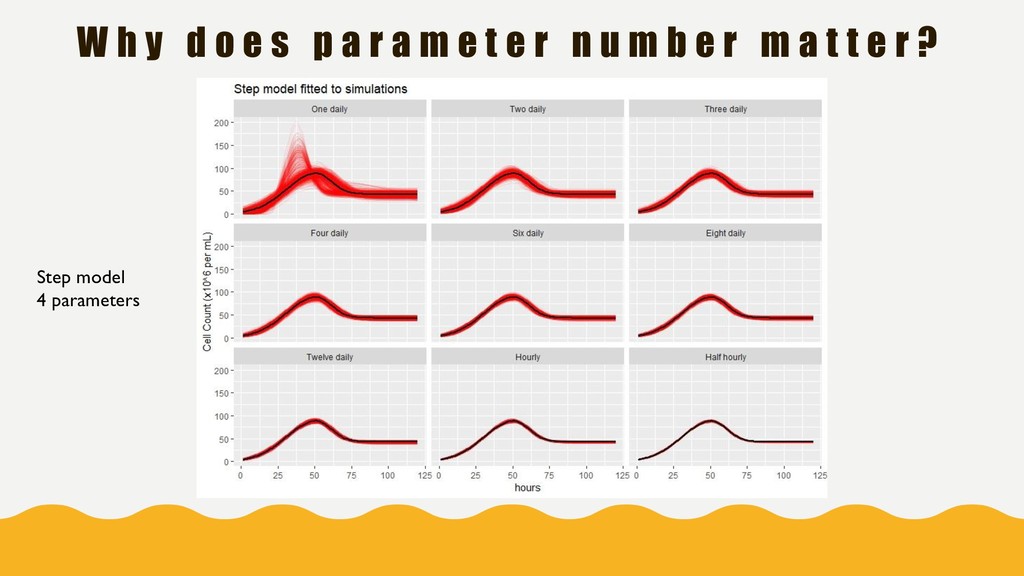
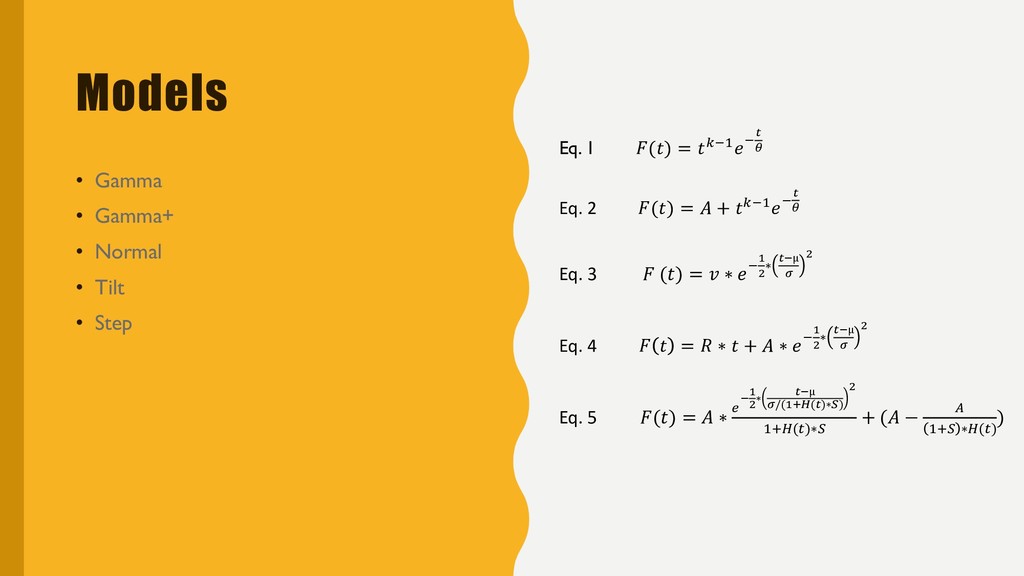
(shown here) – Max population size – Max population growth – Time of max population • Paired logistic models (Lake et. al. 2009) – Many parameters • Model free spline fits – No predictive power
for consistency – For small or large data sets • Optimize sampling times – Save time and money by minimizing sampling effort – Get the most out of your effort • Detect PYF positive malt
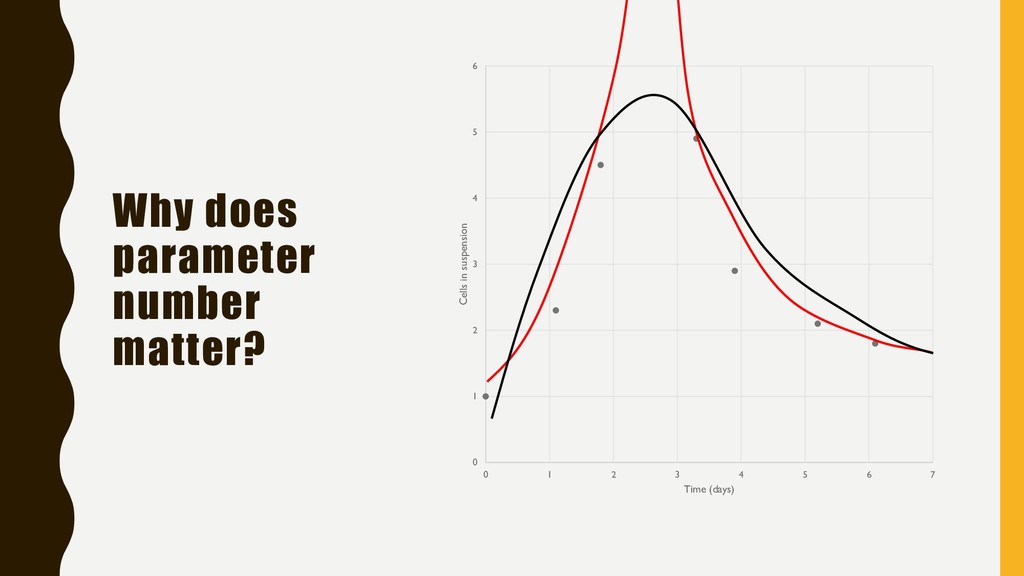
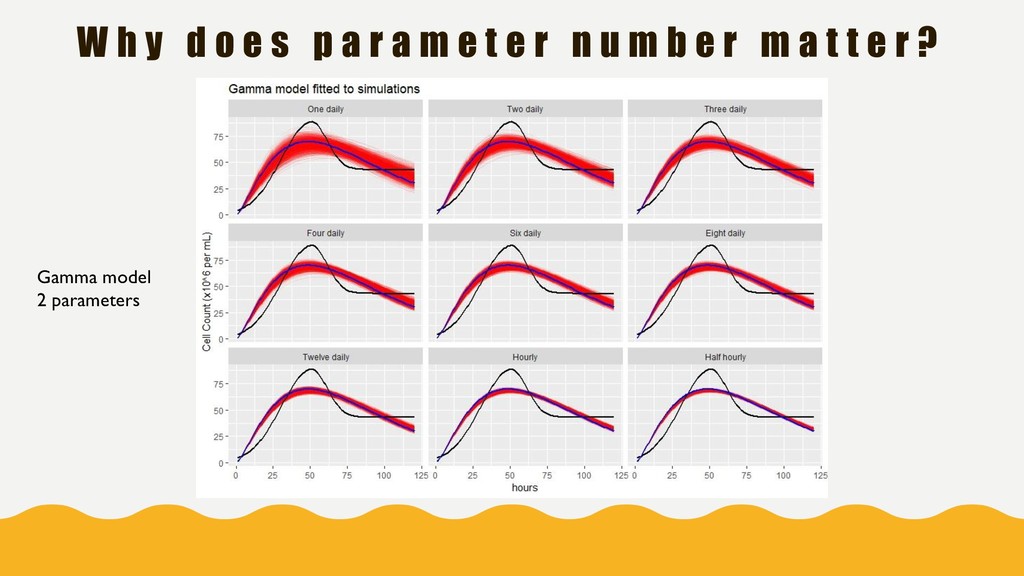
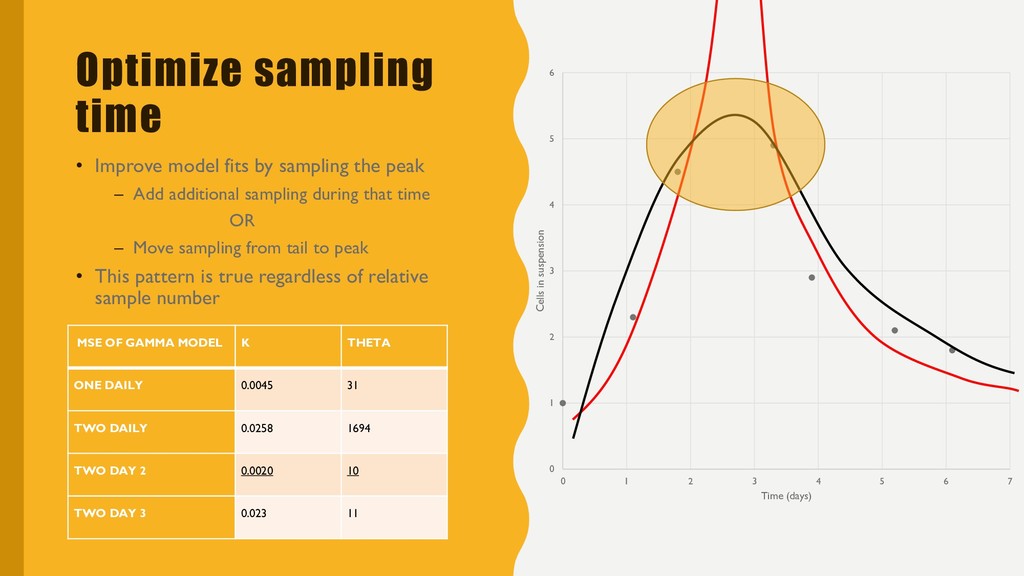
peak – Add additional sampling during that time OR – Move sampling from tail to peak • This pattern is true regardless of relative sample number 0 1 2 3 4 5 6 0 1 2 3 4 5 6 7 Cells in suspension Time (days) MSE OF GAMMA MODEL K THETA ONE DAILY 0.0045 31 TWO DAILY 0.0258 1694 TWO DAY 2 0.0020 10 TWO DAY 3 0.023 11
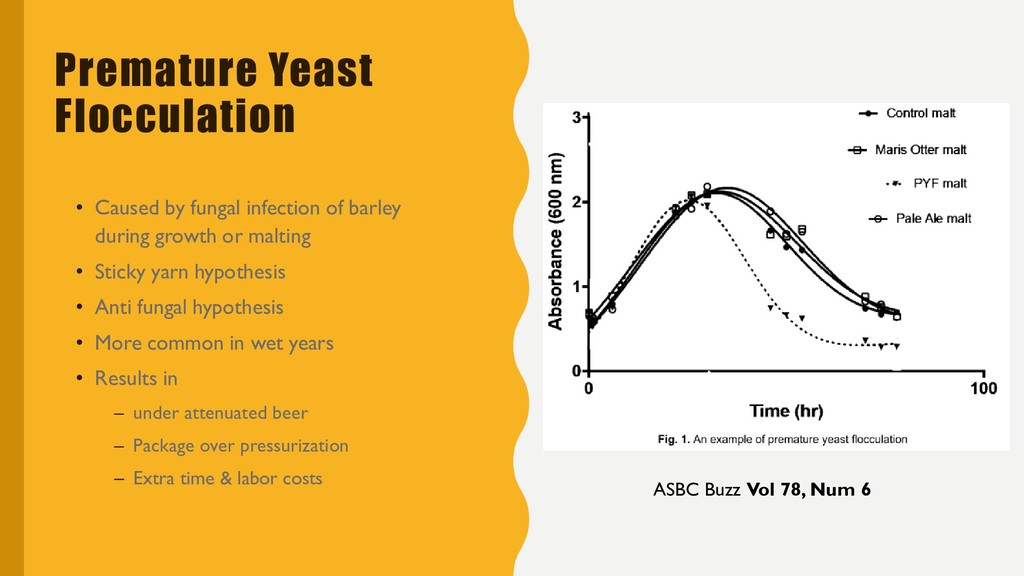
of barley during growth or malting • Sticky yarn hypothesis • Anti fungal hypothesis • More common in wet years • Results in – under attenuated beer – Package over pressurization – Extra time & labor costs ASBC Buzz Vol 78, Num 6
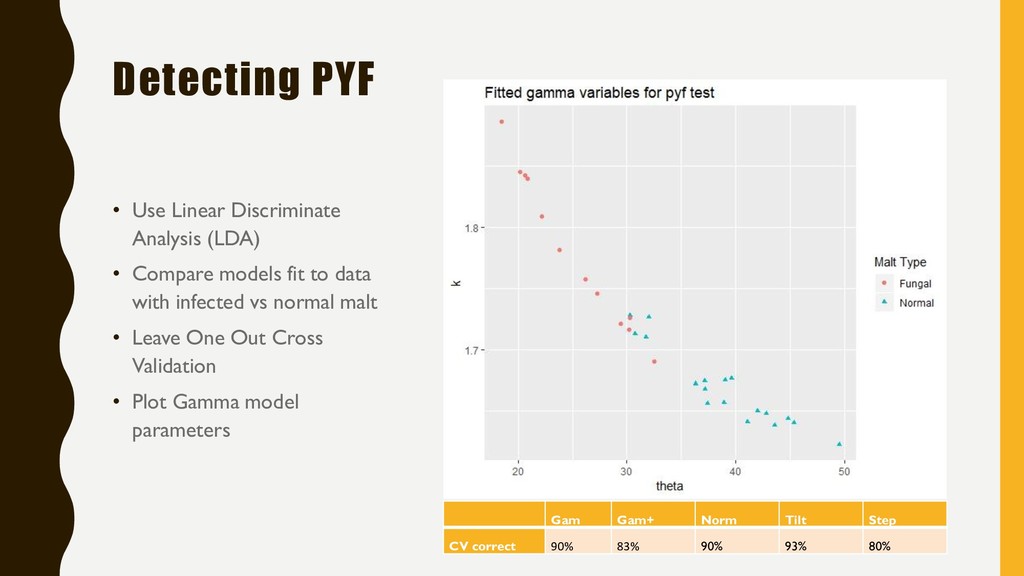
models fit to data with infected vs normal malt • Leave One Out Cross Validation • Plot Gamma model parameters Gam Gam+ Norm Tilt Step CV correct 90% 83% 90% 93% 80%
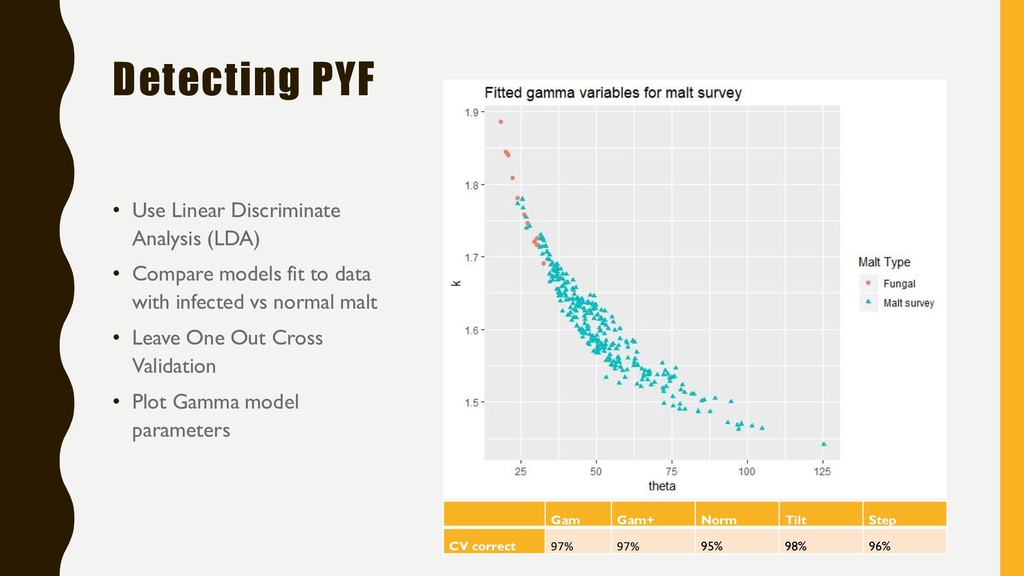
models fit to data with infected vs normal malt • Leave One Out Cross Validation • Plot Gamma model parameters Gam Gam+ Norm Tilt Step CV correct 97% 97% 95% 98% 96%
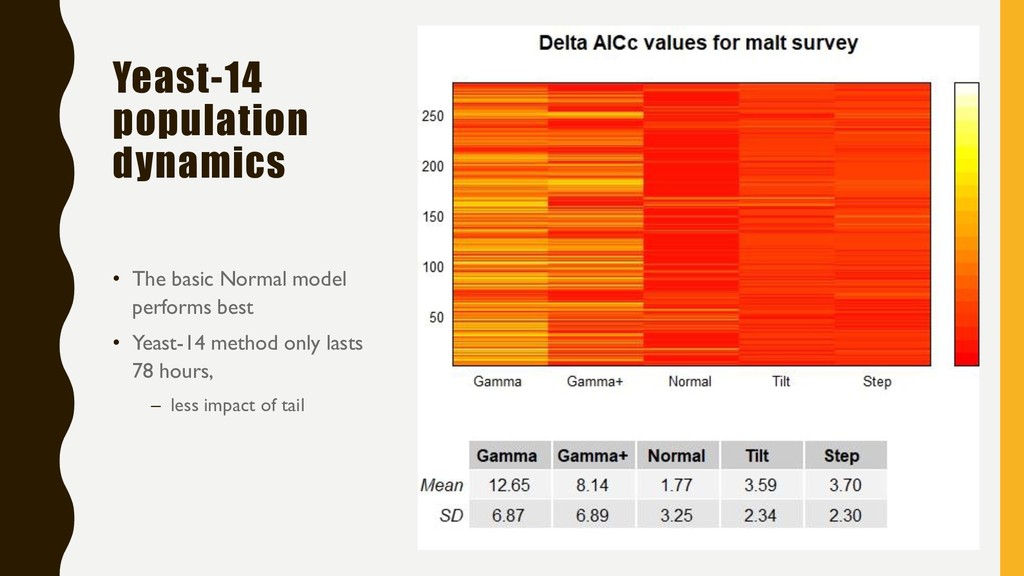
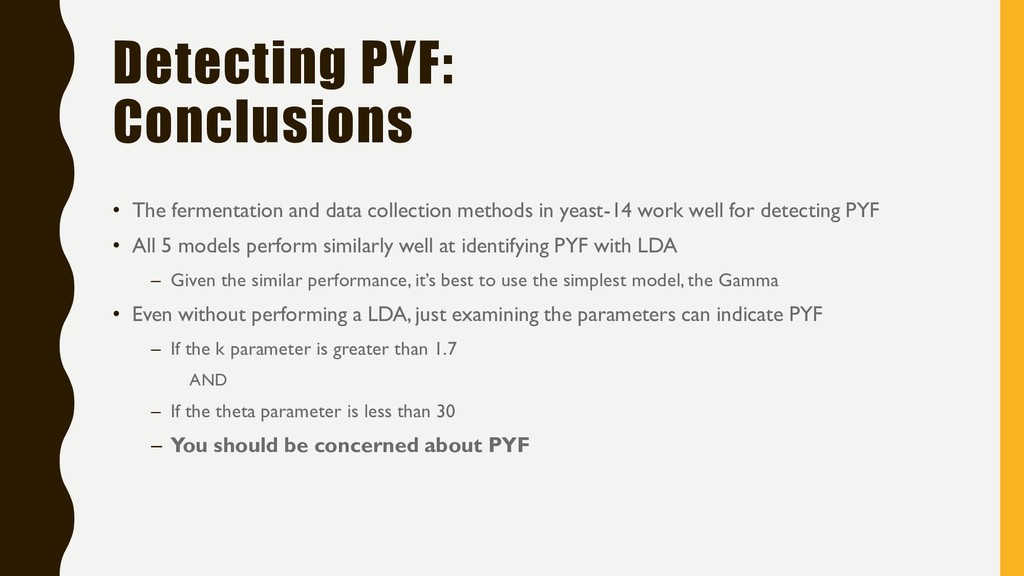
in yeast-14 work well for detecting PYF • All 5 models perform similarly well at identifying PYF with LDA – Given the similar performance, it’s best to use the simplest model, the Gamma • Even without performing a LDA, just examining the parameters can indicate PYF – If the k parameter is greater than 1.7 AND – If the theta parameter is less than 30 – You should be concerned about PYF
A., Reid, A. M. and Singer, D. S. (2009), Modelling of Yeast in Suspension During Malt Fermentation Assays. Journal of the Institute of Brewing, 115: 296-299. doi:10.1002/j.2050-0416.2009.tb00384.x