e n d e c i s i o n m a k i n g i n t h e b r e w h o u s e F B G A n n u a l C o n f e r e n c e A u g u s t 7 t h , 2 0 1 9 A r t h u r R u d o l p h P h D @ c r a f t b e e r s c i J a v i e r a R u d o l p h @ j a v i r u d o l p h
are we and why are we here? Javiera Rudolph PhD Student at UF Ecological stats & systems biology Data scientist R Ladies Gainesville organizer Arthur Rudolph Recent UF PhD Graduate Quality Manager at First Magnitude Yeast Wrangler USDA Microbiologist
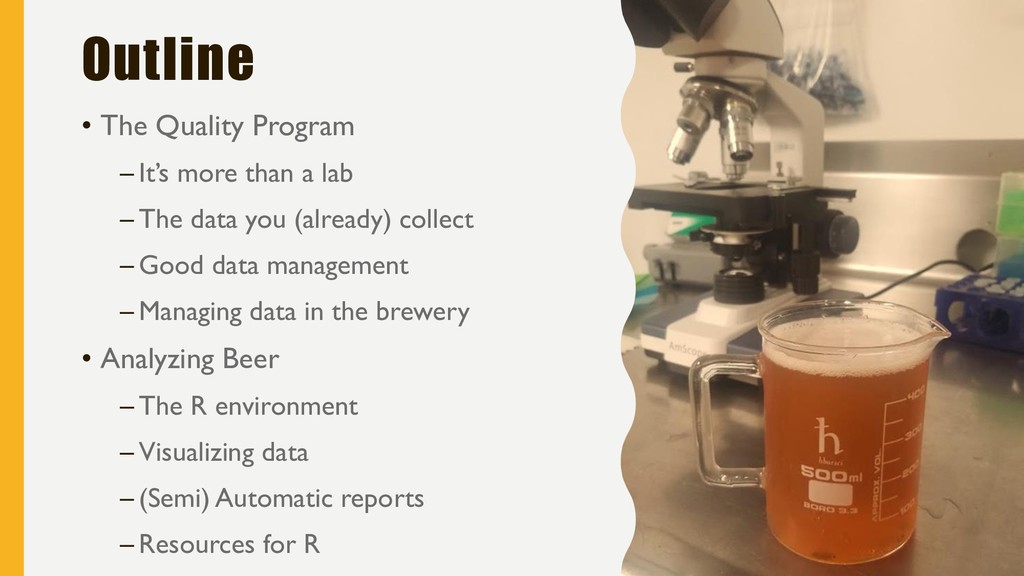
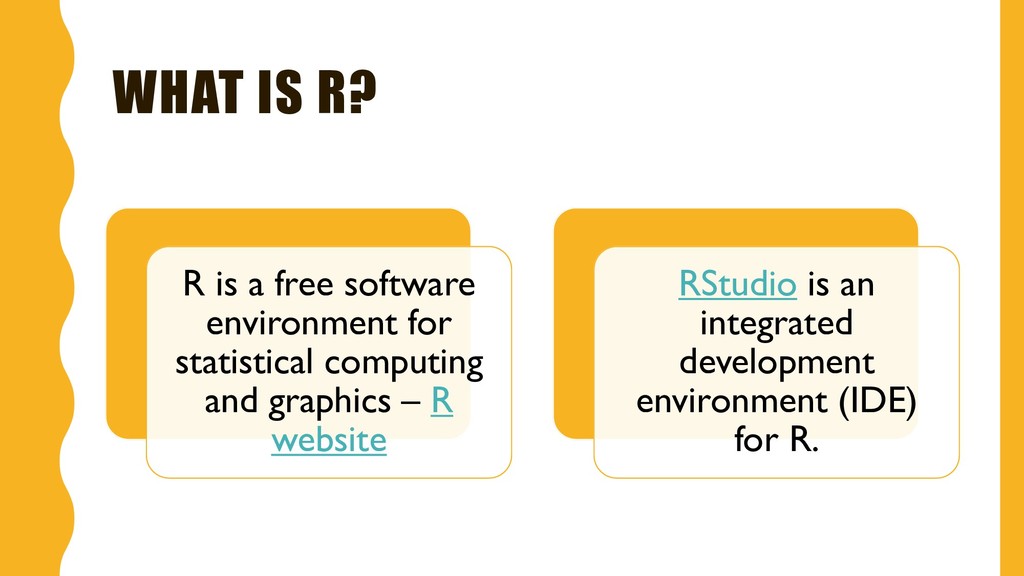
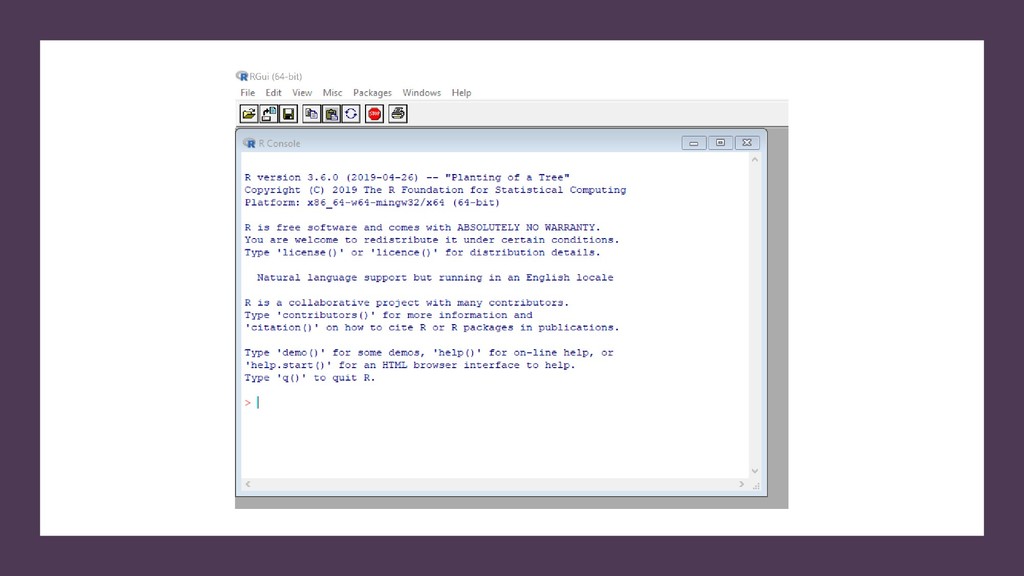
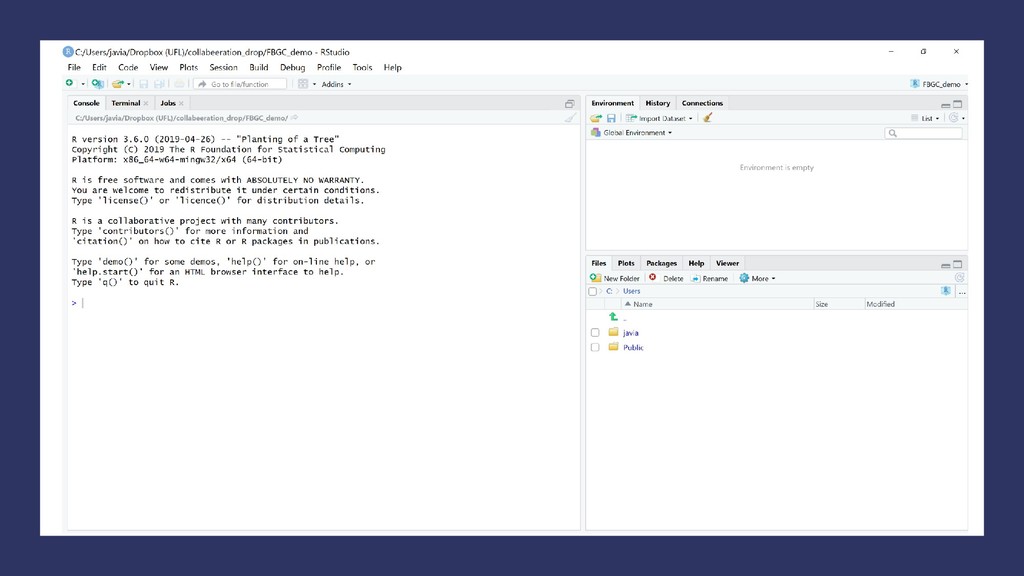
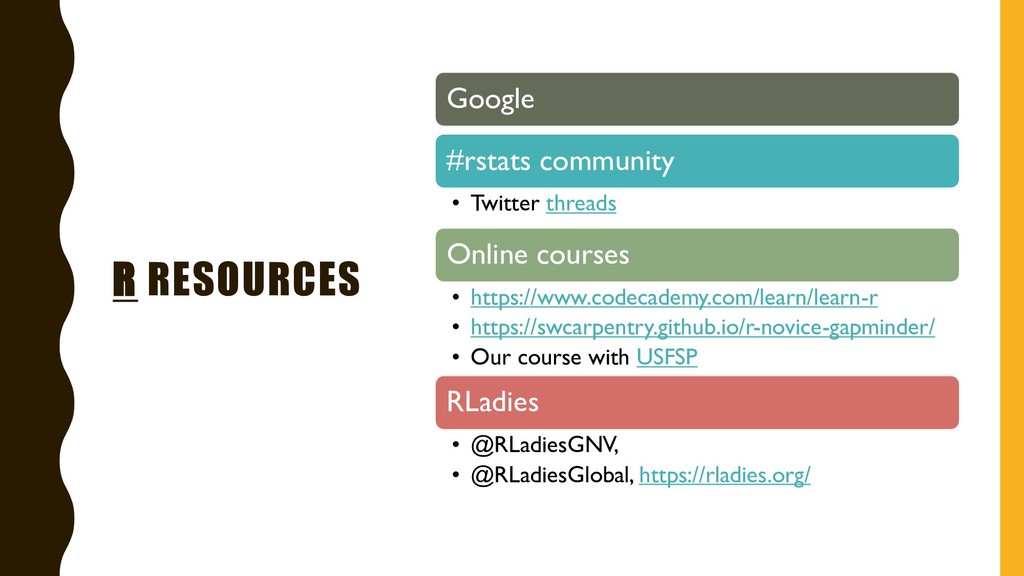
lab – The data you (already) collect – Good data management – Managing data in the brewery • Analyzing Beer – The R environment – Visualizing data – (Semi) Automatic reports – Resources for R
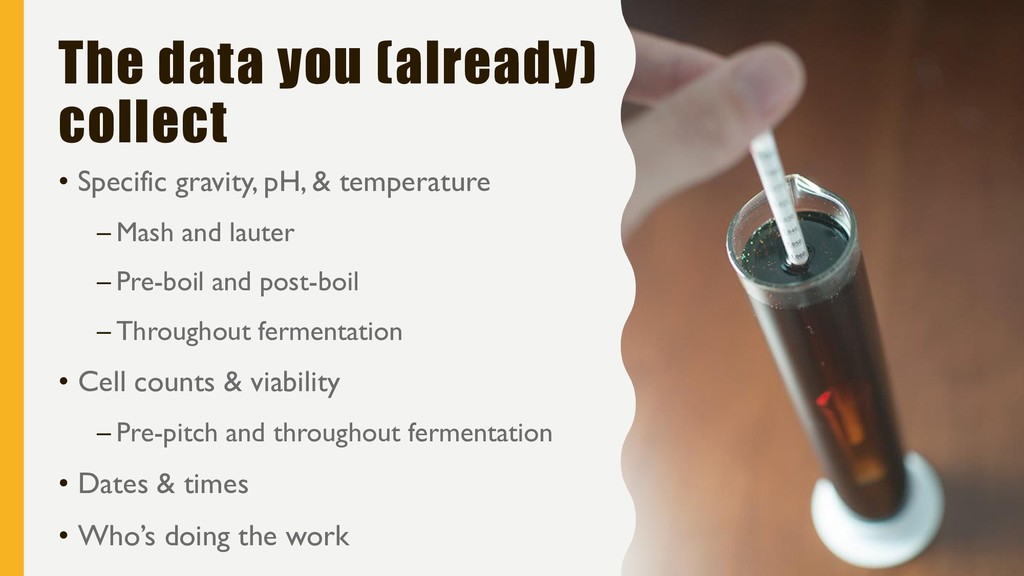
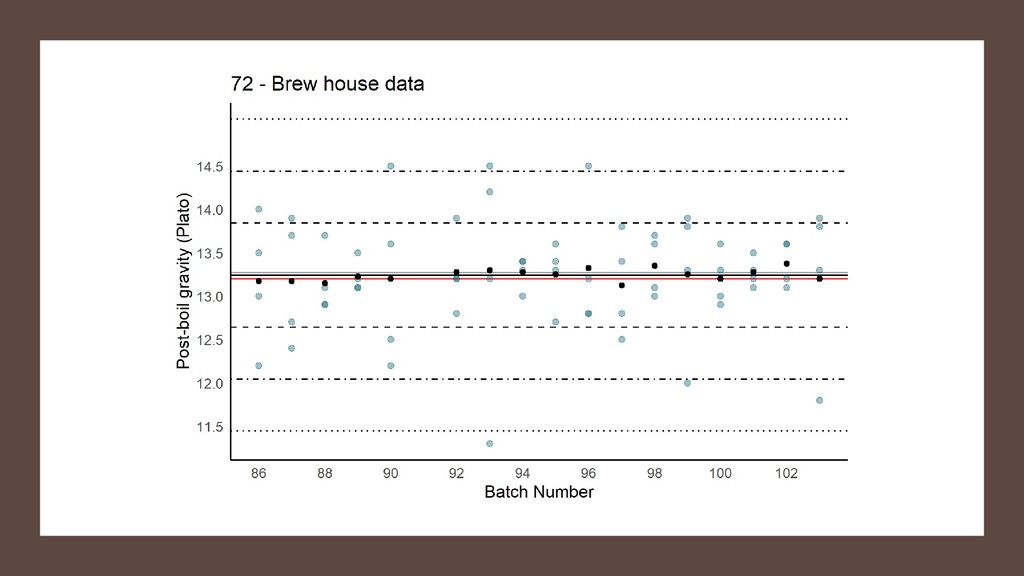
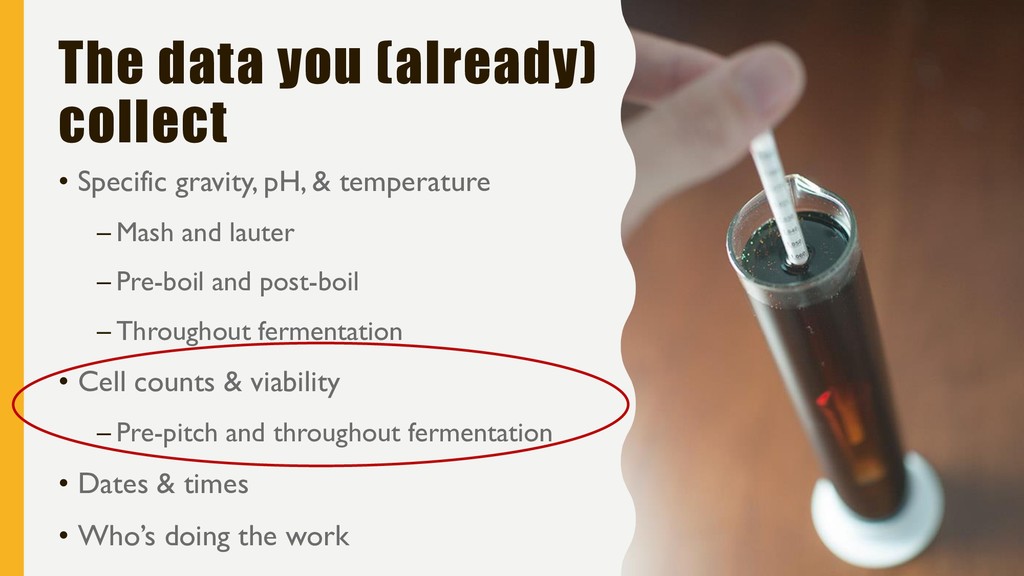
temperature – Mash and lauter – Pre-boil and post-boil – Throughout fermentation • Cell counts & viability – Pre-pitch and throughout fermentation • Dates & times • Who’s doing the work
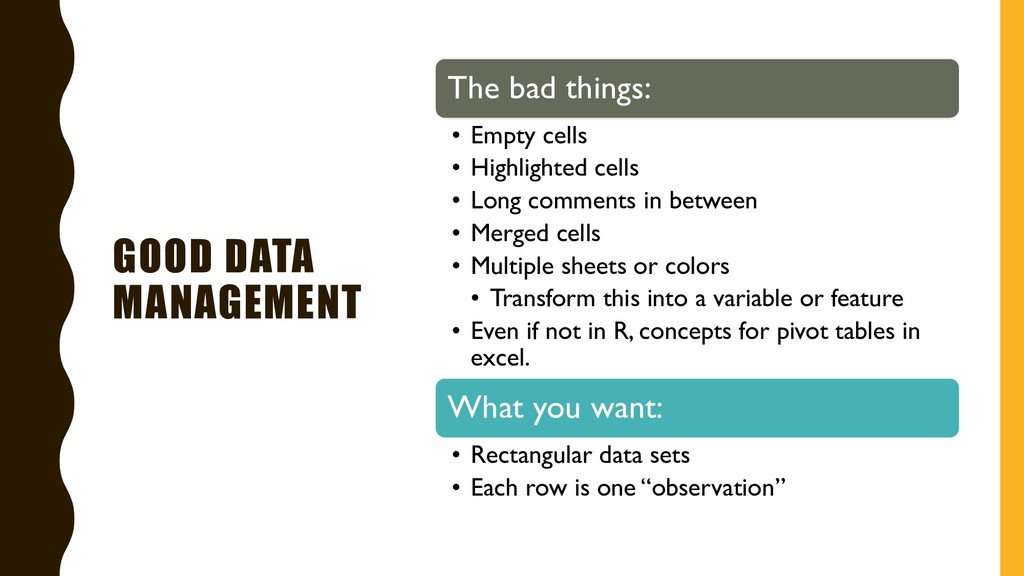
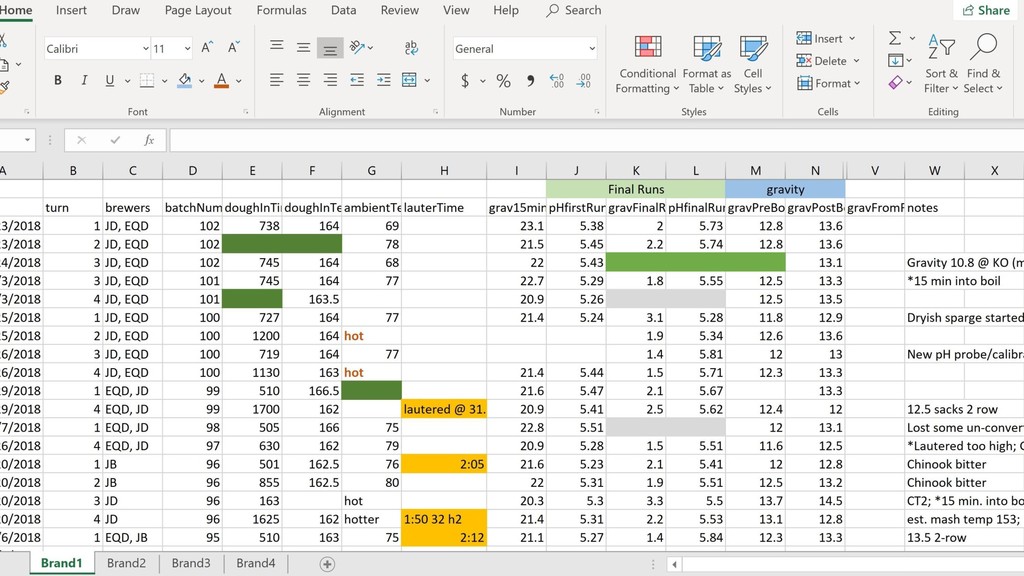
Highlighted cells • Long comments in between • Merged cells • Multiple sheets or colors • Transform this into a variable or feature • Even if not in R, concepts for pivot tables in excel. What you want: • Rectangular data sets • Each row is one “observation”
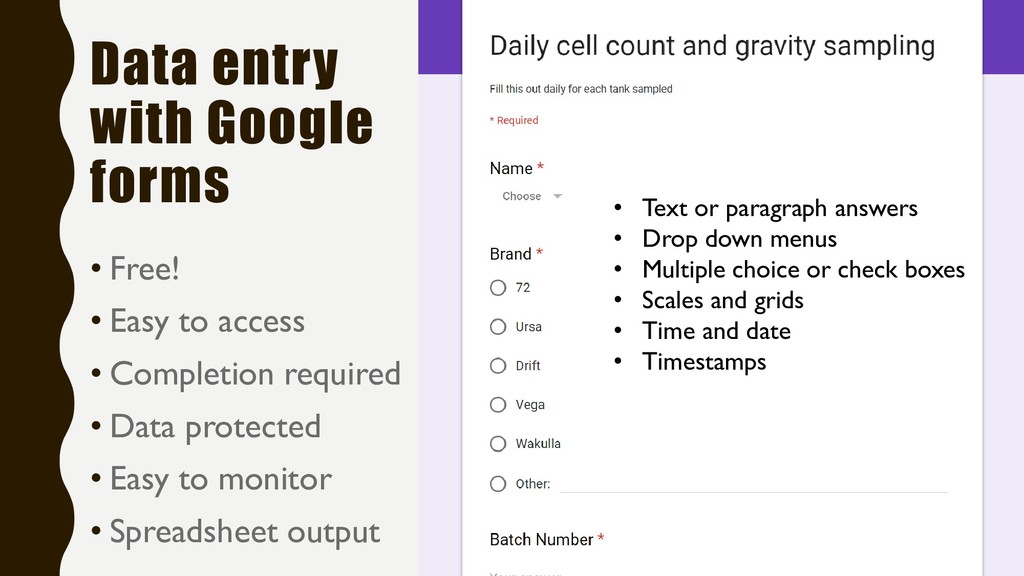
access • Completion required • Data protected • Easy to monitor • Spreadsheet output • Text or paragraph answers • Drop down menus • Multiple choice or check boxes • Scales and grids • Time and date • Timestamps
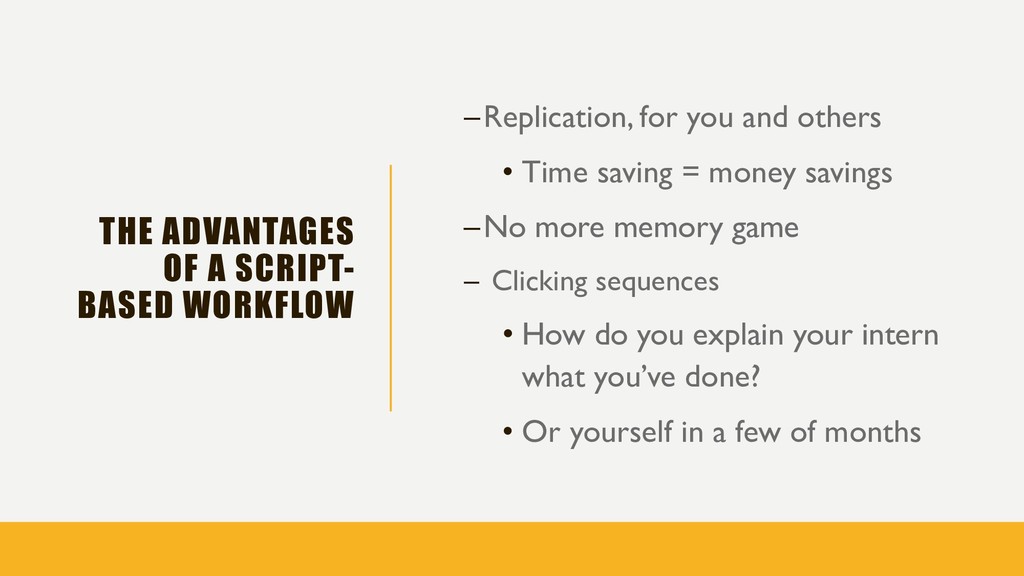
and others • Time saving = money savings –No more memory game – Clicking sequences • How do you explain your intern what you’ve done? • Or yourself in a few of months
temperature – Mash and lauter – Pre-boil and post-boil – Throughout fermentation • Cell counts & viability – Pre-pitch and throughout fermentation • Dates & times • Who’s doing the work