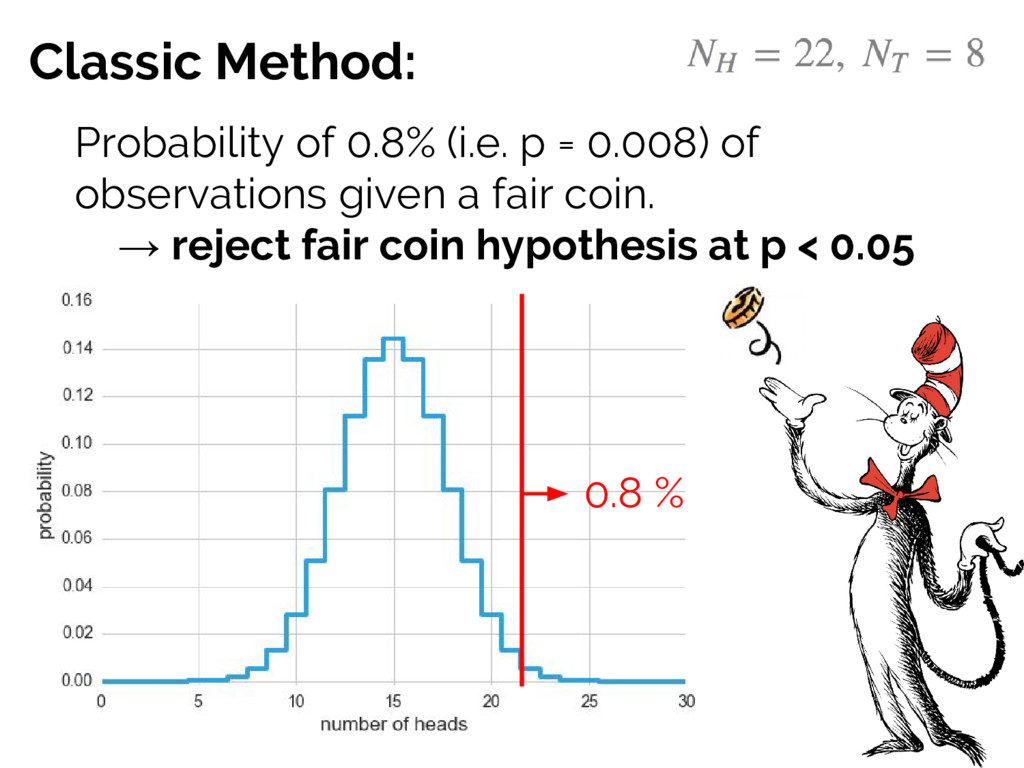
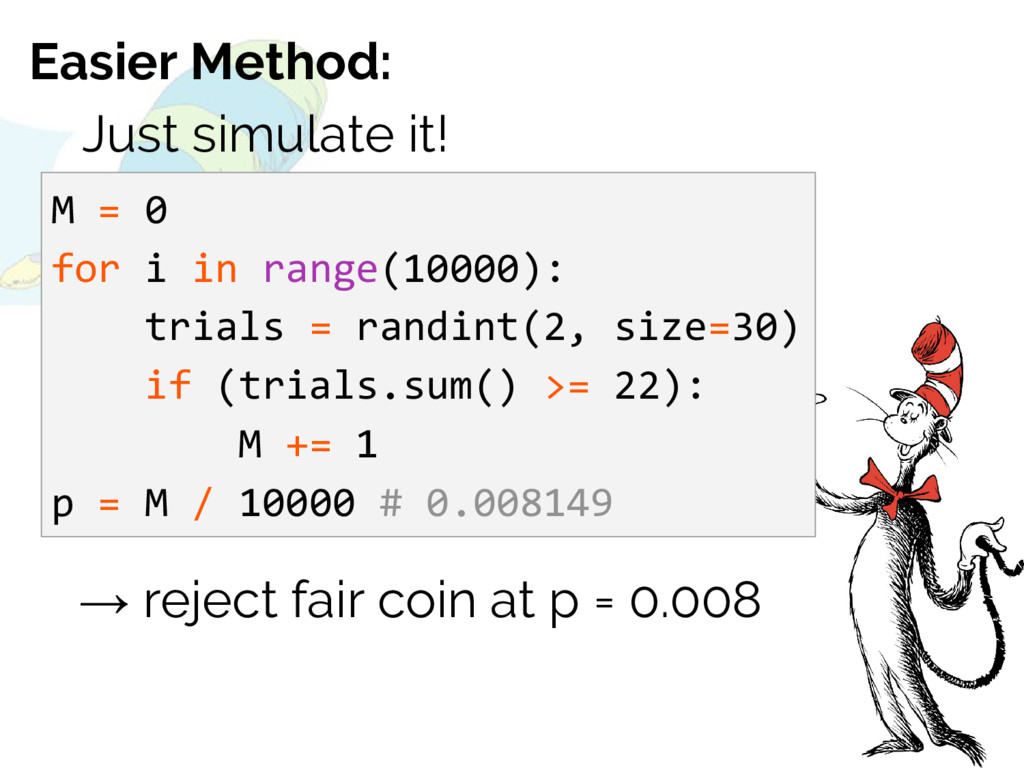
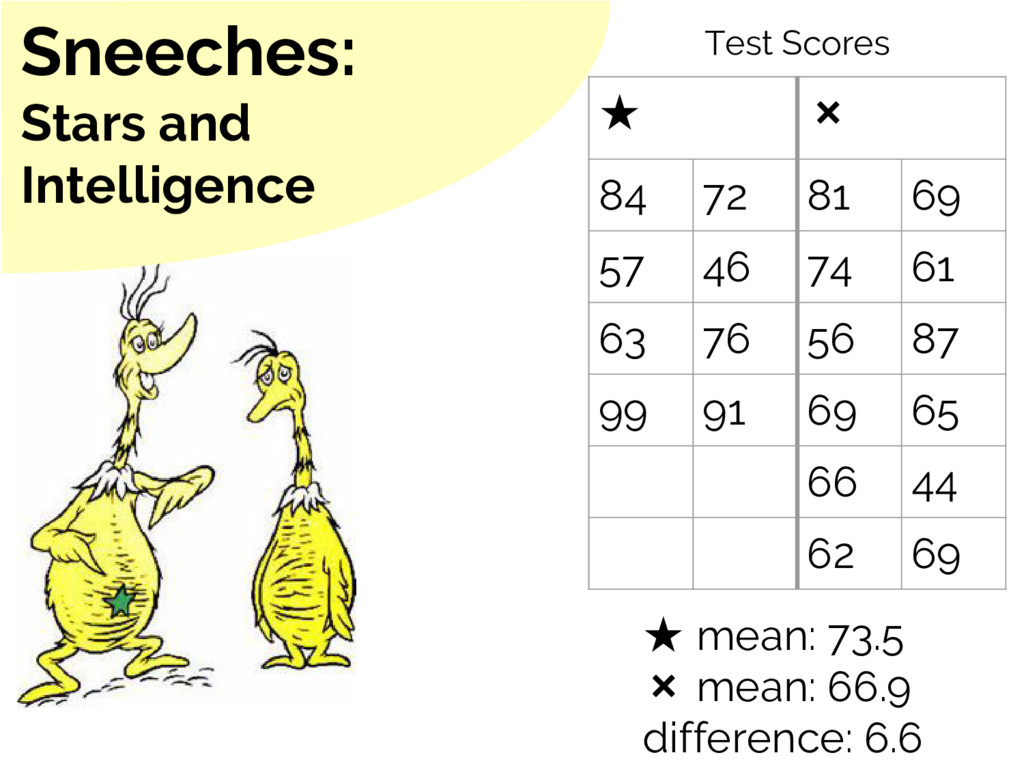
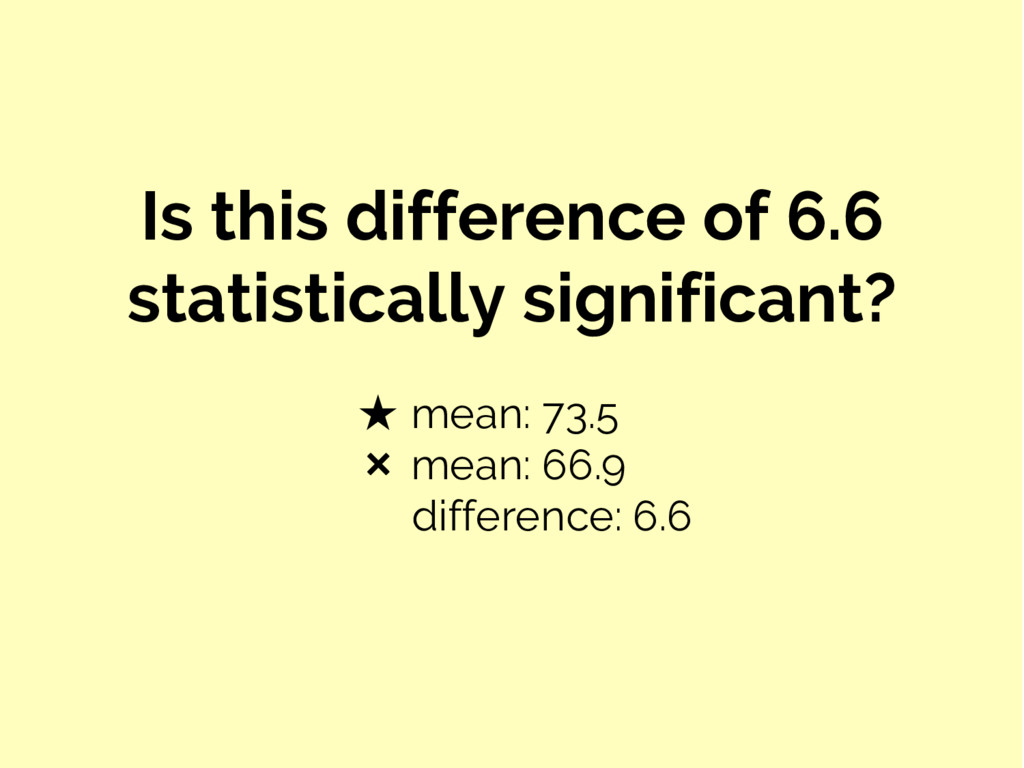
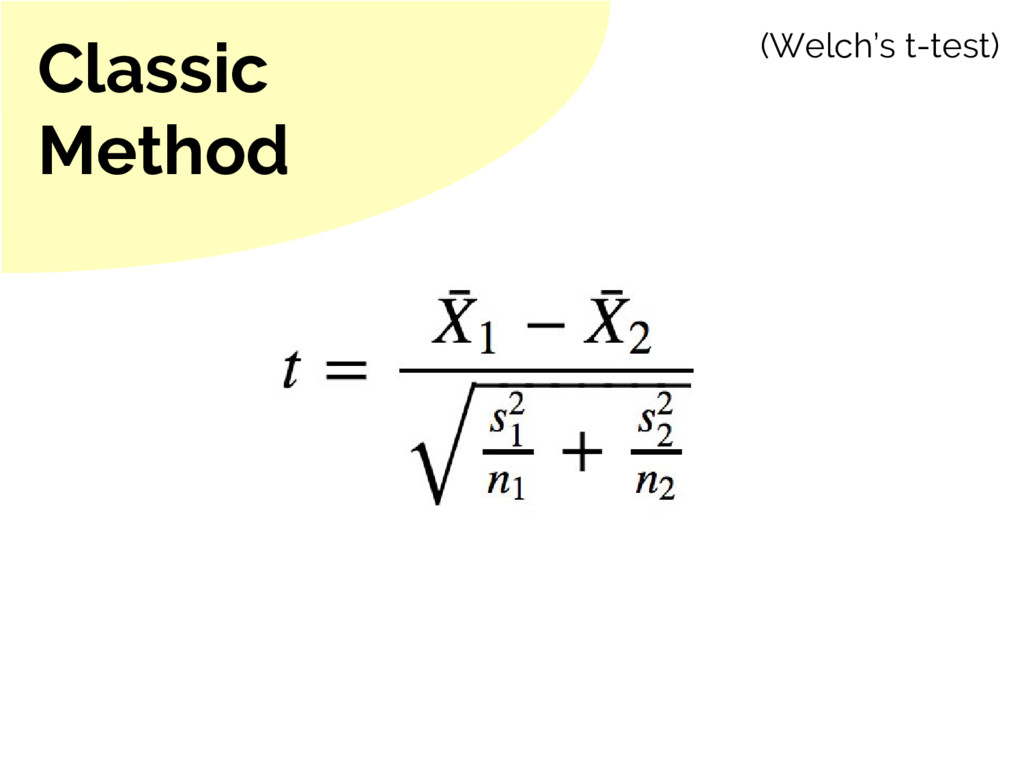
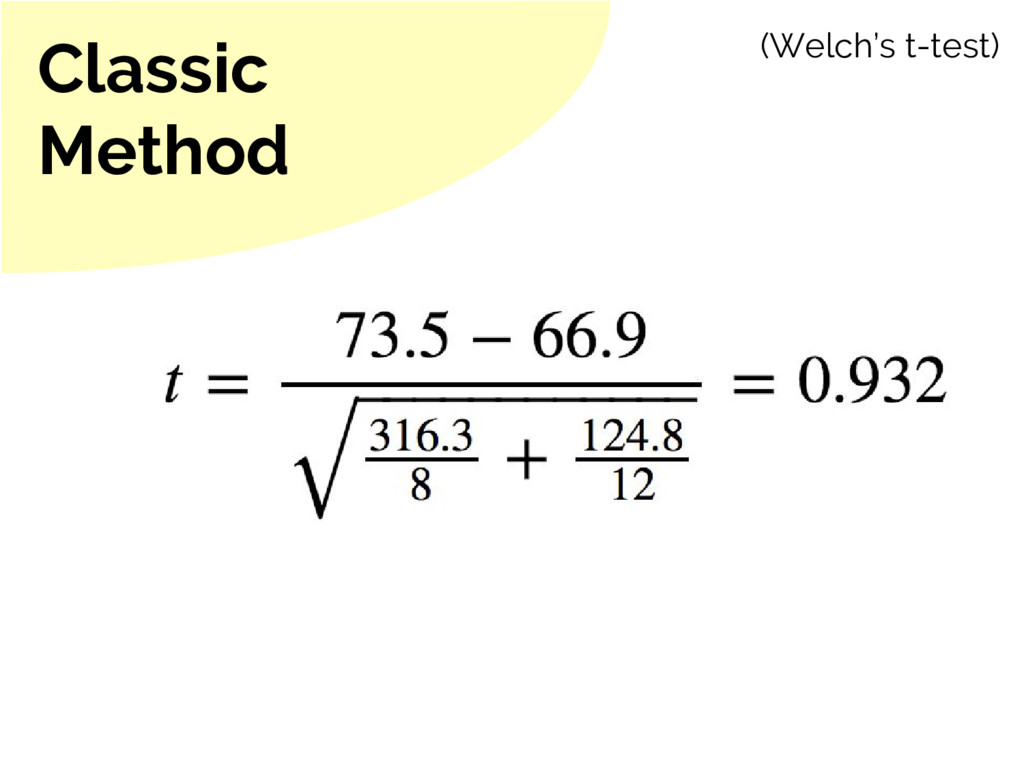
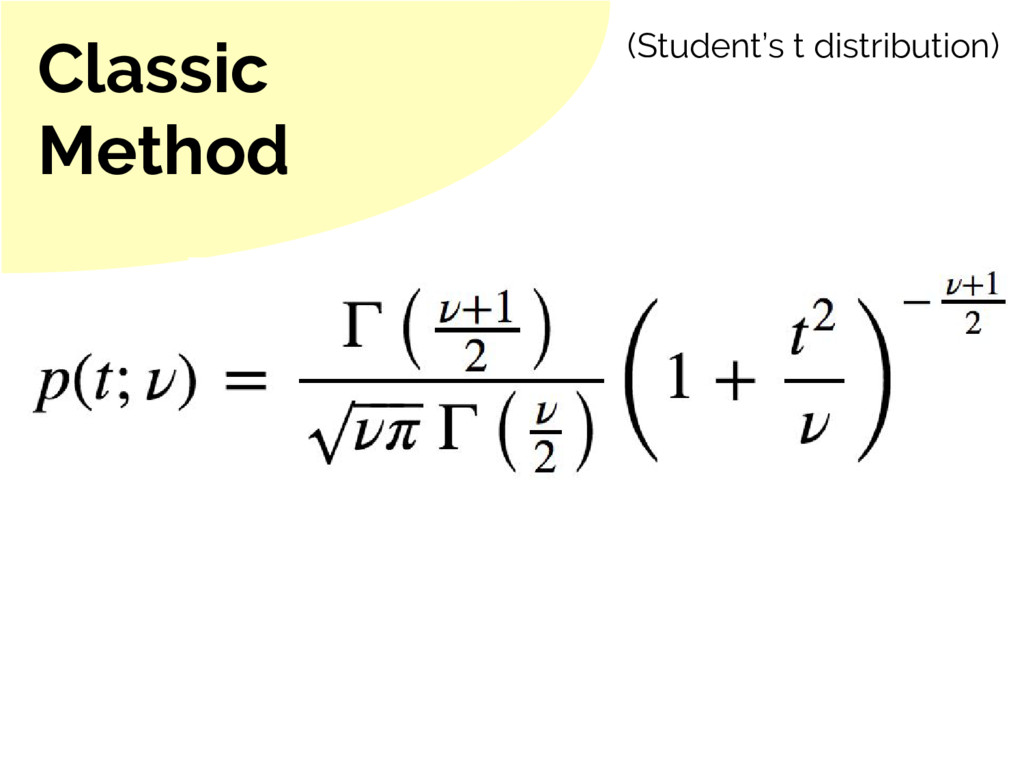
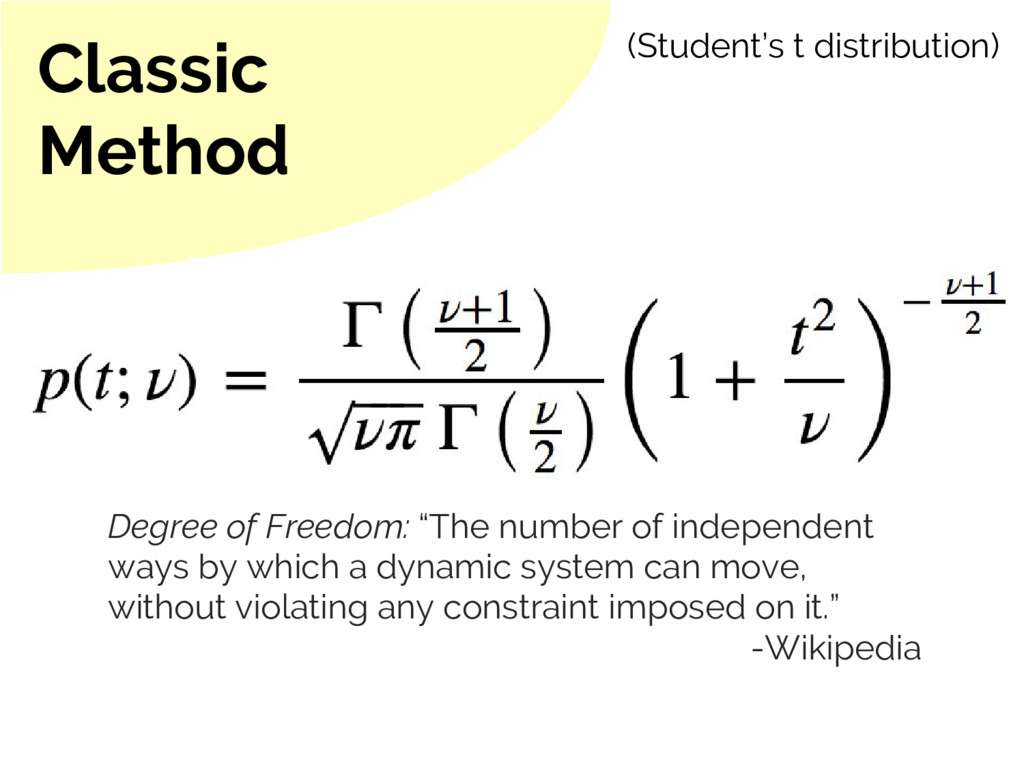
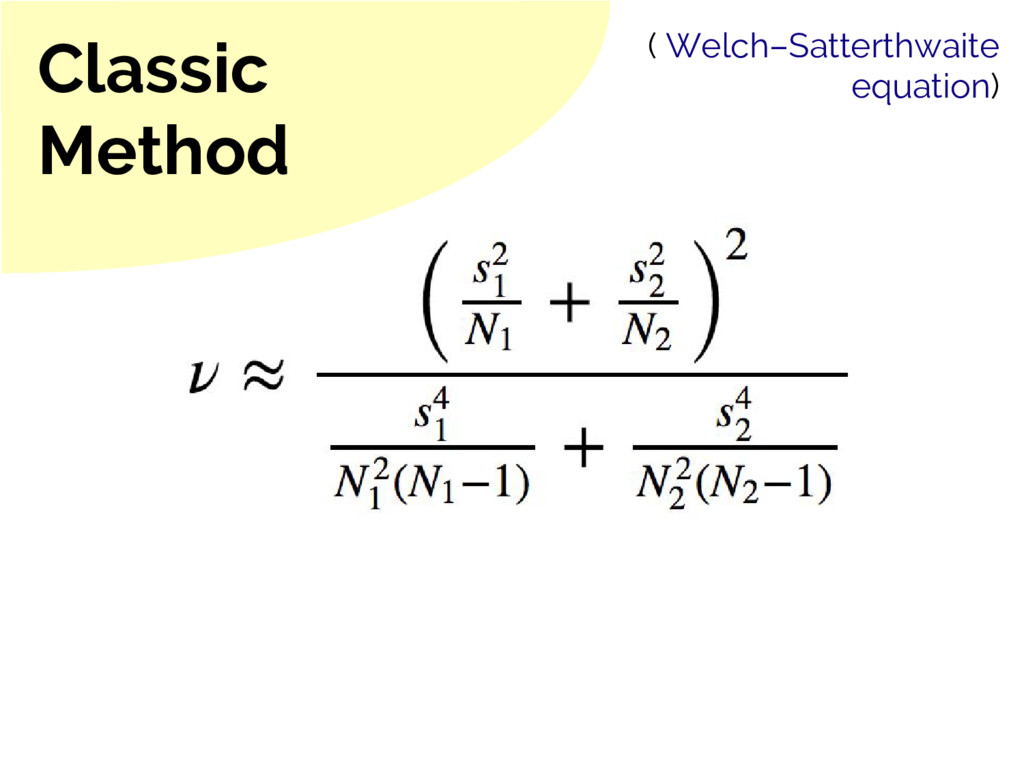
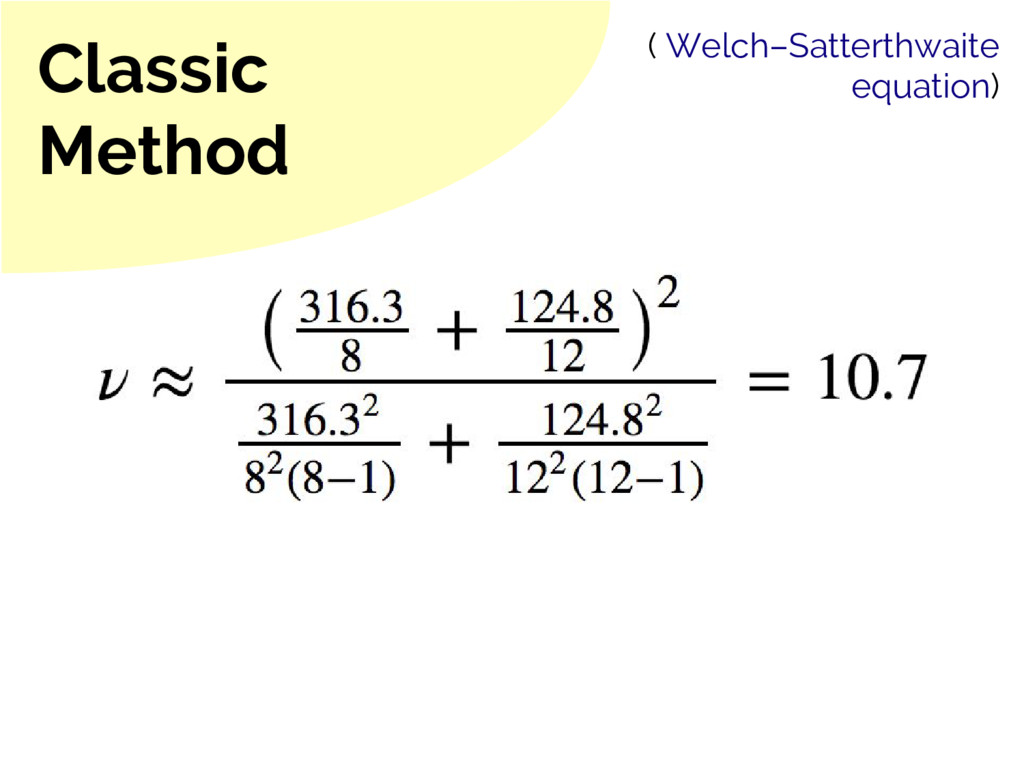
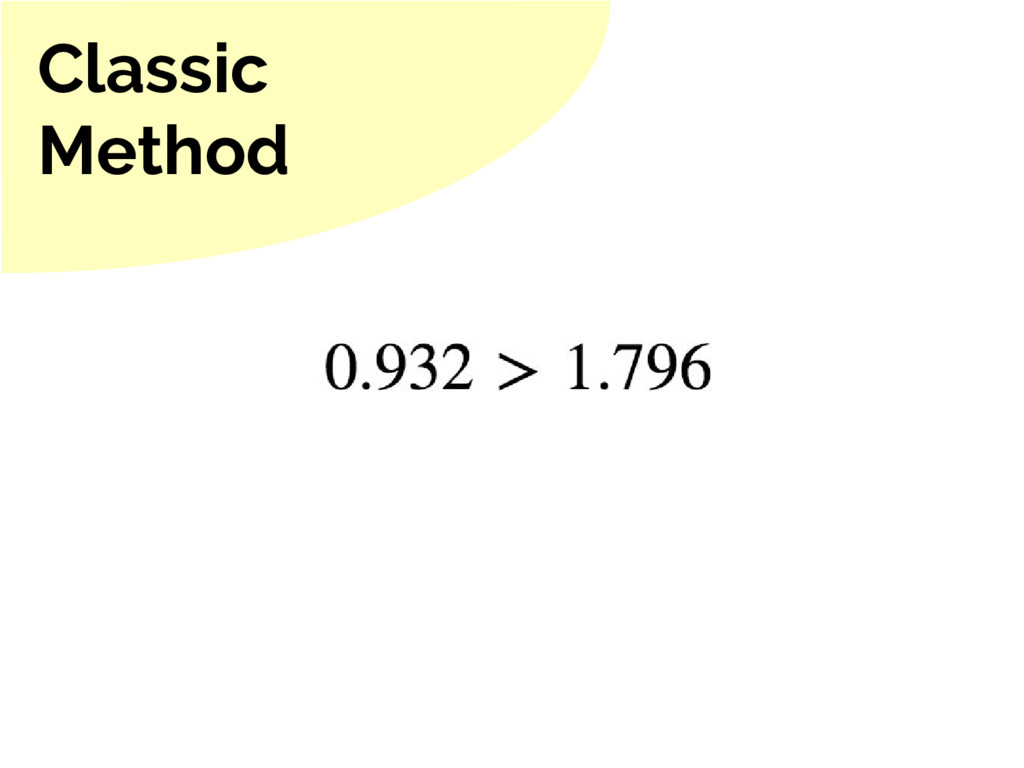
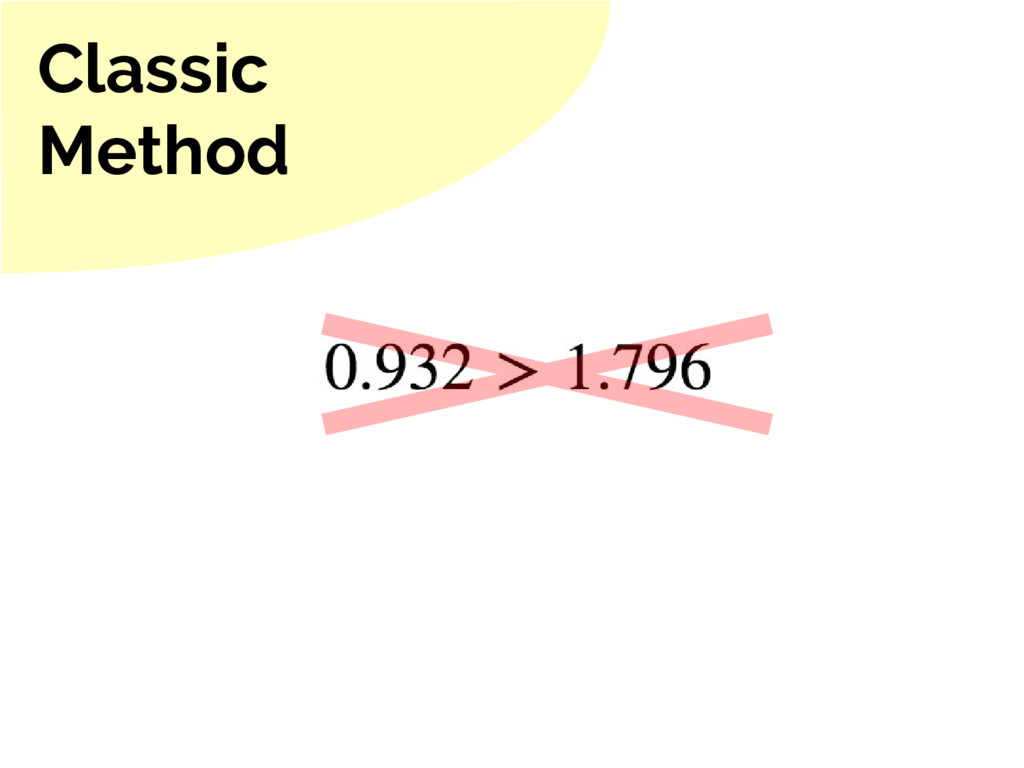
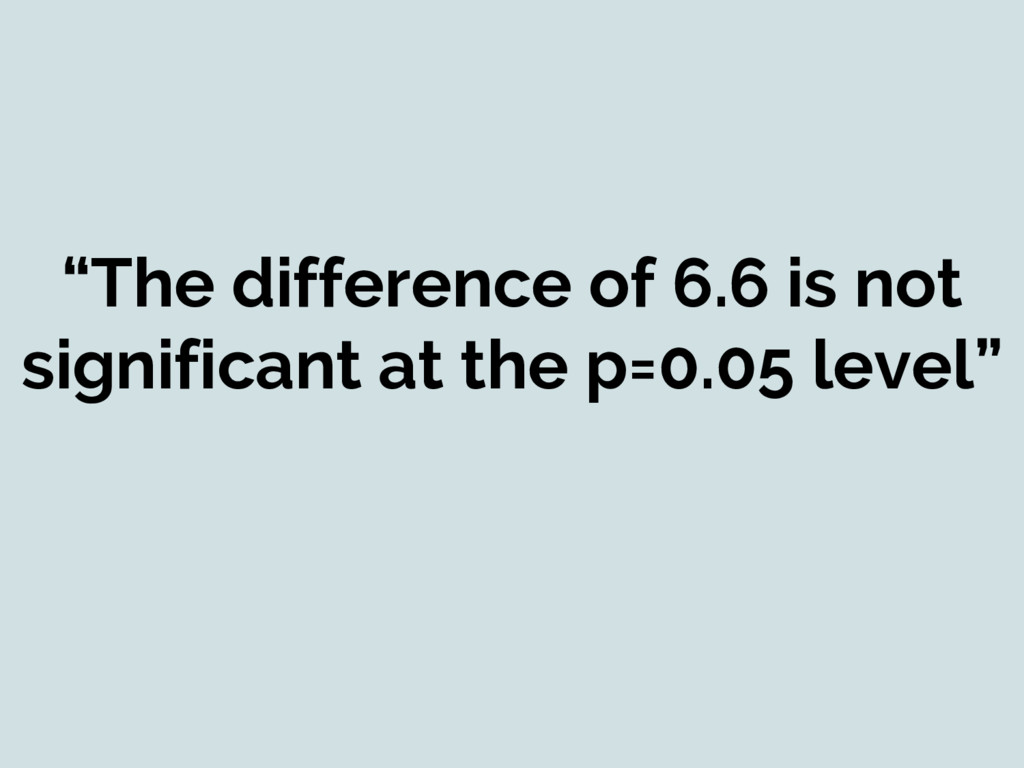
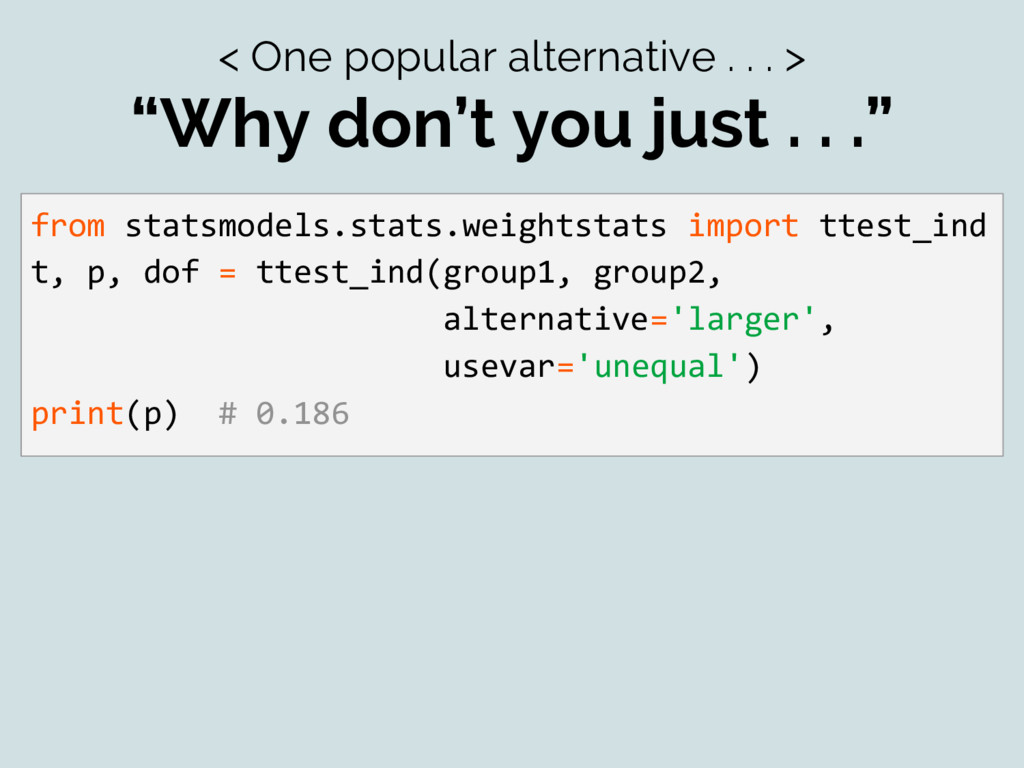
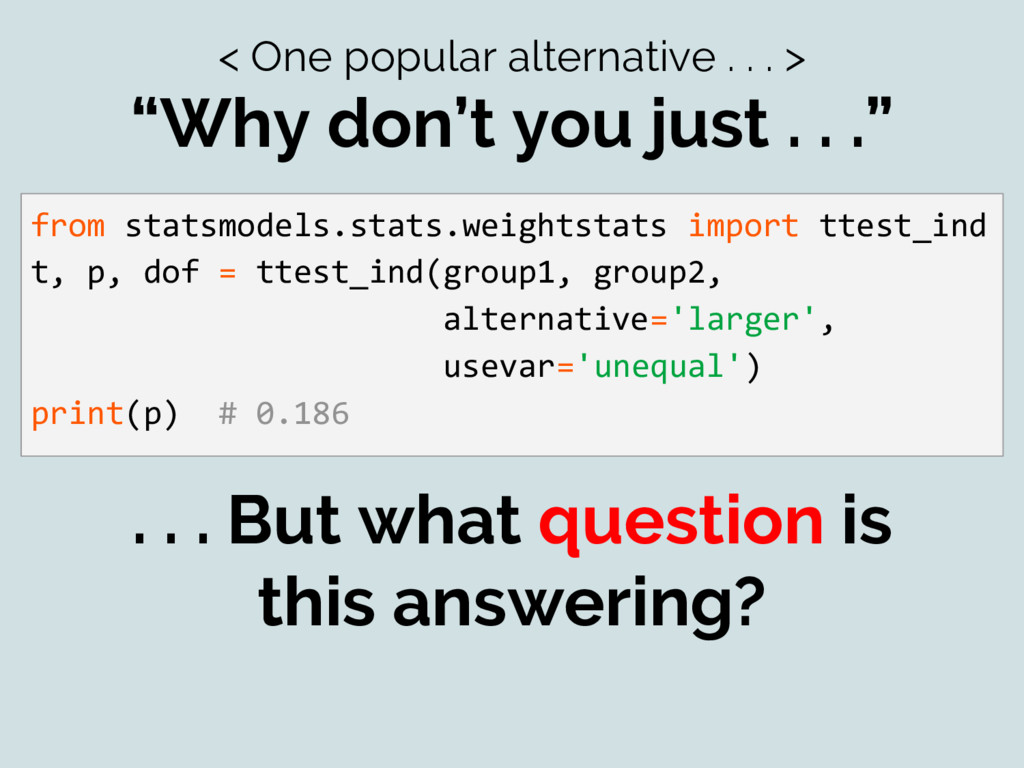
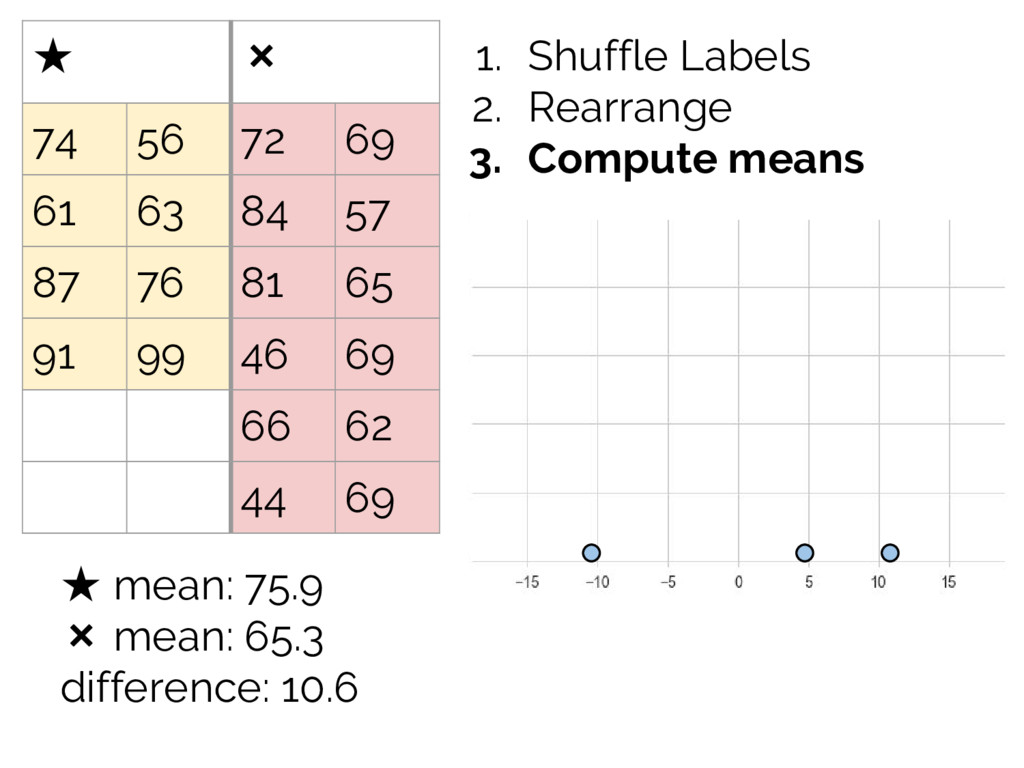
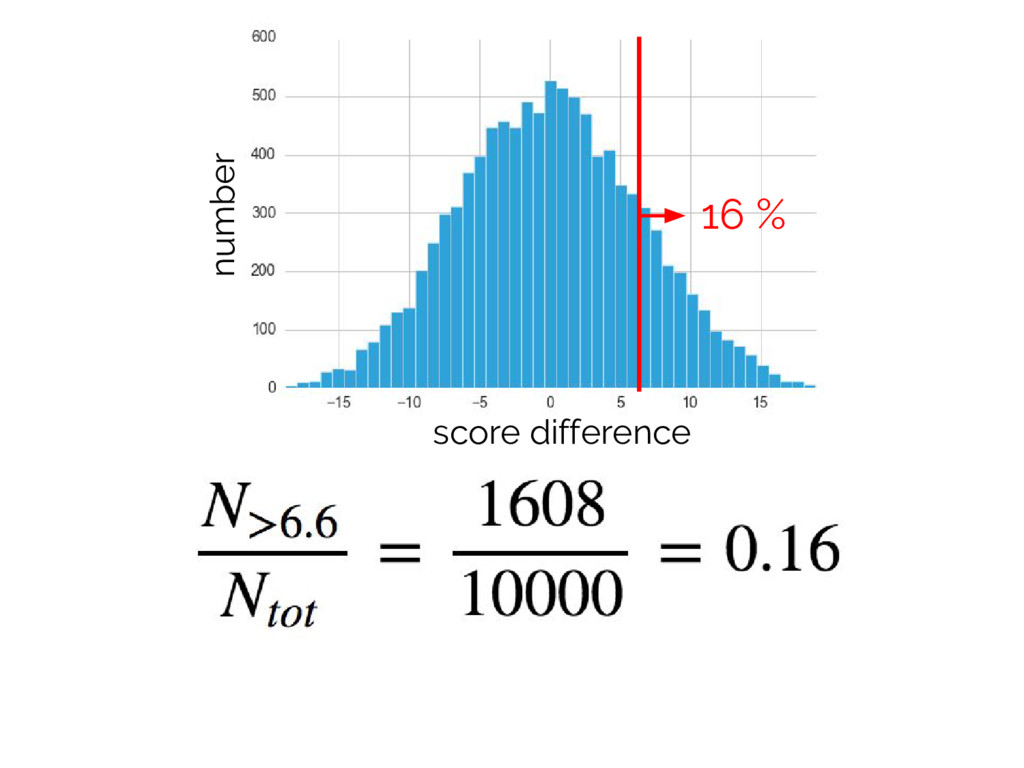
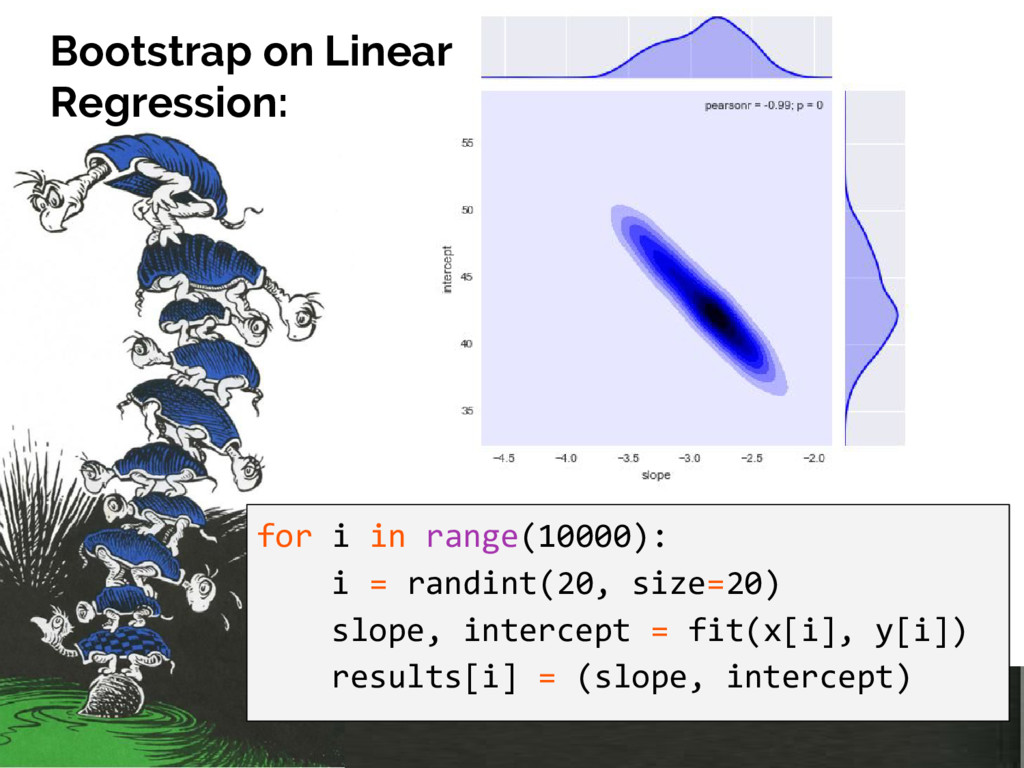
you just . . .” from statsmodels.stats.weightstats import ttest_ind t, p, dof = ttest_ind(group1, group2, alternative='larger', usevar='unequal') print(p) # 0.186 . . . But what question is this answering?
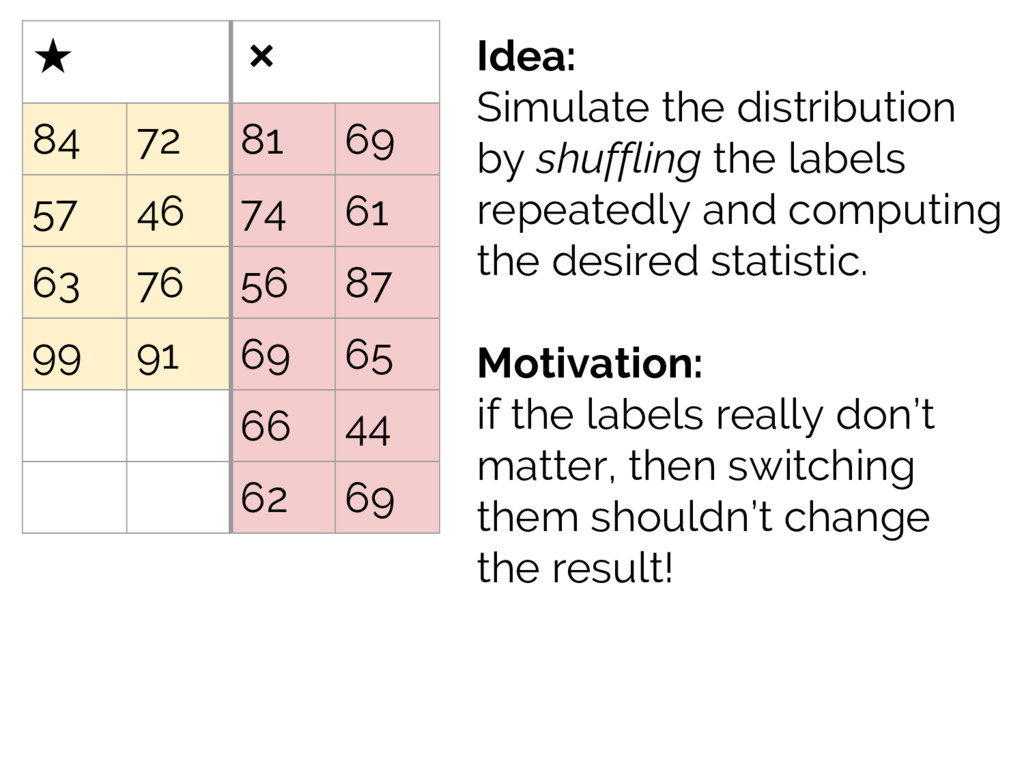
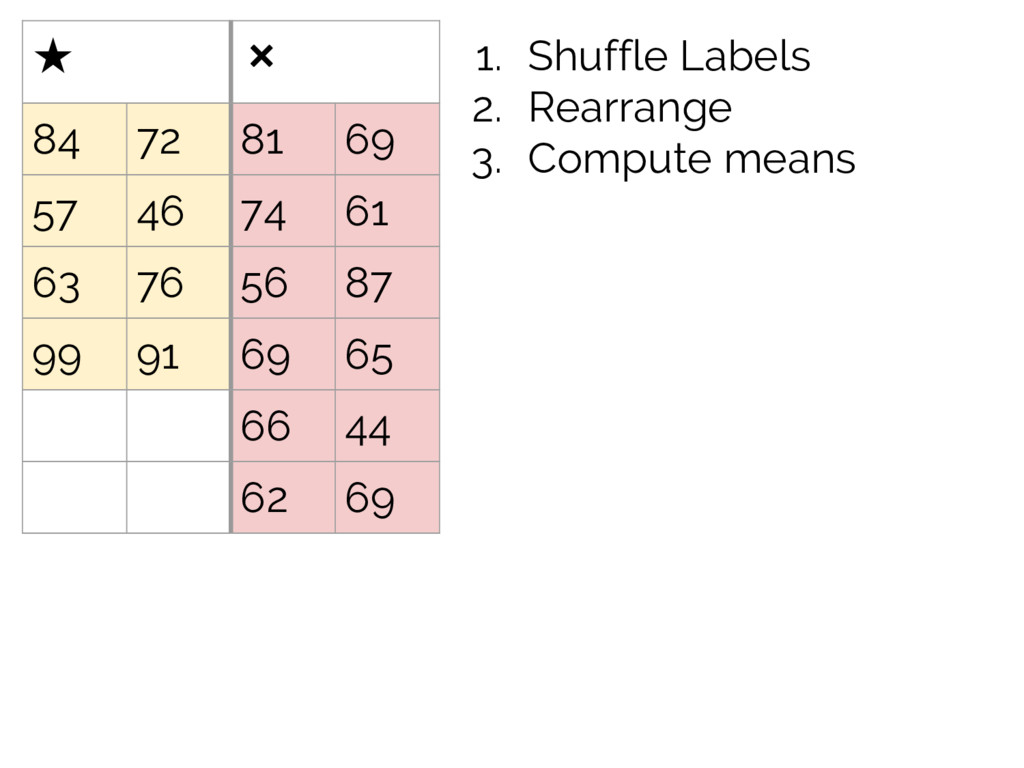
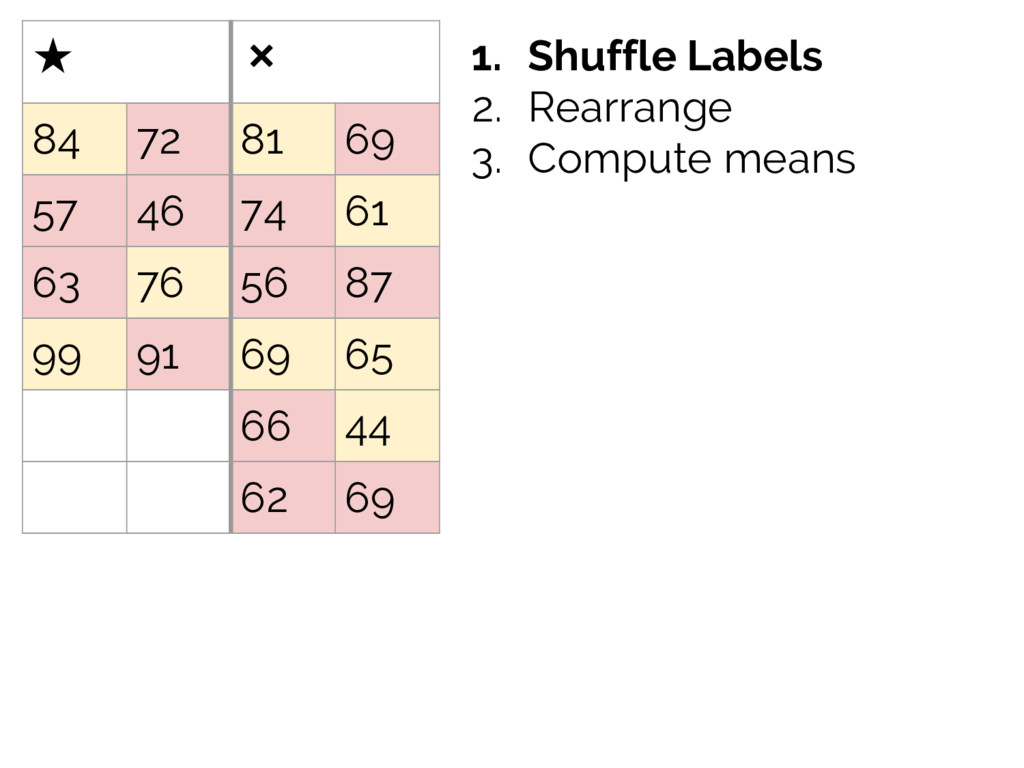
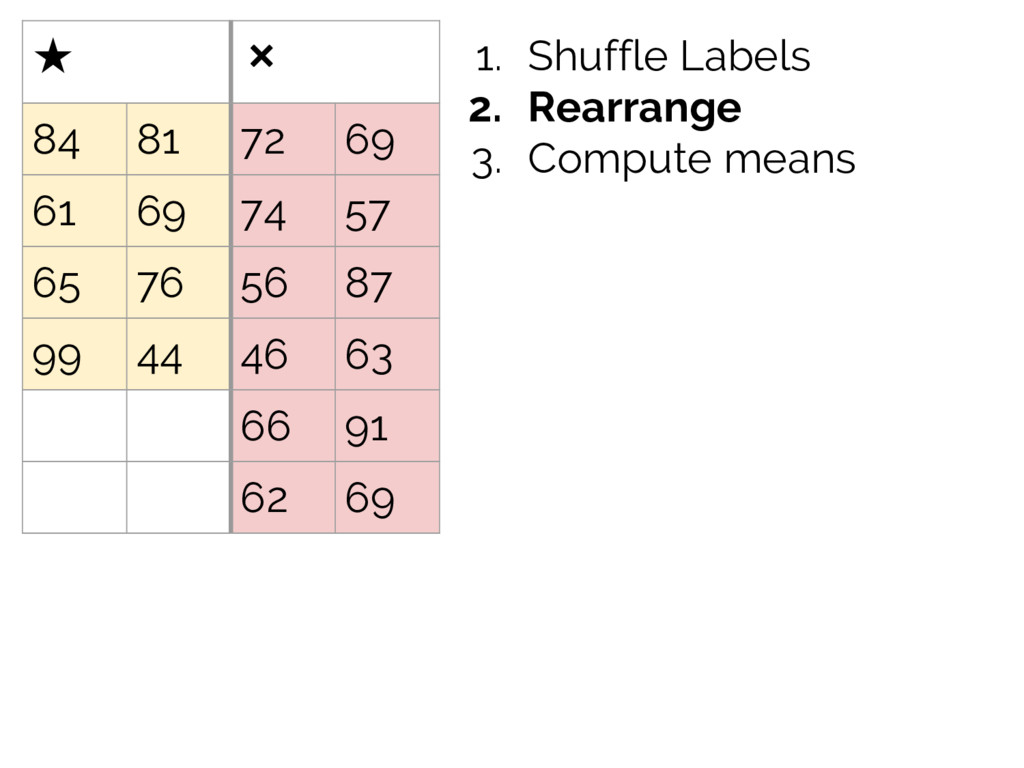
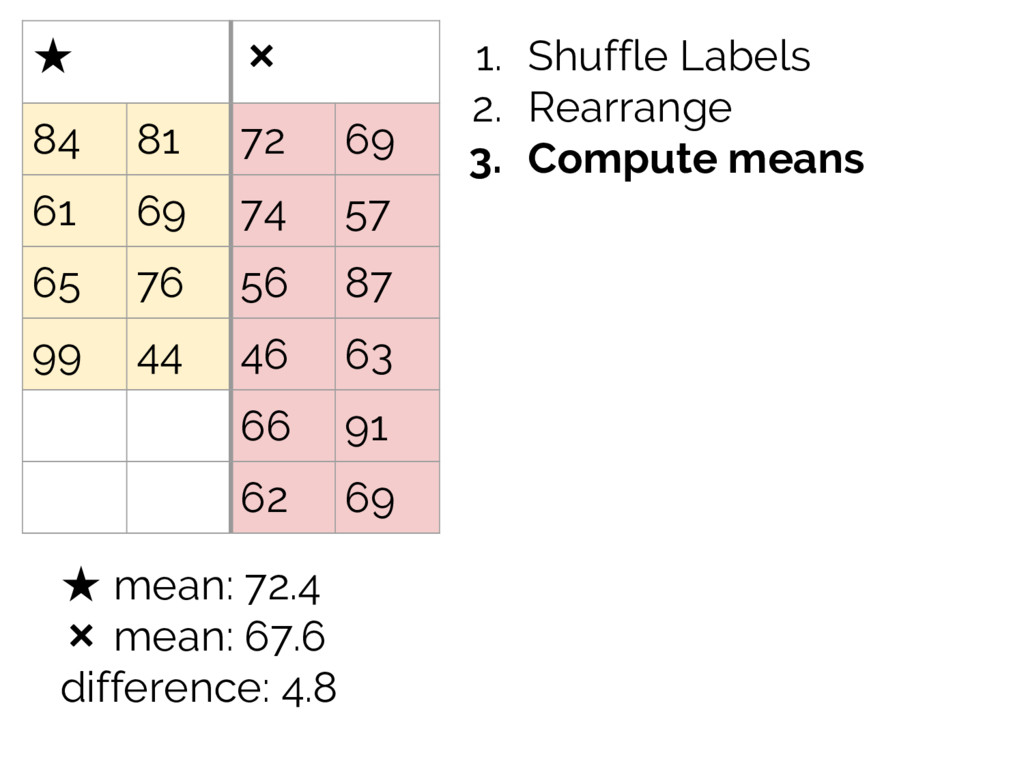
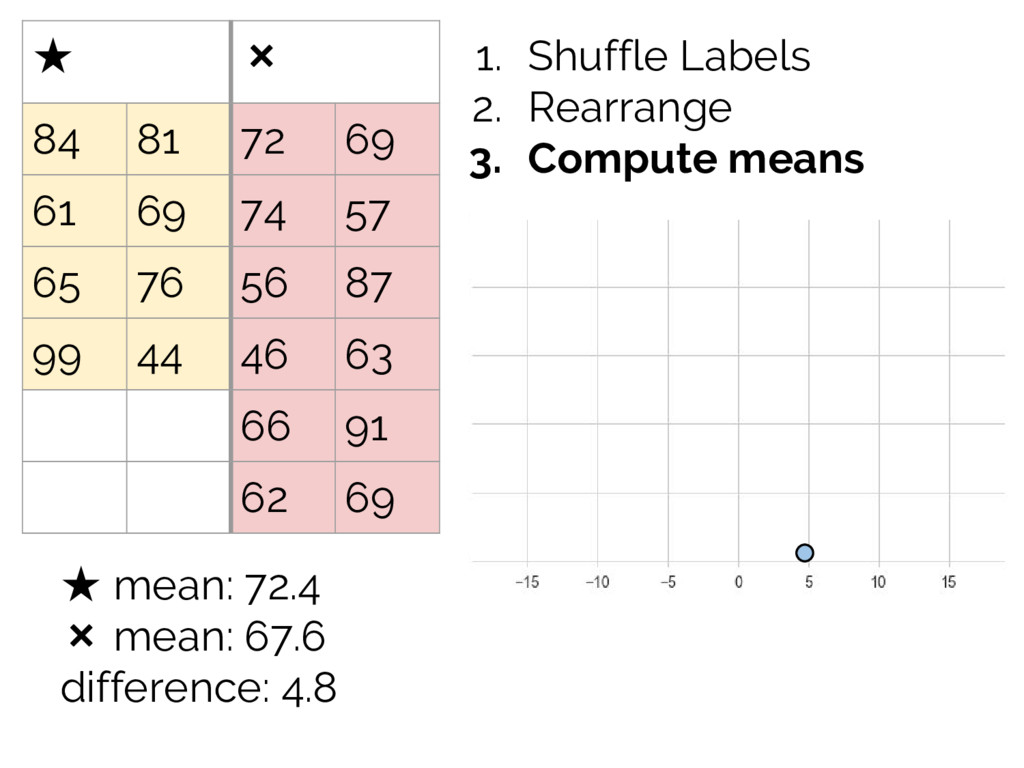
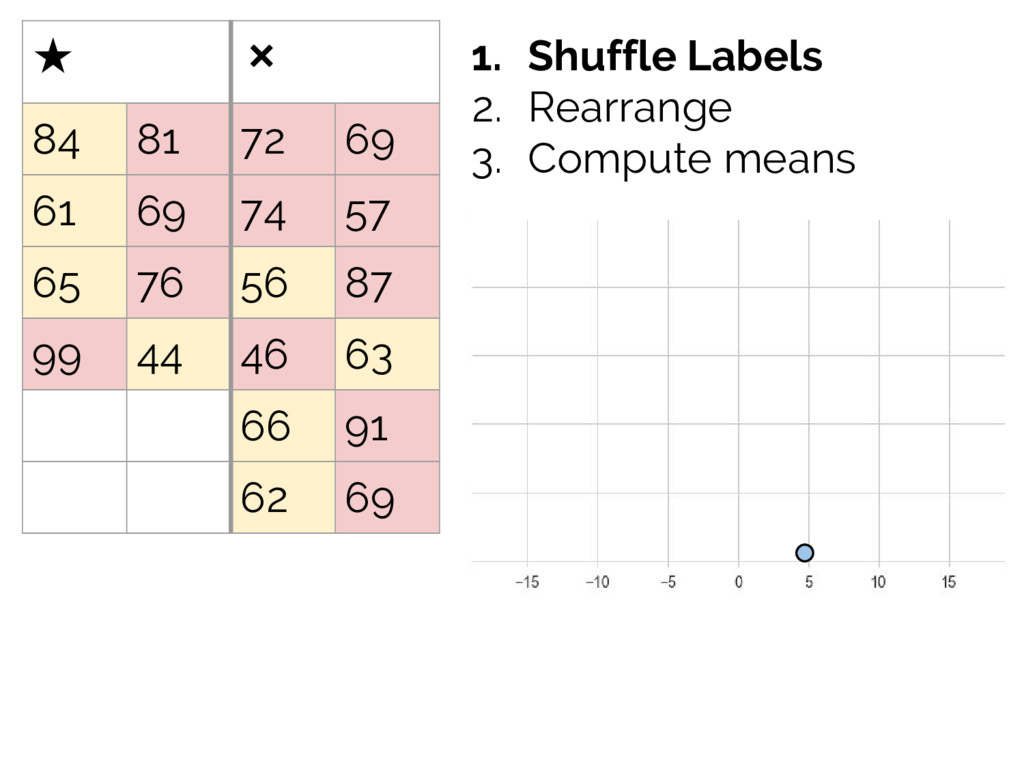
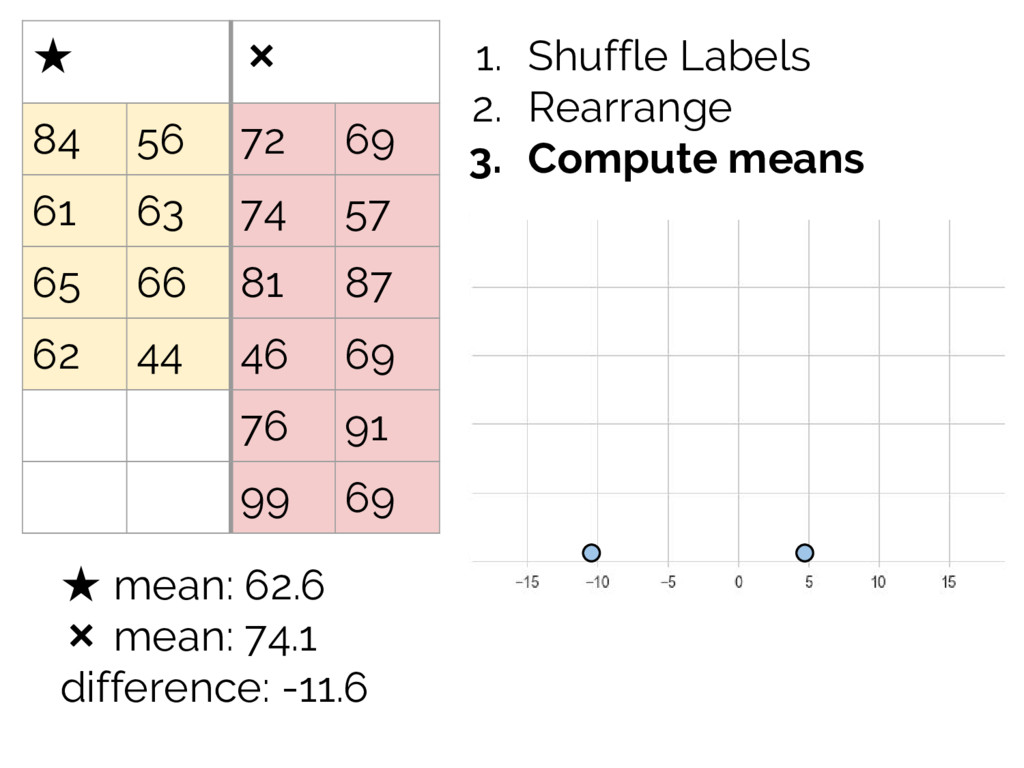
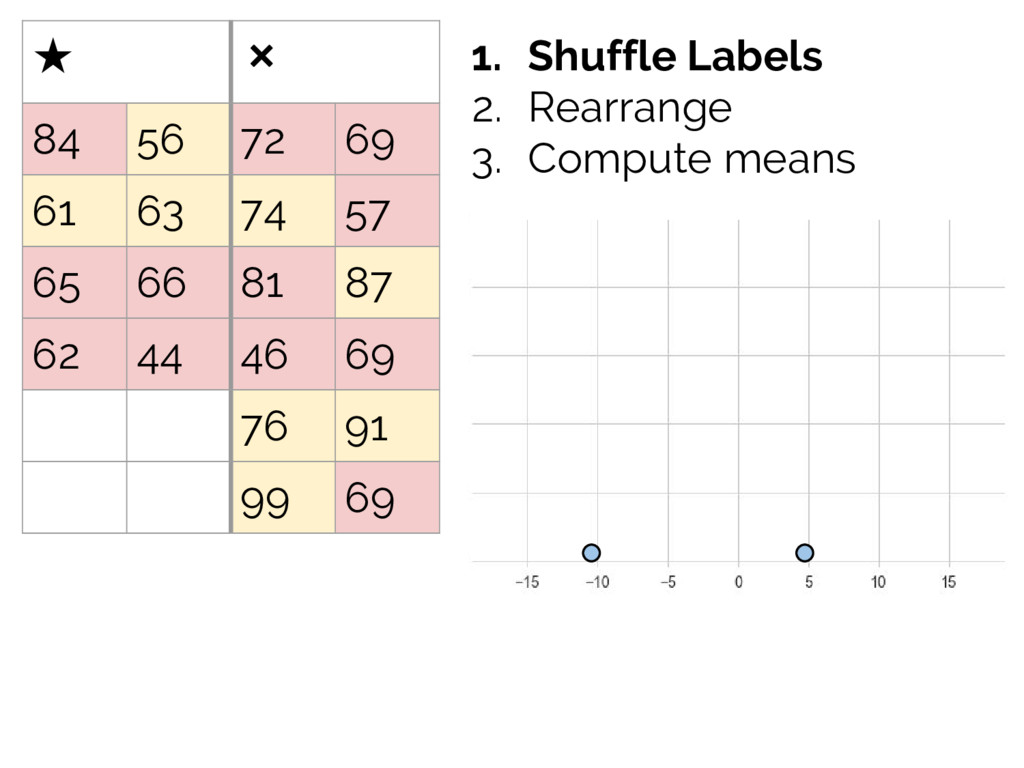
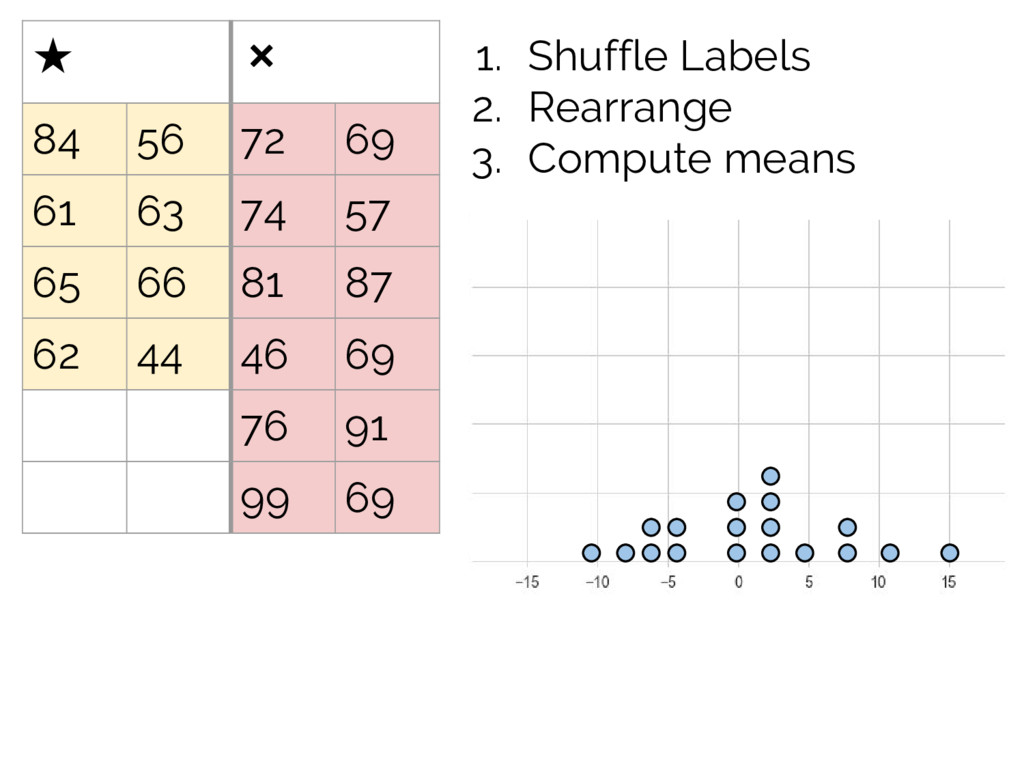
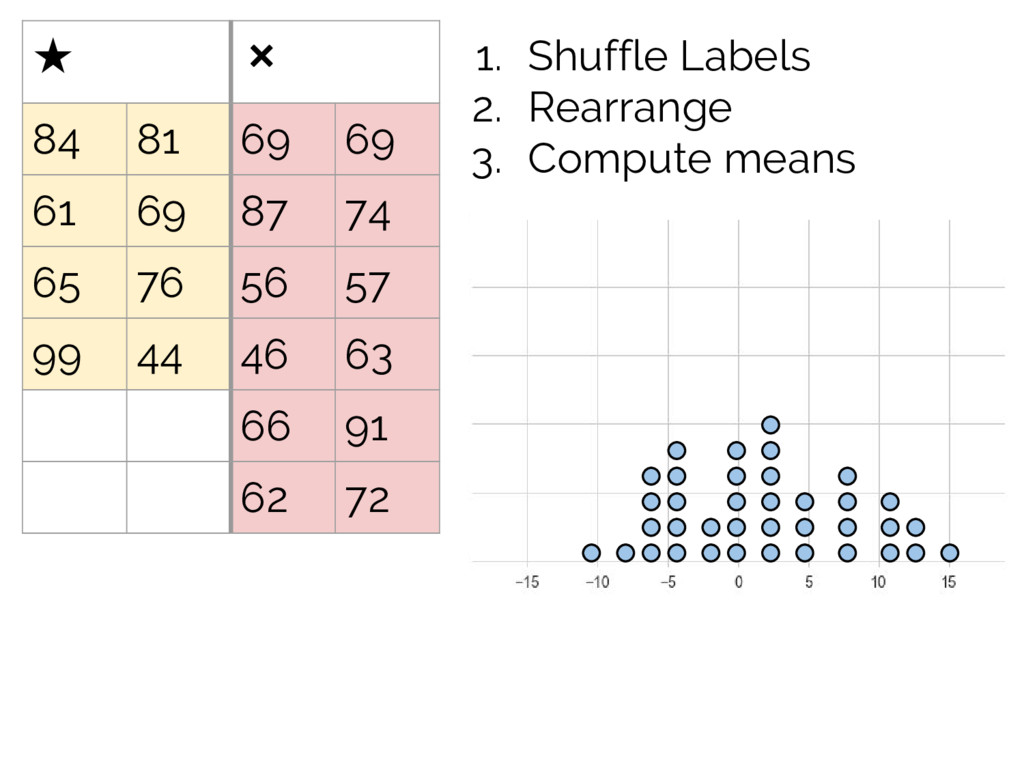
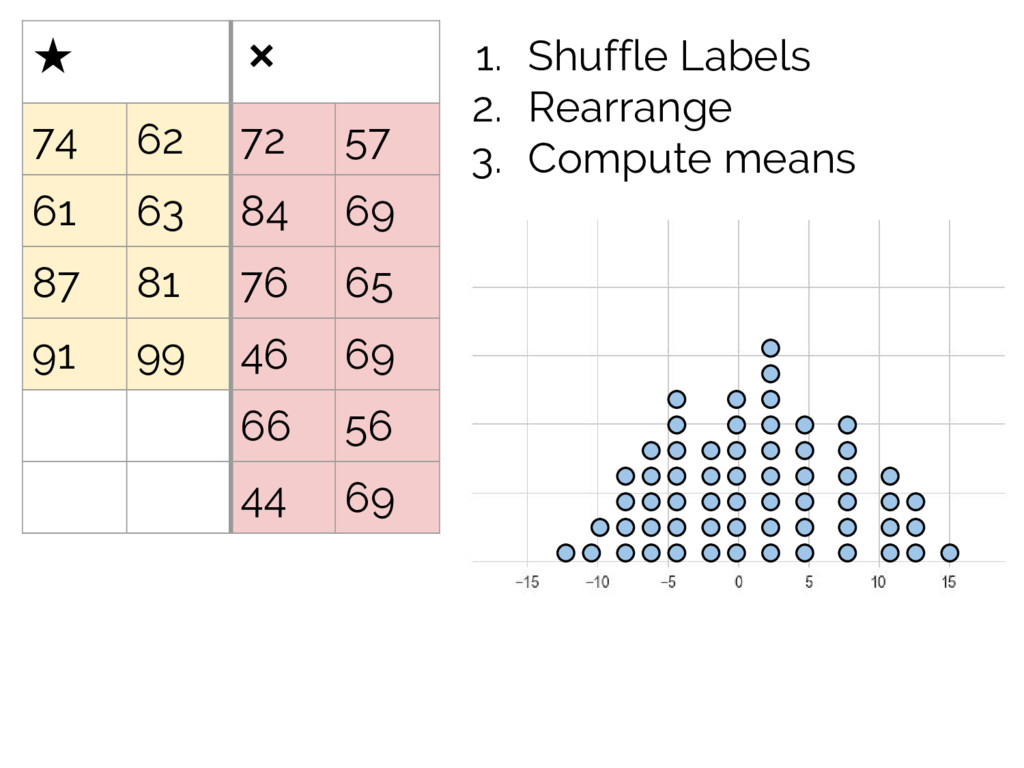
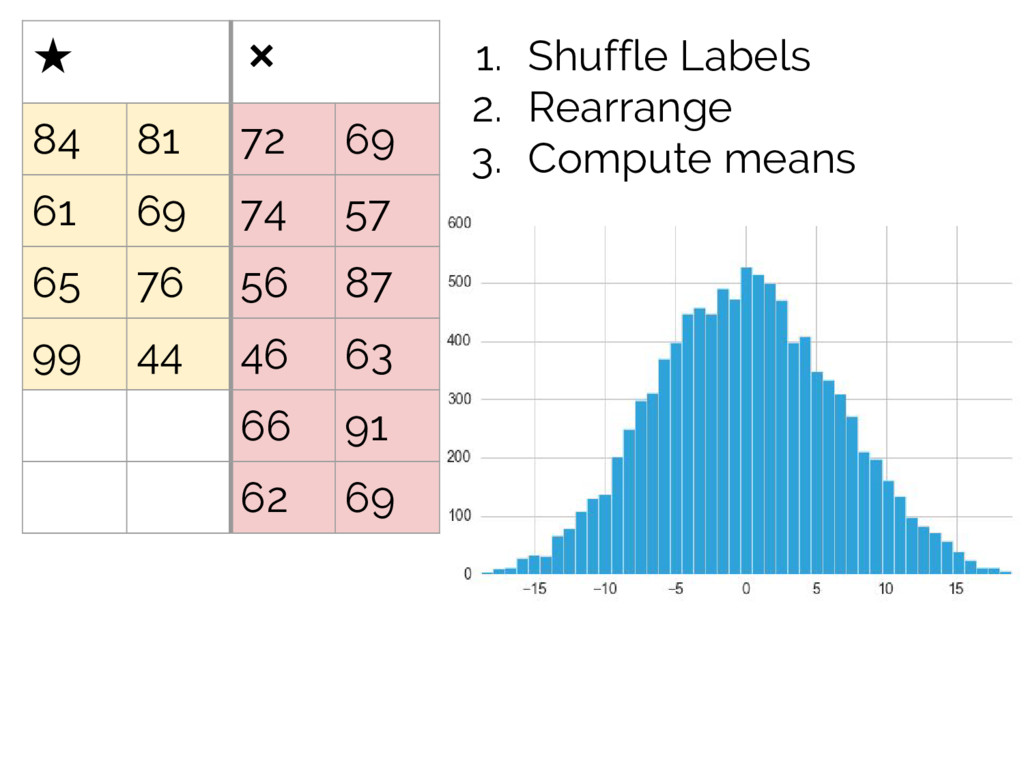
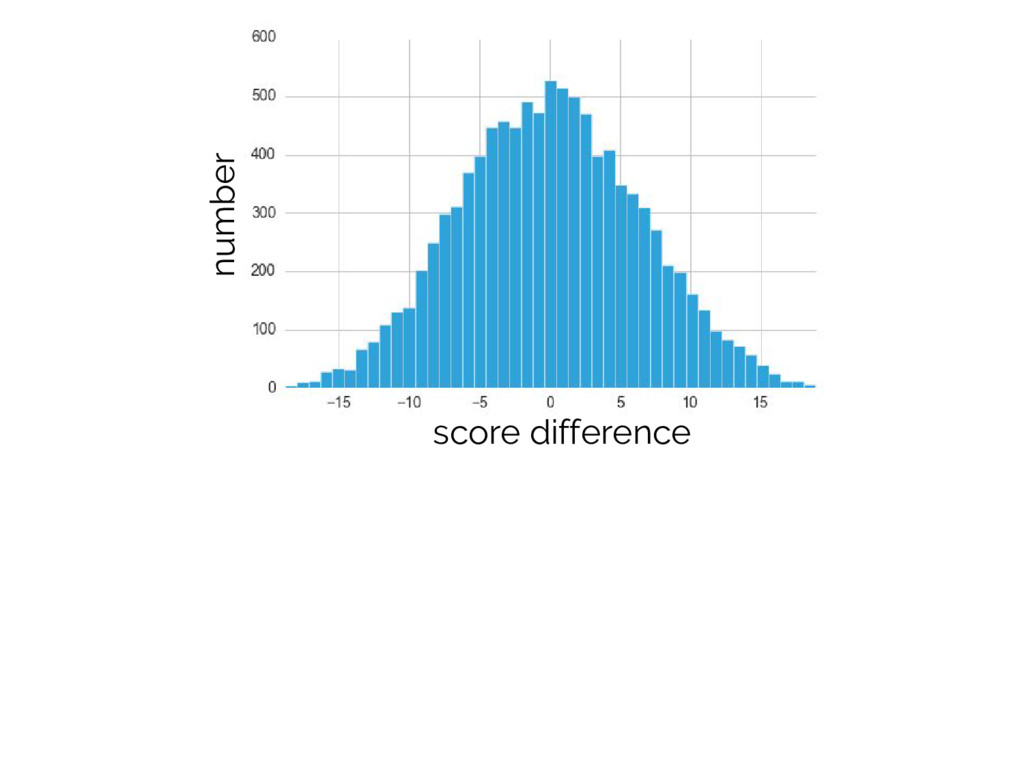
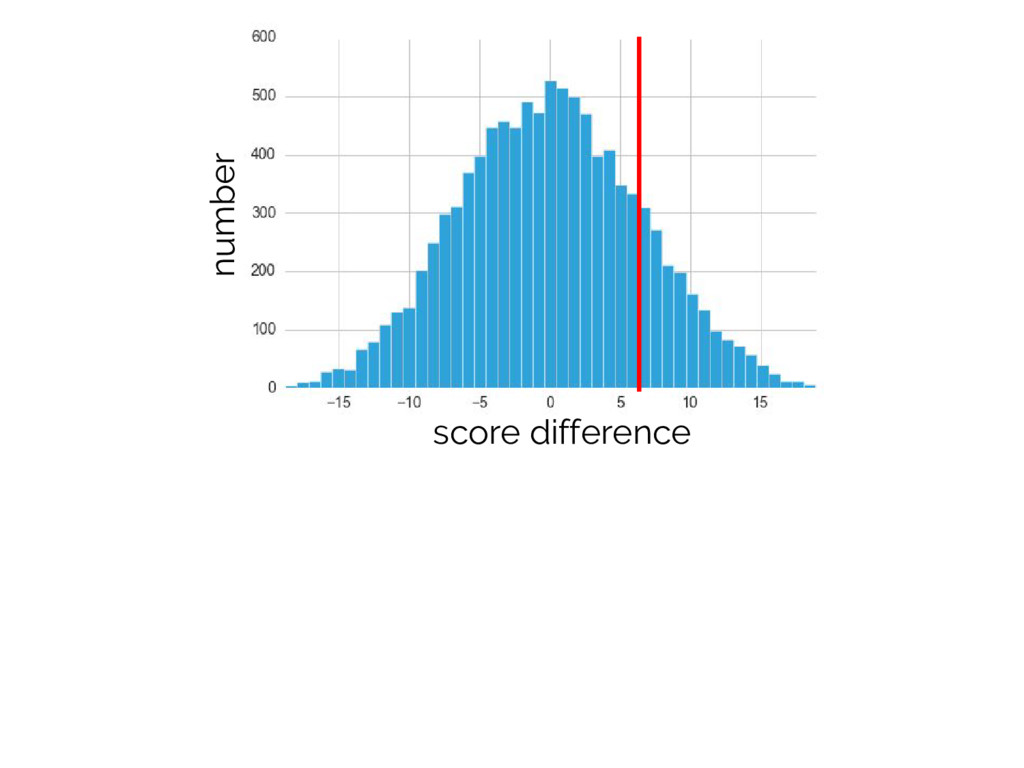
63 76 56 87 99 91 69 65 66 44 62 69 Idea: Simulate the distribution by shuffling the labels repeatedly and computing the desired statistic. Motivation: if the labels really don’t matter, then switching them shouldn’t change the result!
two groups are equivalent - Like all methods, it will only work if your samples are representative – always be careful about selection biases! - Needs care for non-independent trials. Good discussion in Simon’s Resampling: The New Statistics
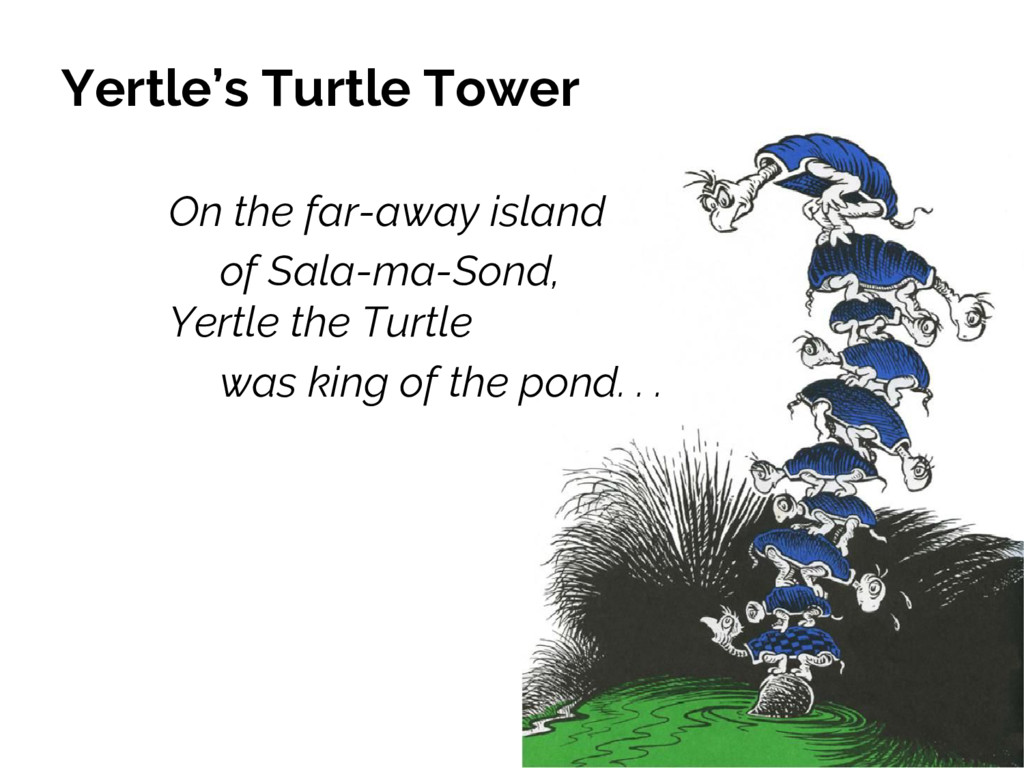
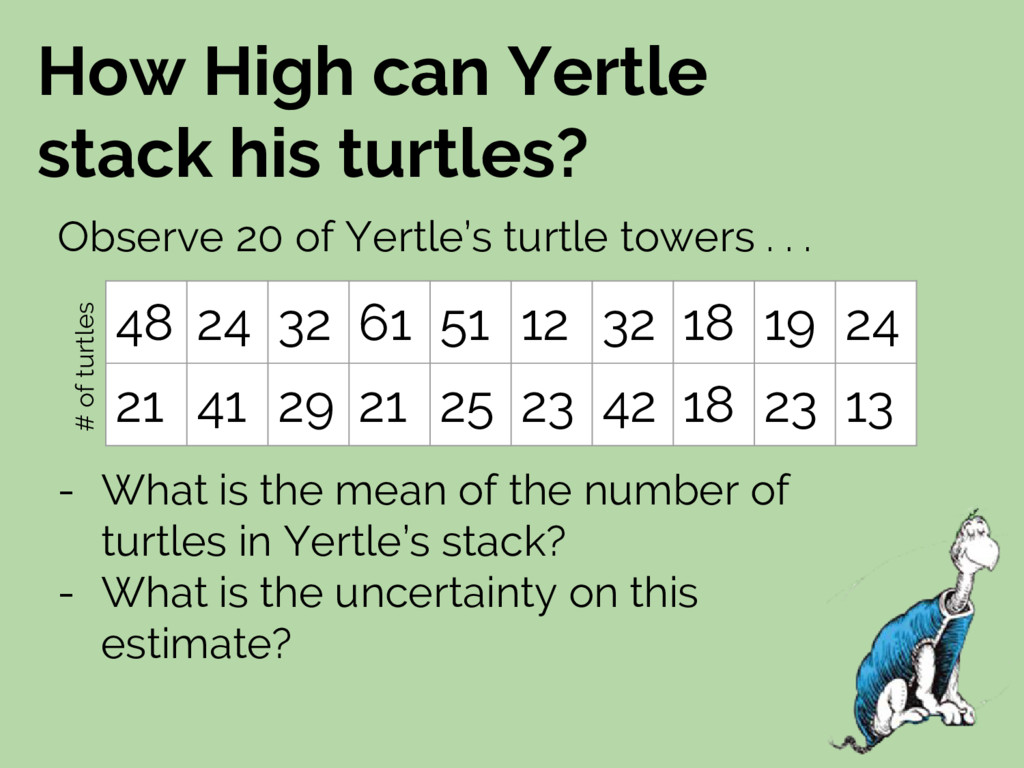
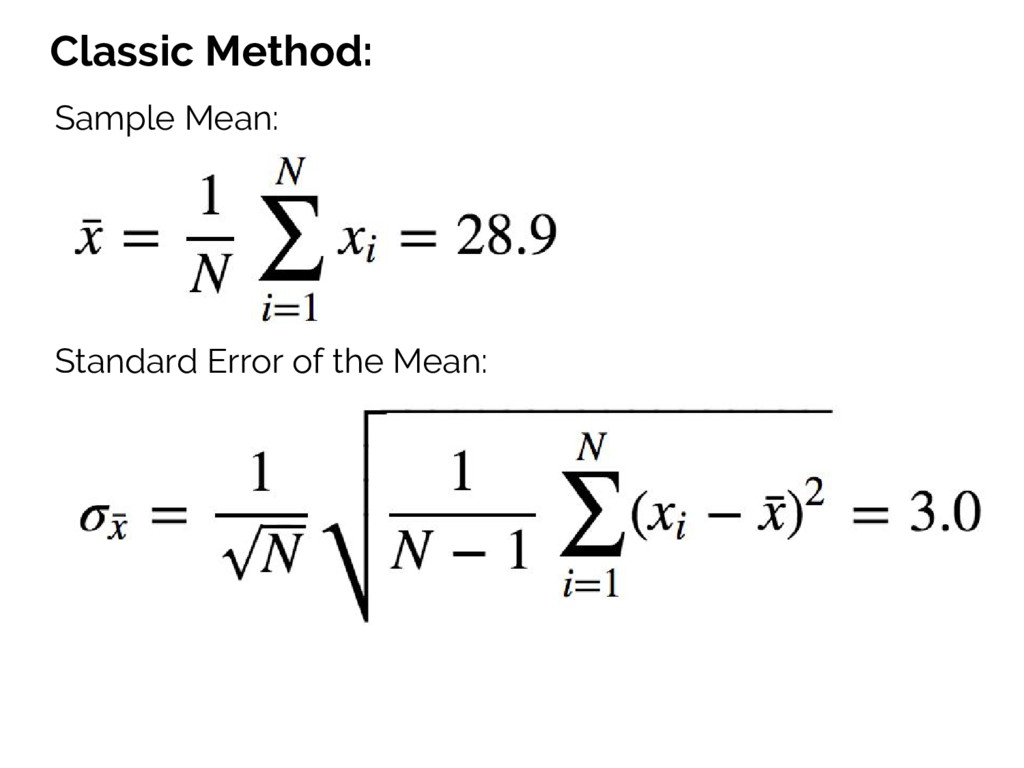
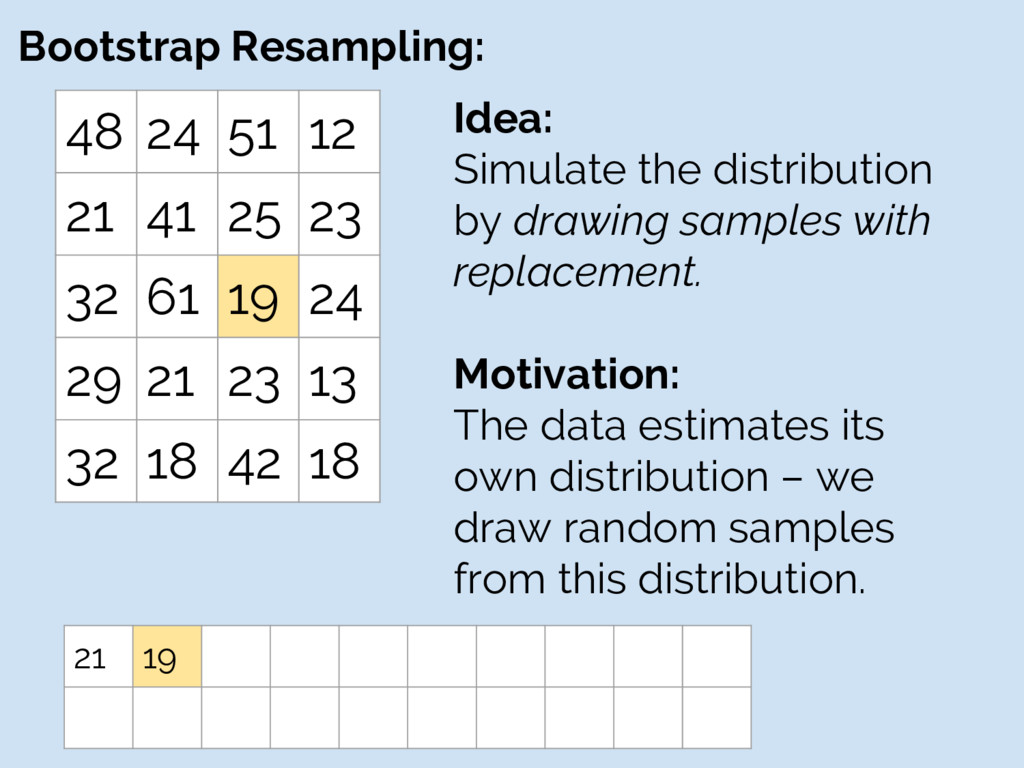
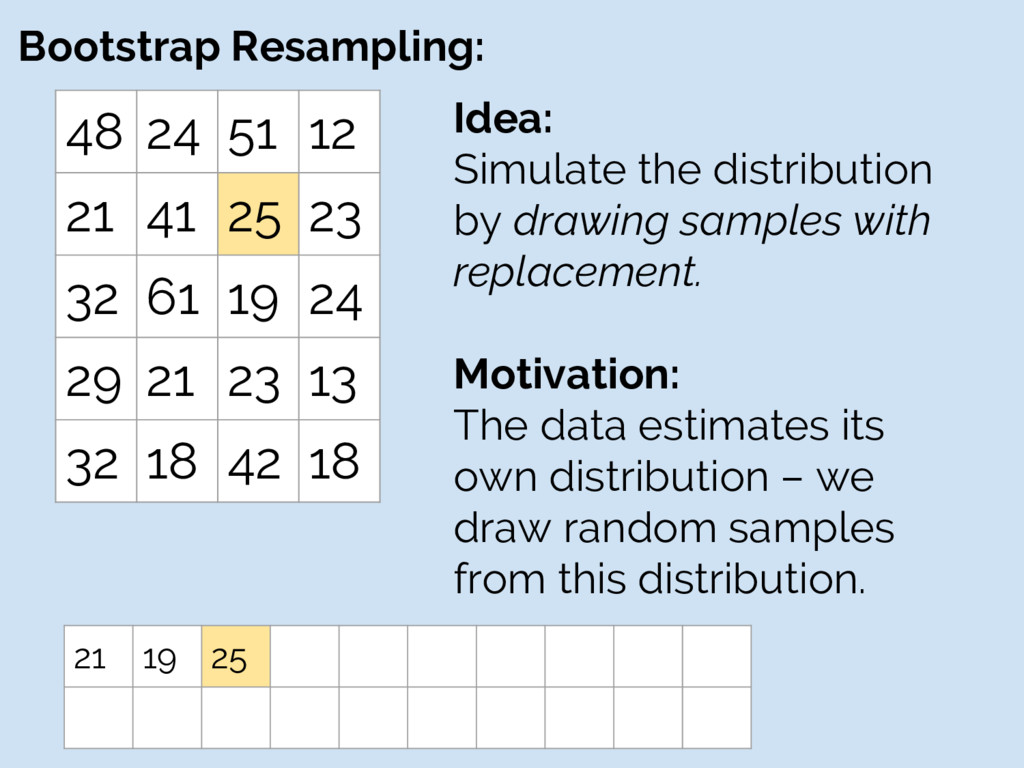
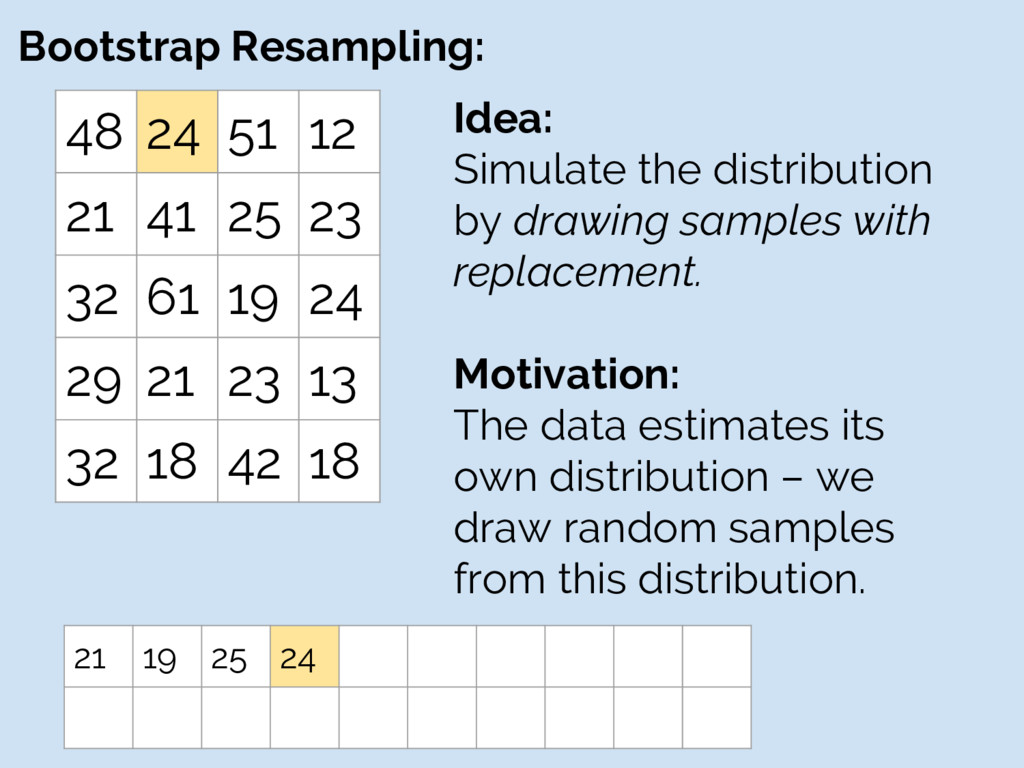
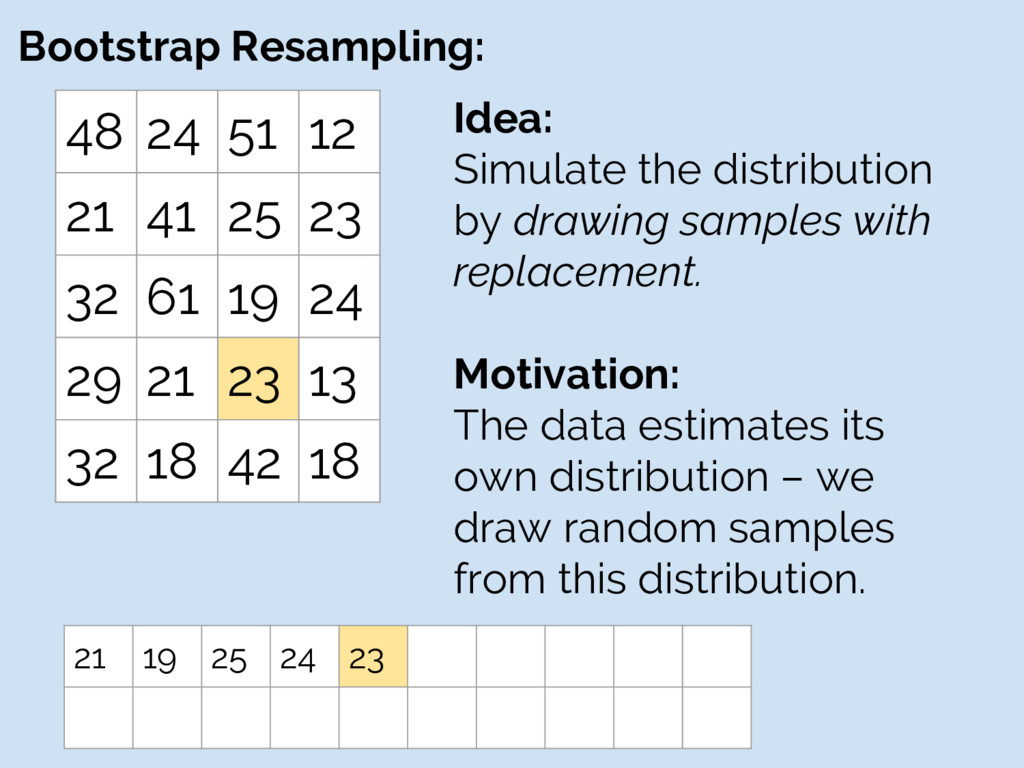
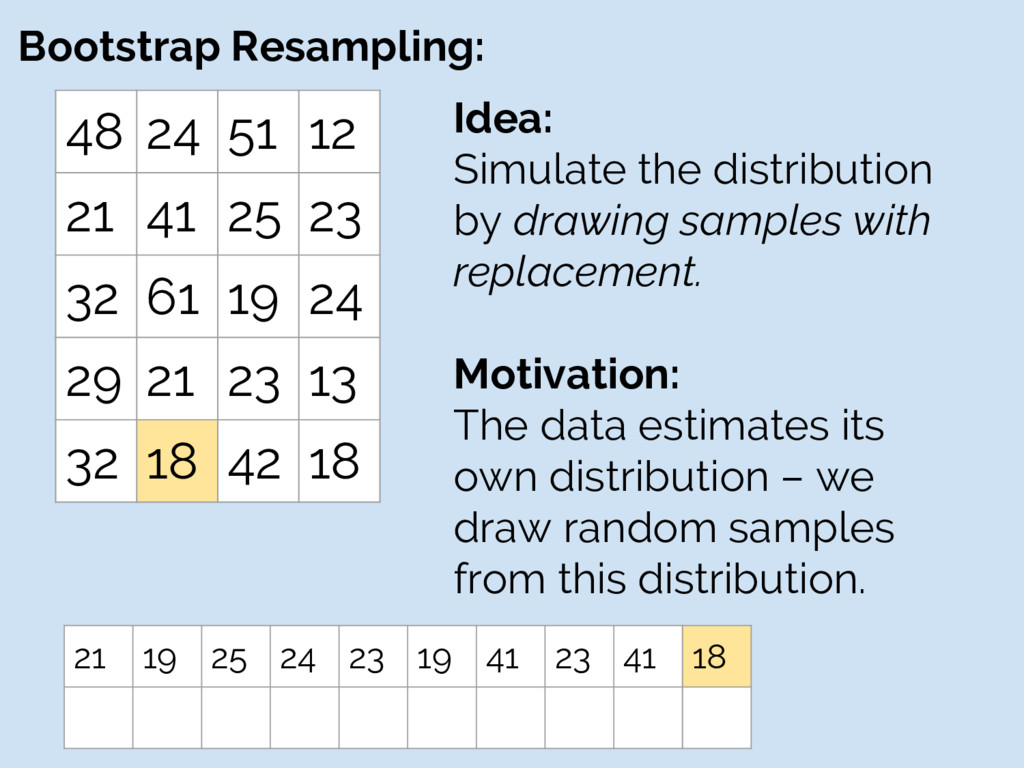
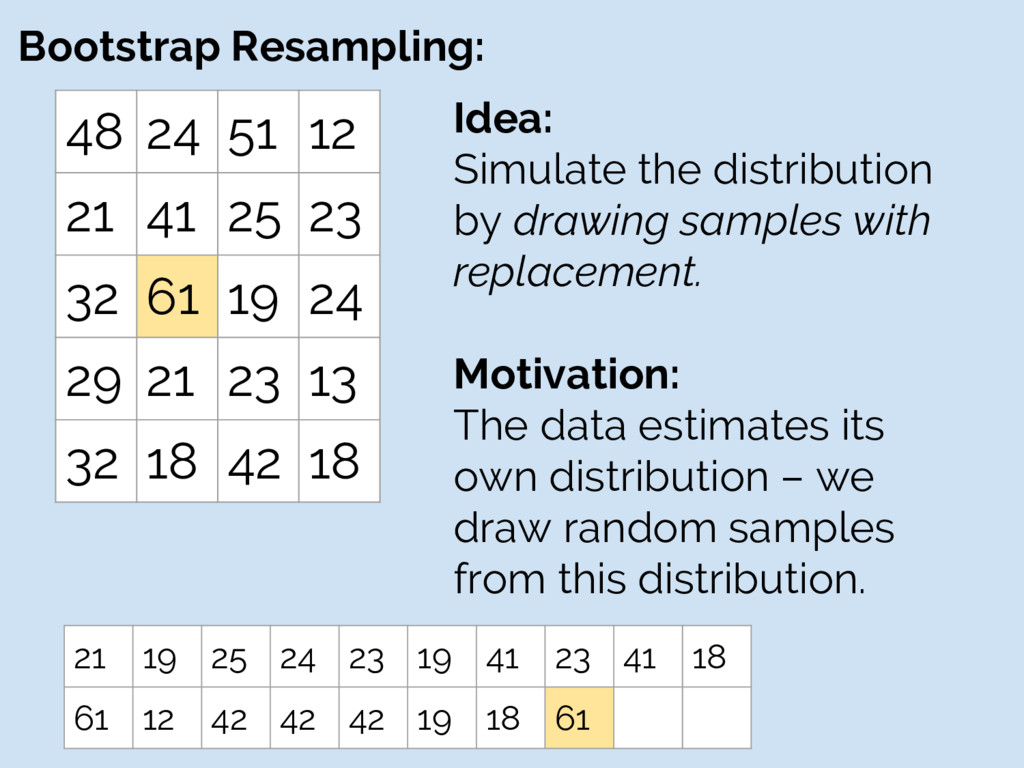
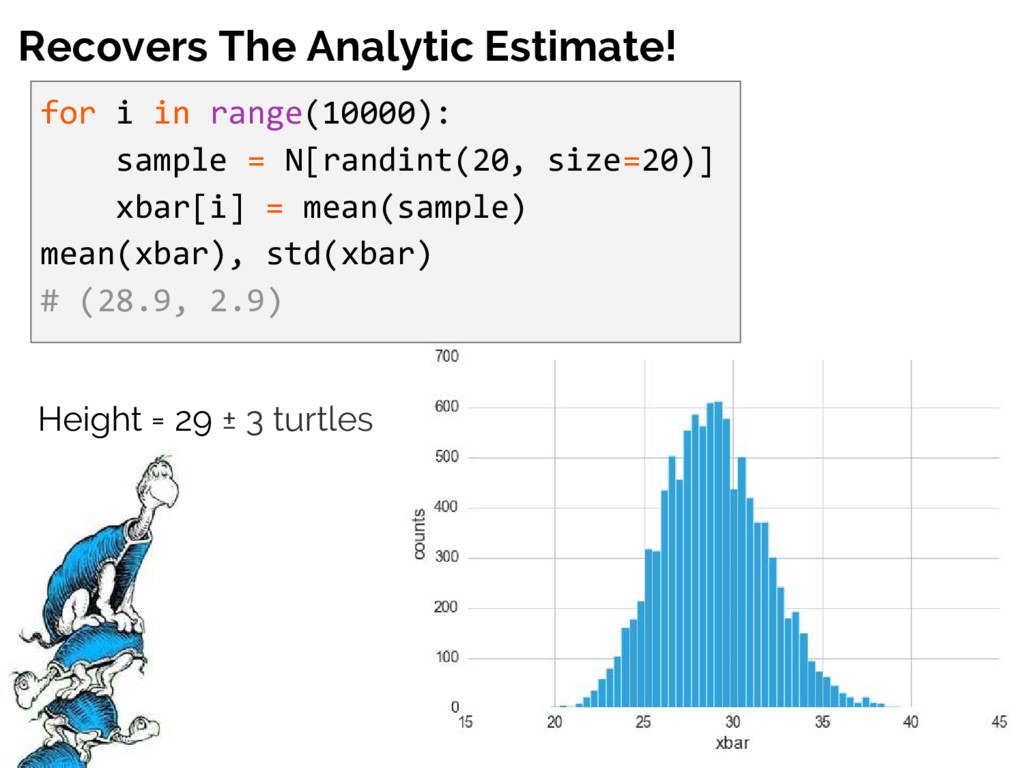
the mean of the number of turtles in Yertle’s stack? - What is the uncertainty on this estimate? 48 24 32 61 51 12 32 18 19 24 21 41 29 21 25 23 42 18 23 13 Observe 20 of Yertle’s turtle towers . . . # of turtles
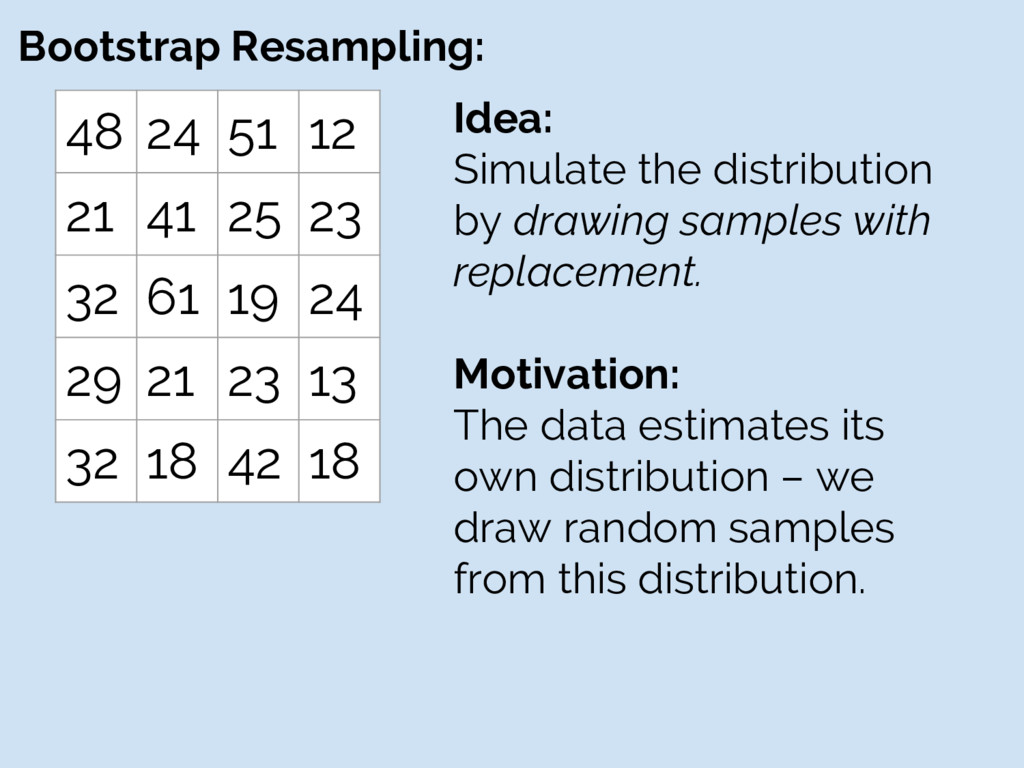
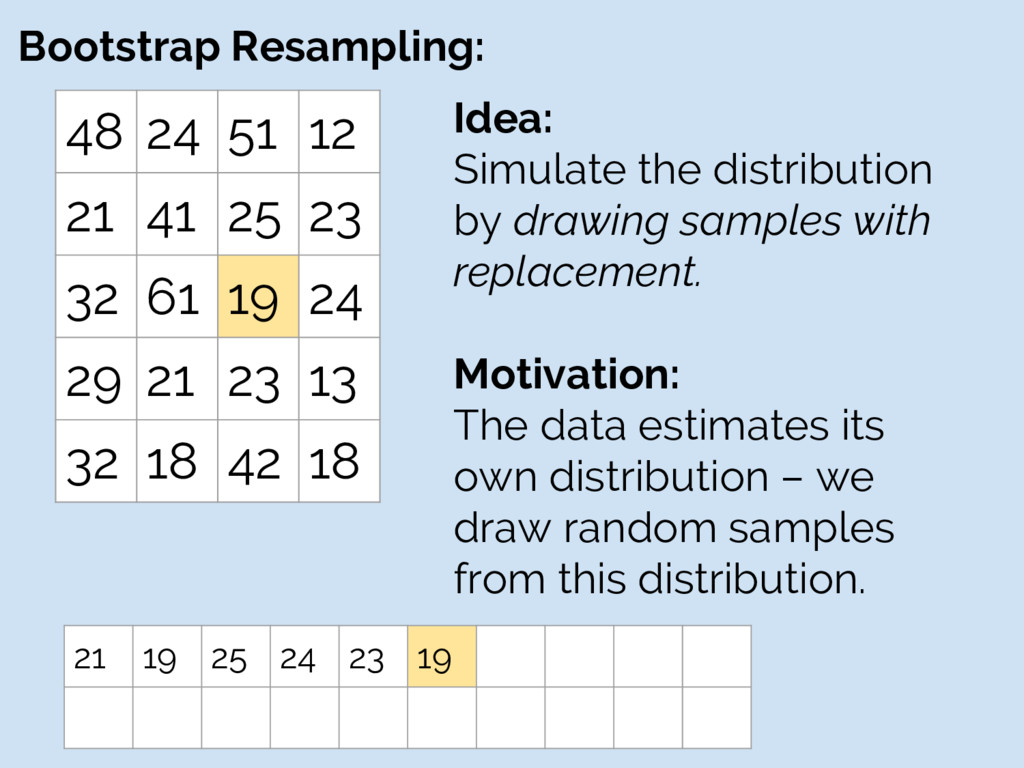
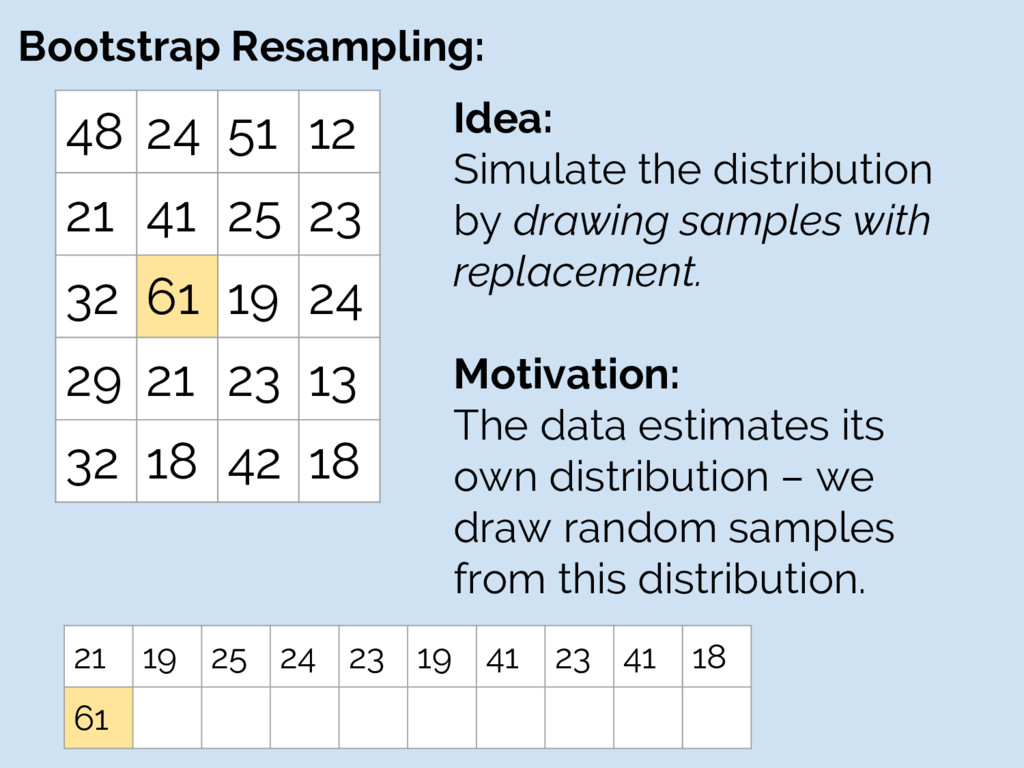
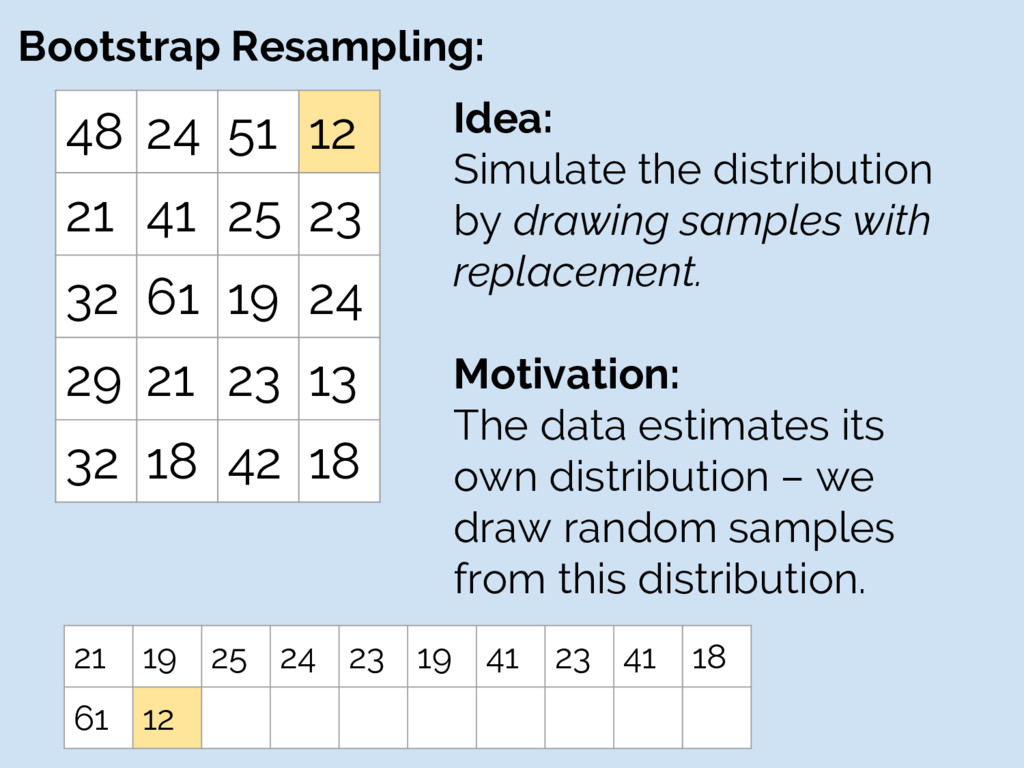
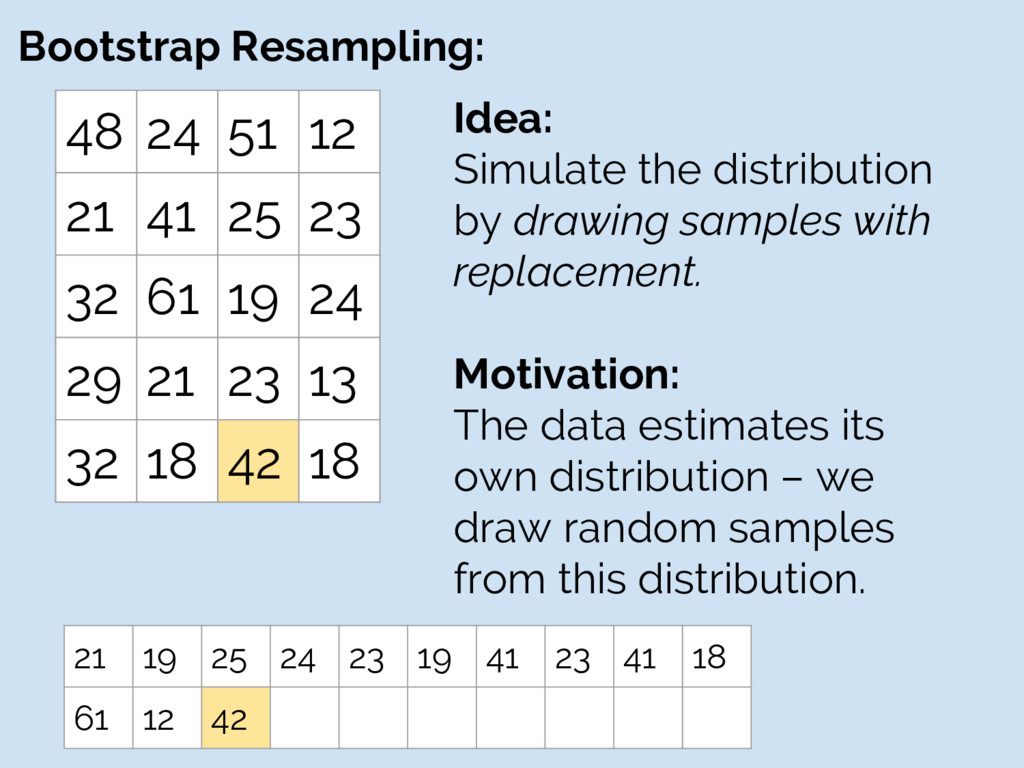
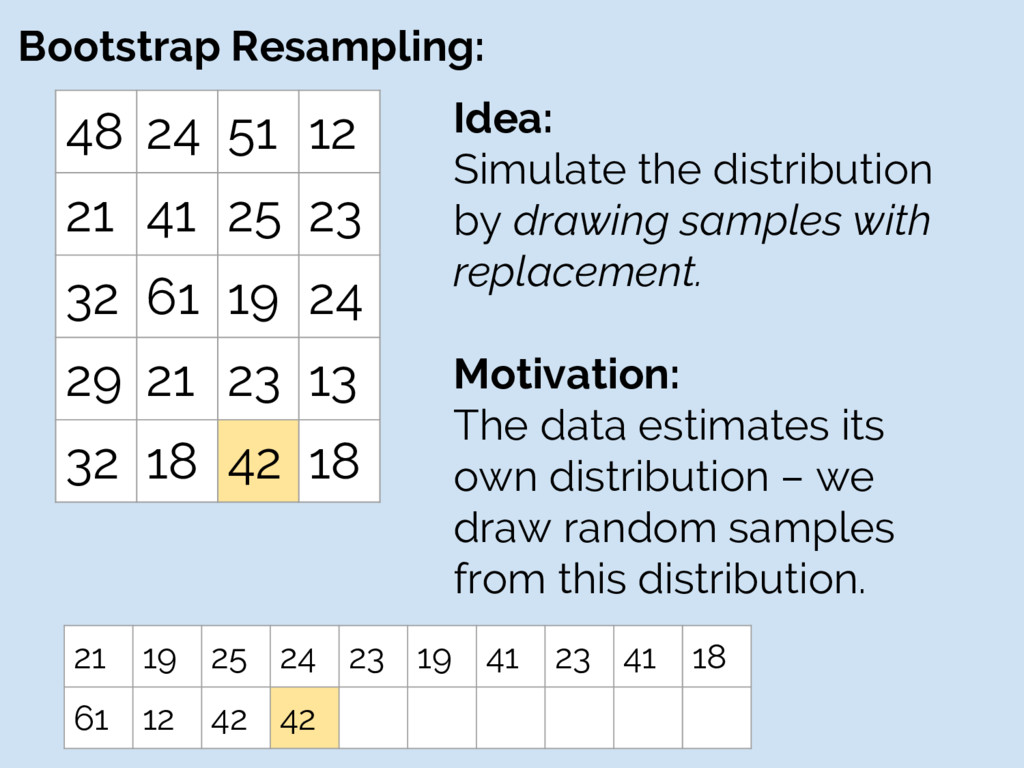
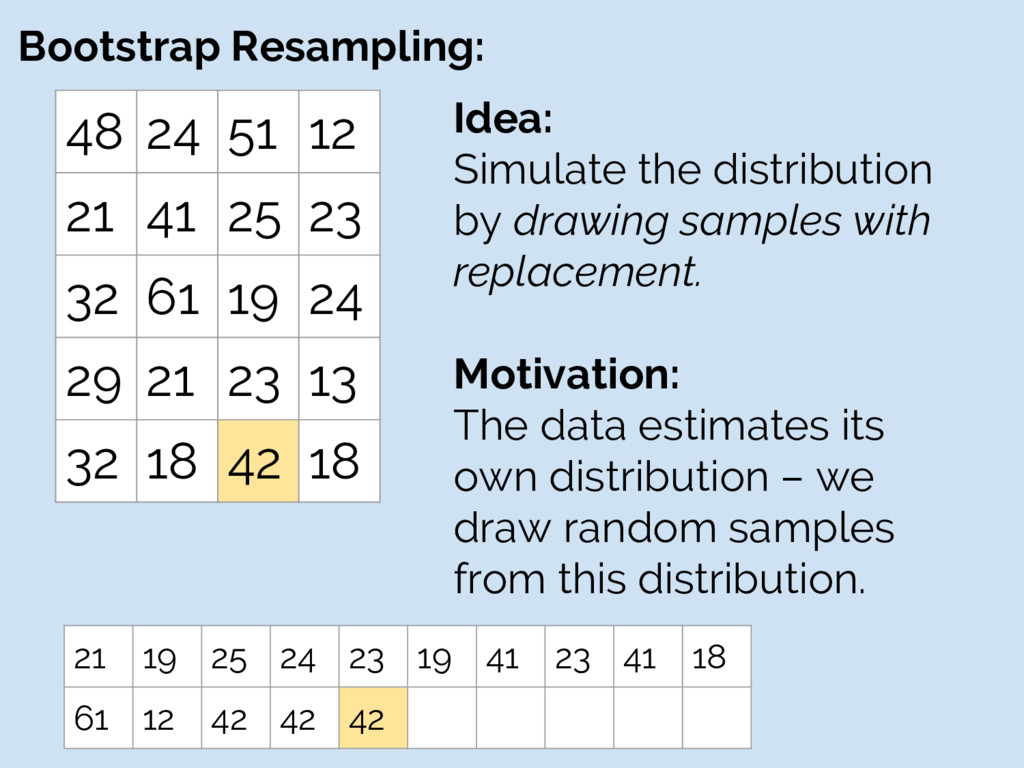
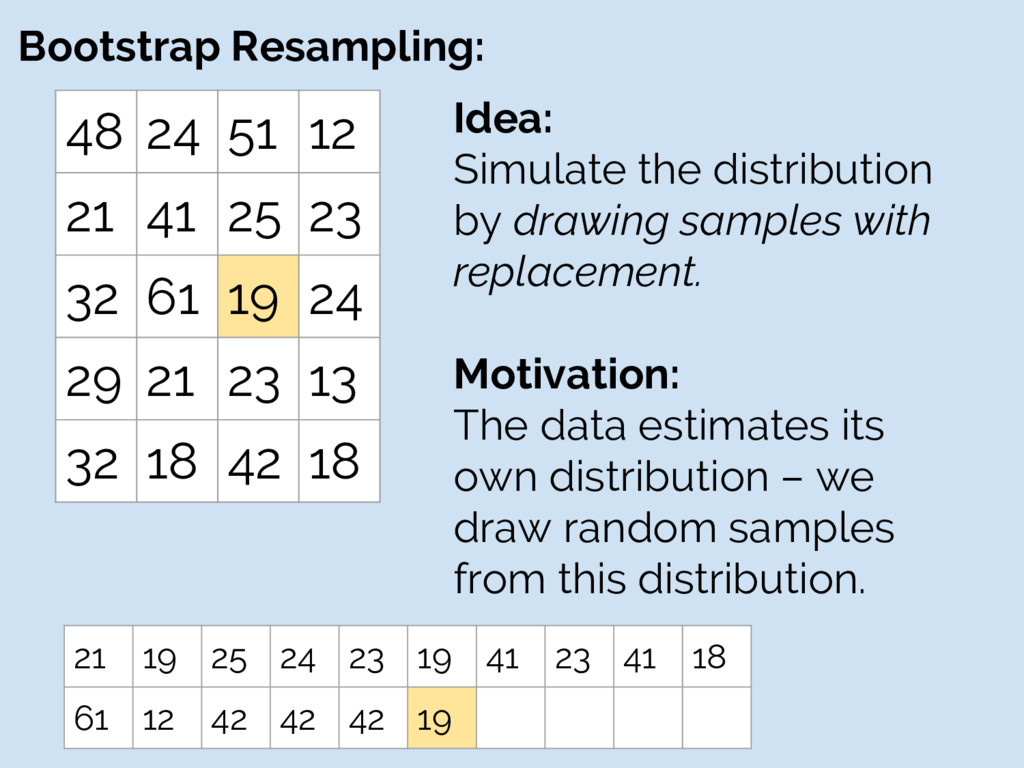
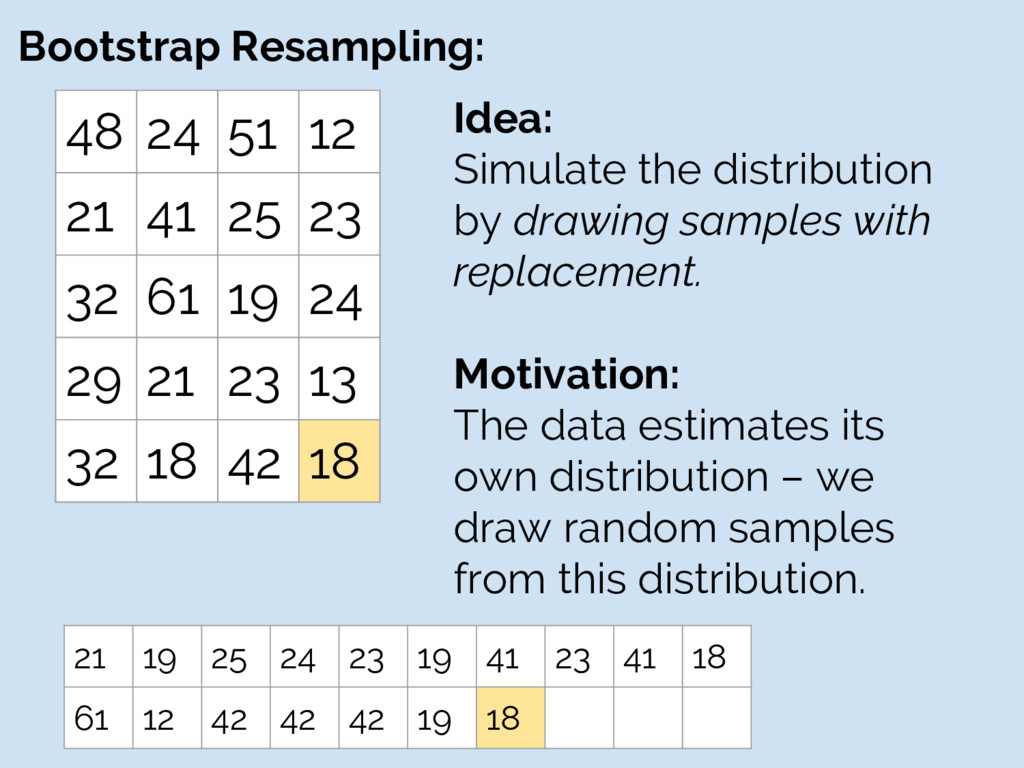
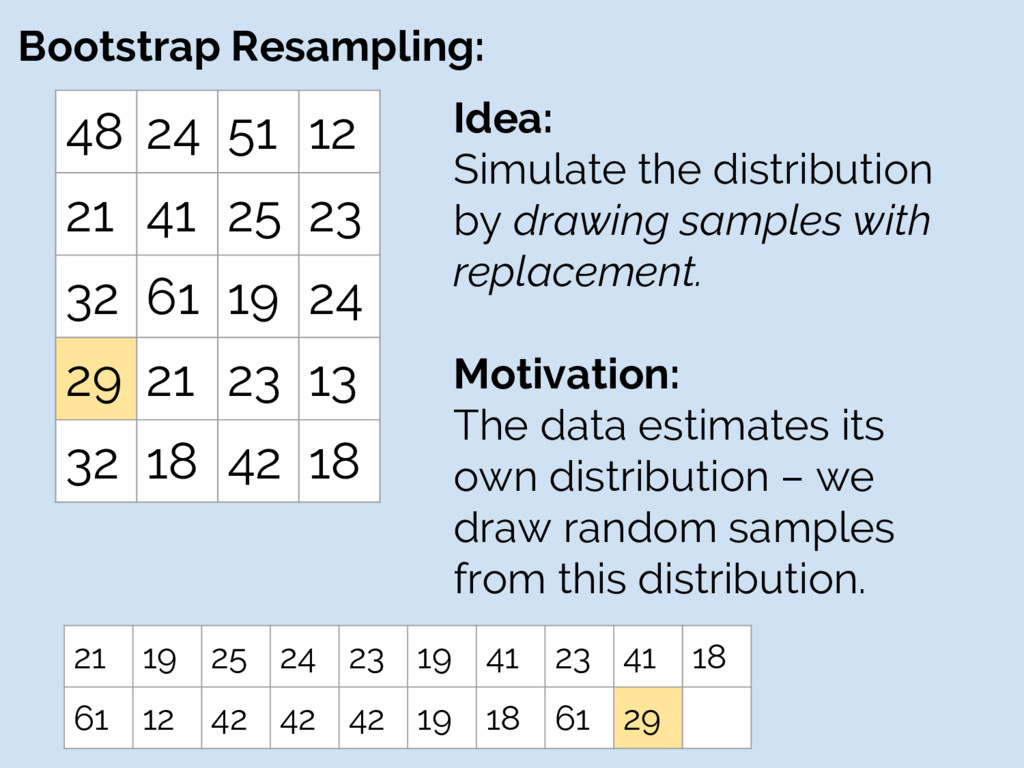
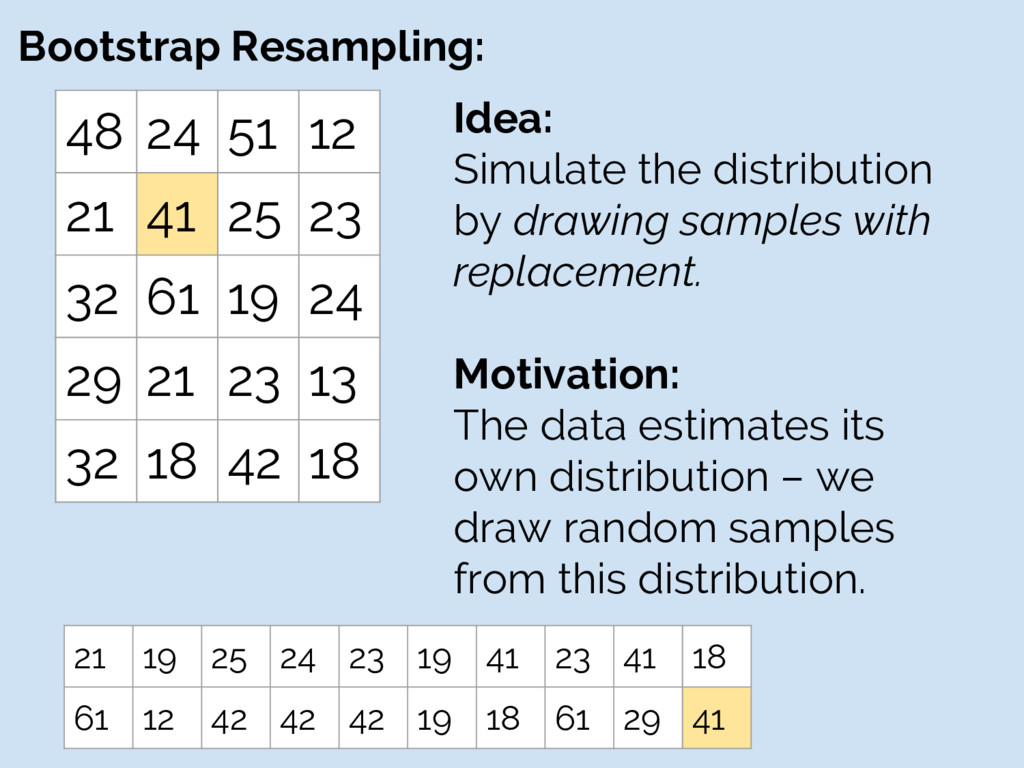
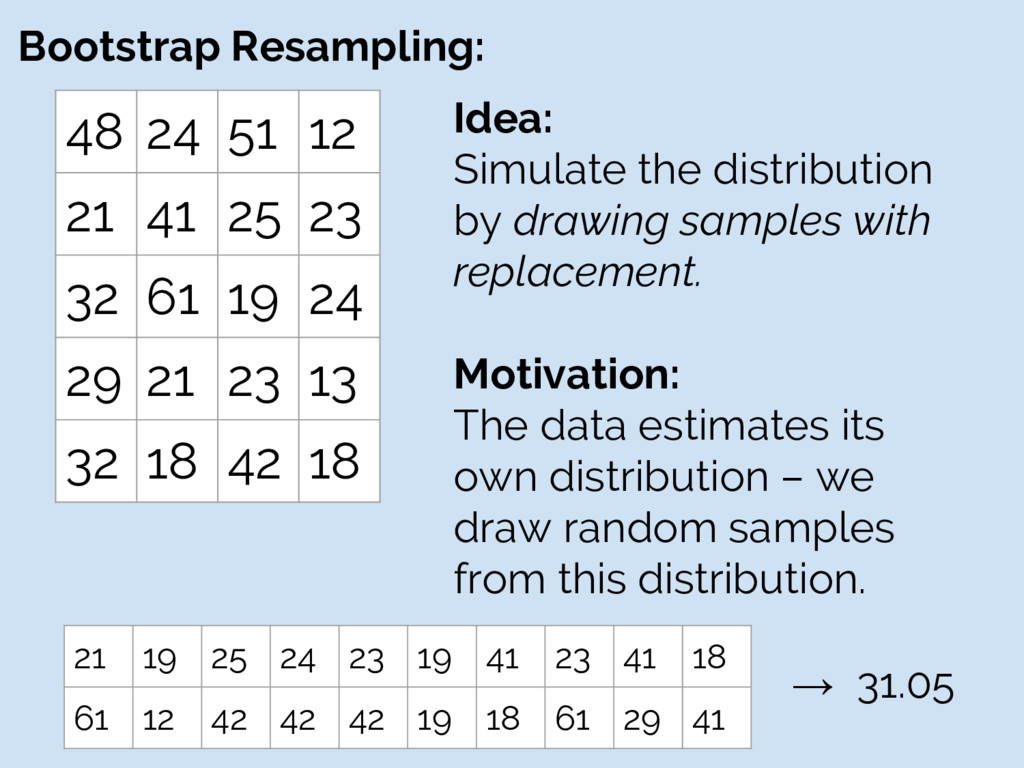
32 61 19 24 29 21 23 13 32 18 42 18 Idea: Simulate the distribution by drawing samples with replacement. Motivation: The data estimates its own distribution – we draw random samples from this distribution.
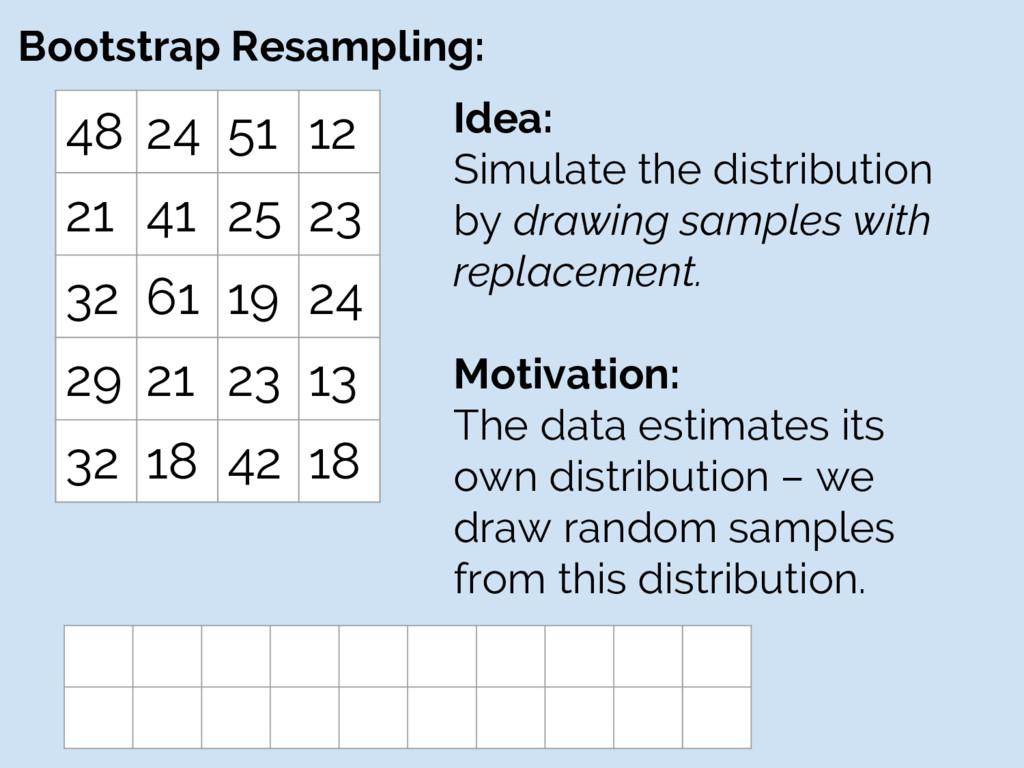
32 61 19 24 29 21 23 13 32 18 42 18 Idea: Simulate the distribution by drawing samples with replacement. Motivation: The data estimates its own distribution – we draw random samples from this distribution.
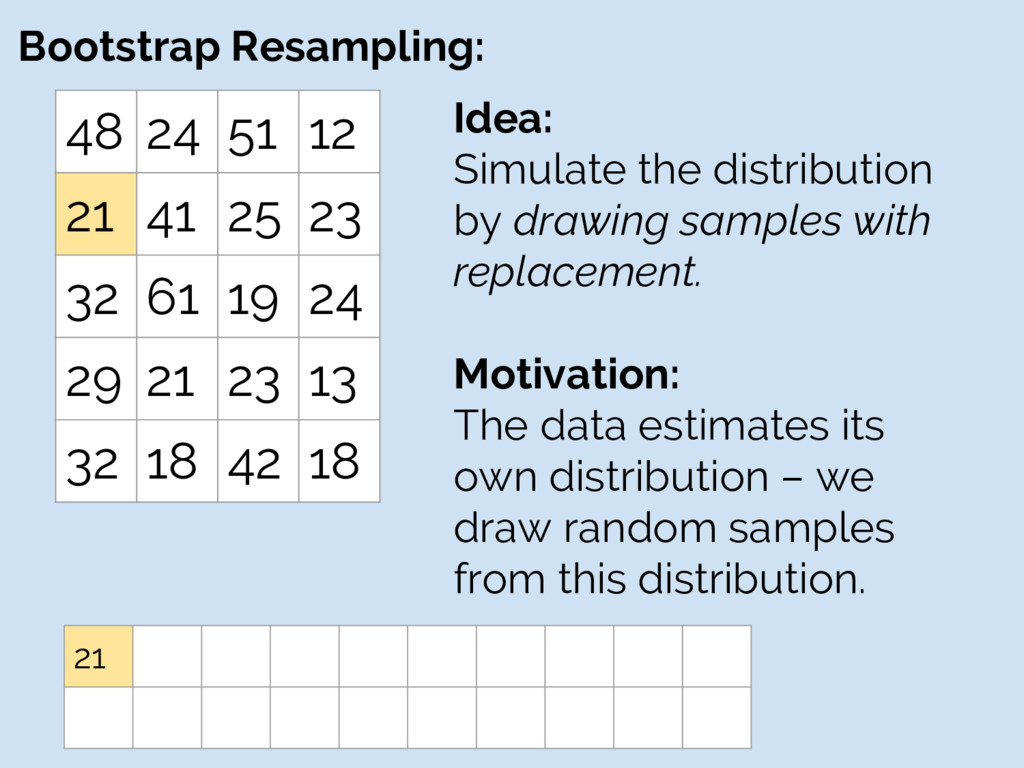
32 61 19 24 29 21 23 13 32 18 42 18 Idea: Simulate the distribution by drawing samples with replacement. Motivation: The data estimates its own distribution – we draw random samples from this distribution. 21
32 61 19 24 29 21 23 13 32 18 42 18 Idea: Simulate the distribution by drawing samples with replacement. Motivation: The data estimates its own distribution – we draw random samples from this distribution. 21 19
32 61 19 24 29 21 23 13 32 18 42 18 Idea: Simulate the distribution by drawing samples with replacement. Motivation: The data estimates its own distribution – we draw random samples from this distribution. 21 19 25
32 61 19 24 29 21 23 13 32 18 42 18 Idea: Simulate the distribution by drawing samples with replacement. Motivation: The data estimates its own distribution – we draw random samples from this distribution. 21 19 25 24
32 61 19 24 29 21 23 13 32 18 42 18 Idea: Simulate the distribution by drawing samples with replacement. Motivation: The data estimates its own distribution – we draw random samples from this distribution. 21 19 25 24 23
32 61 19 24 29 21 23 13 32 18 42 18 Idea: Simulate the distribution by drawing samples with replacement. Motivation: The data estimates its own distribution – we draw random samples from this distribution. 21 19 25 24 23 19
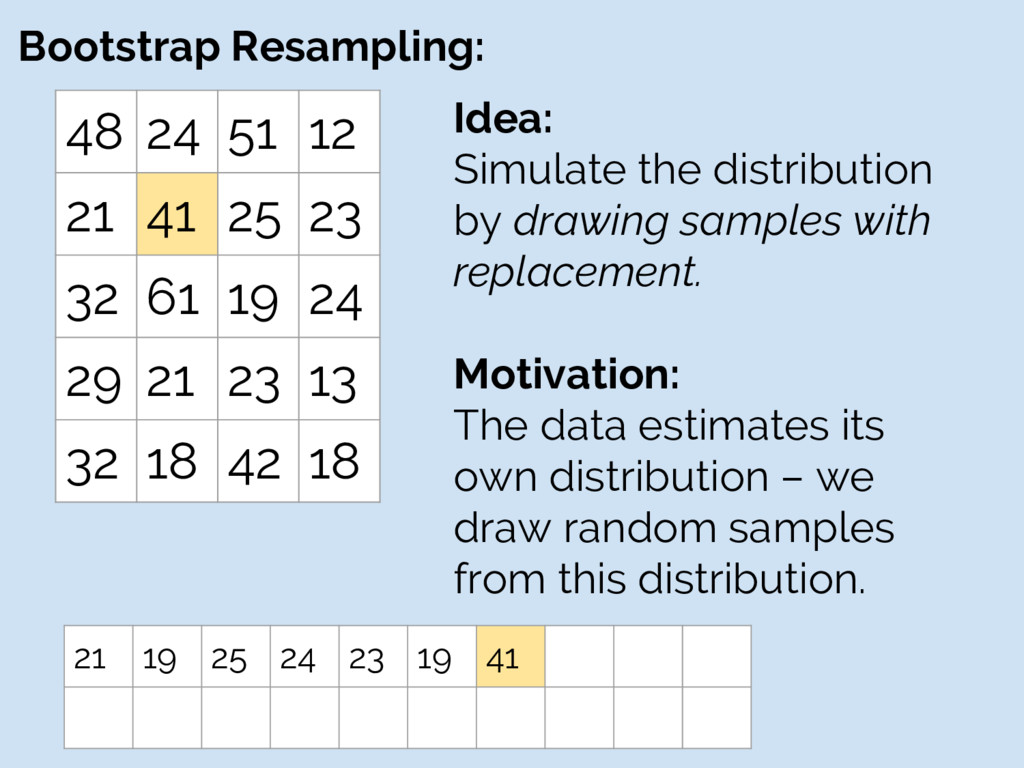
32 61 19 24 29 21 23 13 32 18 42 18 Idea: Simulate the distribution by drawing samples with replacement. Motivation: The data estimates its own distribution – we draw random samples from this distribution. 21 19 25 24 23 19 41
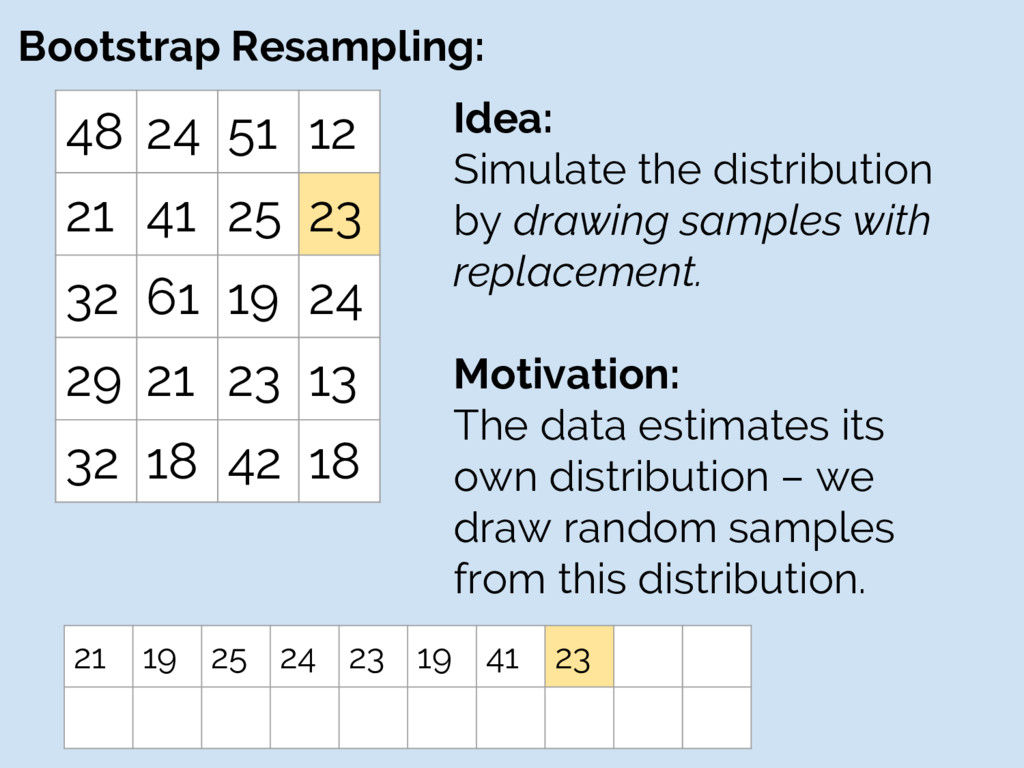
32 61 19 24 29 21 23 13 32 18 42 18 Idea: Simulate the distribution by drawing samples with replacement. Motivation: The data estimates its own distribution – we draw random samples from this distribution. 21 19 25 24 23 19 41 23
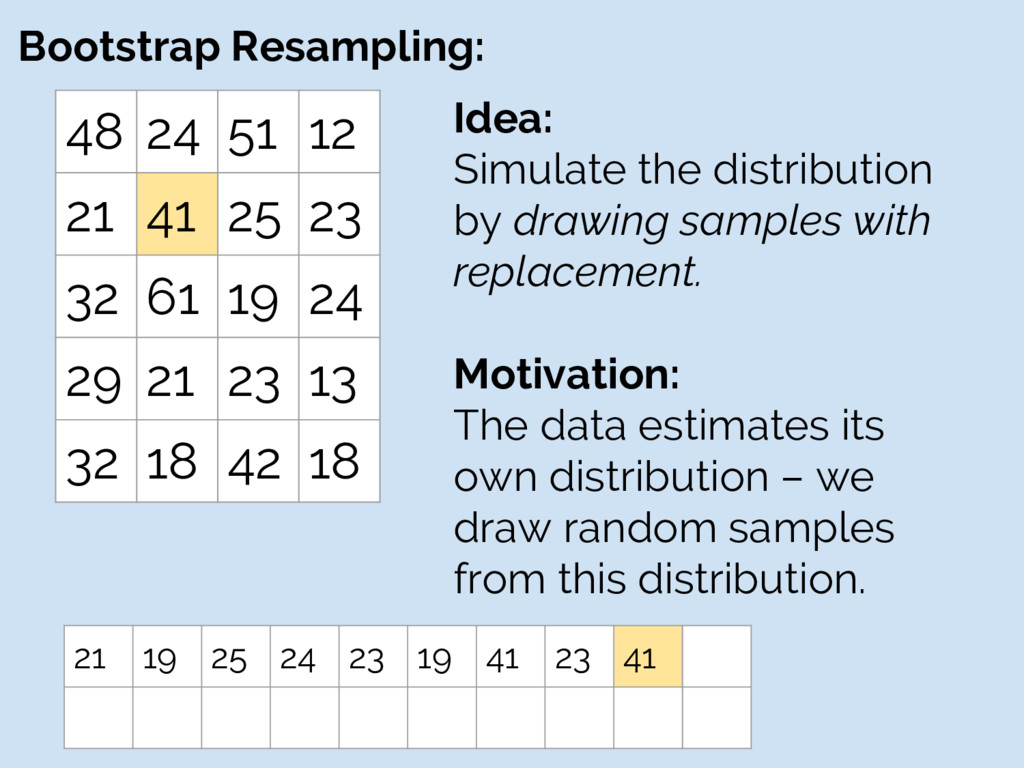
32 61 19 24 29 21 23 13 32 18 42 18 Idea: Simulate the distribution by drawing samples with replacement. Motivation: The data estimates its own distribution – we draw random samples from this distribution. 21 19 25 24 23 19 41 23 41
32 61 19 24 29 21 23 13 32 18 42 18 Idea: Simulate the distribution by drawing samples with replacement. Motivation: The data estimates its own distribution – we draw random samples from this distribution. 21 19 25 24 23 19 41 23 41 18
32 61 19 24 29 21 23 13 32 18 42 18 Idea: Simulate the distribution by drawing samples with replacement. Motivation: The data estimates its own distribution – we draw random samples from this distribution. 21 19 25 24 23 19 41 23 41 18 61
32 61 19 24 29 21 23 13 32 18 42 18 Idea: Simulate the distribution by drawing samples with replacement. Motivation: The data estimates its own distribution – we draw random samples from this distribution. 21 19 25 24 23 19 41 23 41 18 61 12
32 61 19 24 29 21 23 13 32 18 42 18 Idea: Simulate the distribution by drawing samples with replacement. Motivation: The data estimates its own distribution – we draw random samples from this distribution. 21 19 25 24 23 19 41 23 41 18 61 12 42
32 61 19 24 29 21 23 13 32 18 42 18 Idea: Simulate the distribution by drawing samples with replacement. Motivation: The data estimates its own distribution – we draw random samples from this distribution. 21 19 25 24 23 19 41 23 41 18 61 12 42 42
32 61 19 24 29 21 23 13 32 18 42 18 Idea: Simulate the distribution by drawing samples with replacement. Motivation: The data estimates its own distribution – we draw random samples from this distribution. 21 19 25 24 23 19 41 23 41 18 61 12 42 42 42
32 61 19 24 29 21 23 13 32 18 42 18 Idea: Simulate the distribution by drawing samples with replacement. Motivation: The data estimates its own distribution – we draw random samples from this distribution. 21 19 25 24 23 19 41 23 41 18 61 12 42 42 42 19
32 61 19 24 29 21 23 13 32 18 42 18 Idea: Simulate the distribution by drawing samples with replacement. Motivation: The data estimates its own distribution – we draw random samples from this distribution. 21 19 25 24 23 19 41 23 41 18 61 12 42 42 42 19 18
32 61 19 24 29 21 23 13 32 18 42 18 Idea: Simulate the distribution by drawing samples with replacement. Motivation: The data estimates its own distribution – we draw random samples from this distribution. 21 19 25 24 23 19 41 23 41 18 61 12 42 42 42 19 18 61
32 61 19 24 29 21 23 13 32 18 42 18 Idea: Simulate the distribution by drawing samples with replacement. Motivation: The data estimates its own distribution – we draw random samples from this distribution. 21 19 25 24 23 19 41 23 41 18 61 12 42 42 42 19 18 61 29
32 61 19 24 29 21 23 13 32 18 42 18 Idea: Simulate the distribution by drawing samples with replacement. Motivation: The data estimates its own distribution – we draw random samples from this distribution. 21 19 25 24 23 19 41 23 41 18 61 12 42 42 42 19 18 61 29 41
32 61 19 24 29 21 23 13 32 18 42 18 Idea: Simulate the distribution by drawing samples with replacement. Motivation: The data estimates its own distribution – we draw random samples from this distribution. 21 19 25 24 23 19 41 23 41 18 61 12 42 42 42 19 18 61 29 41 → 31.05
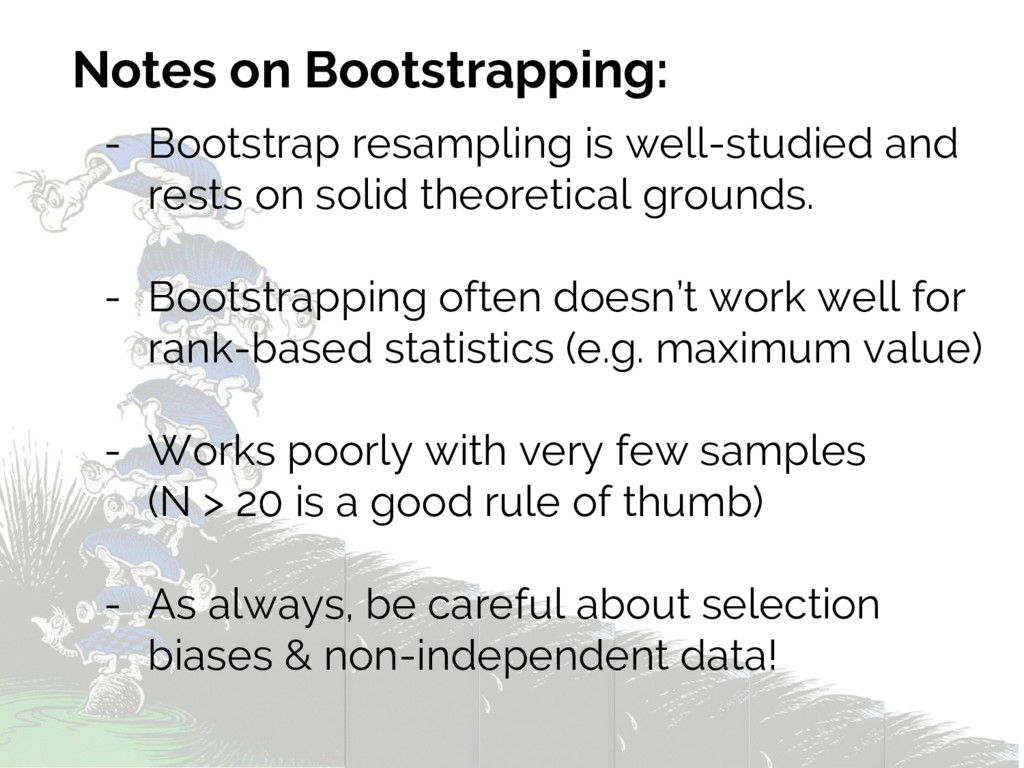
on solid theoretical grounds. - Bootstrapping often doesn’t work well for rank-based statistics (e.g. maximum value) - Works poorly with very few samples (N > 20 is a good rule of thumb) - As always, be careful about selection biases & non-independent data!
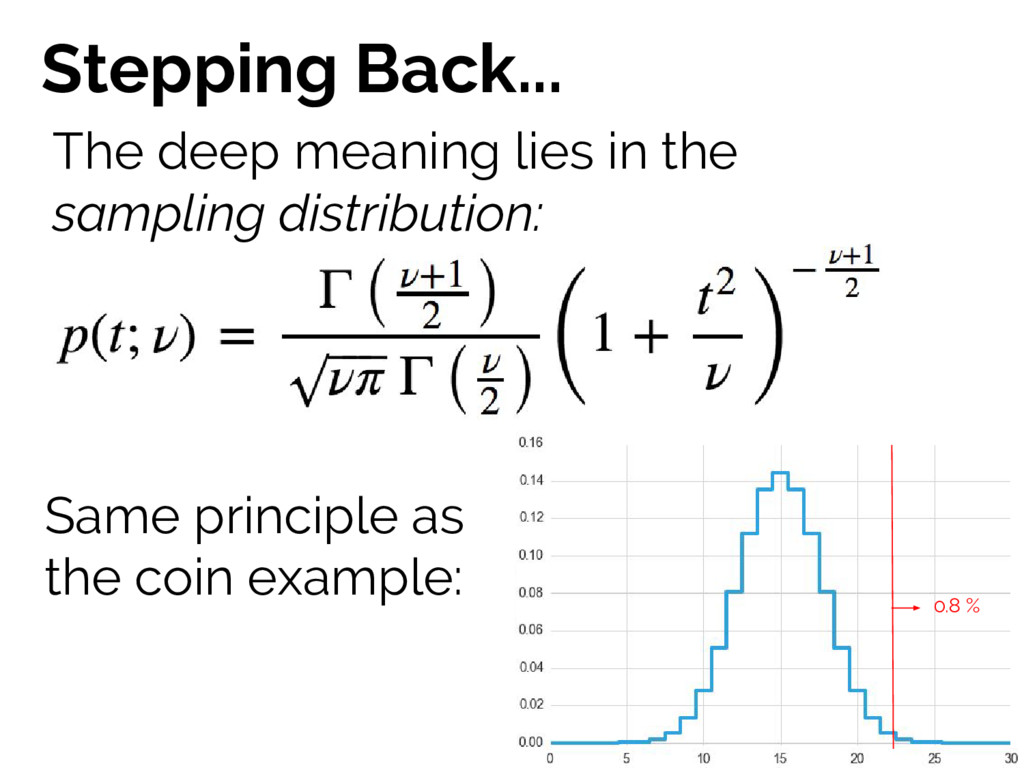
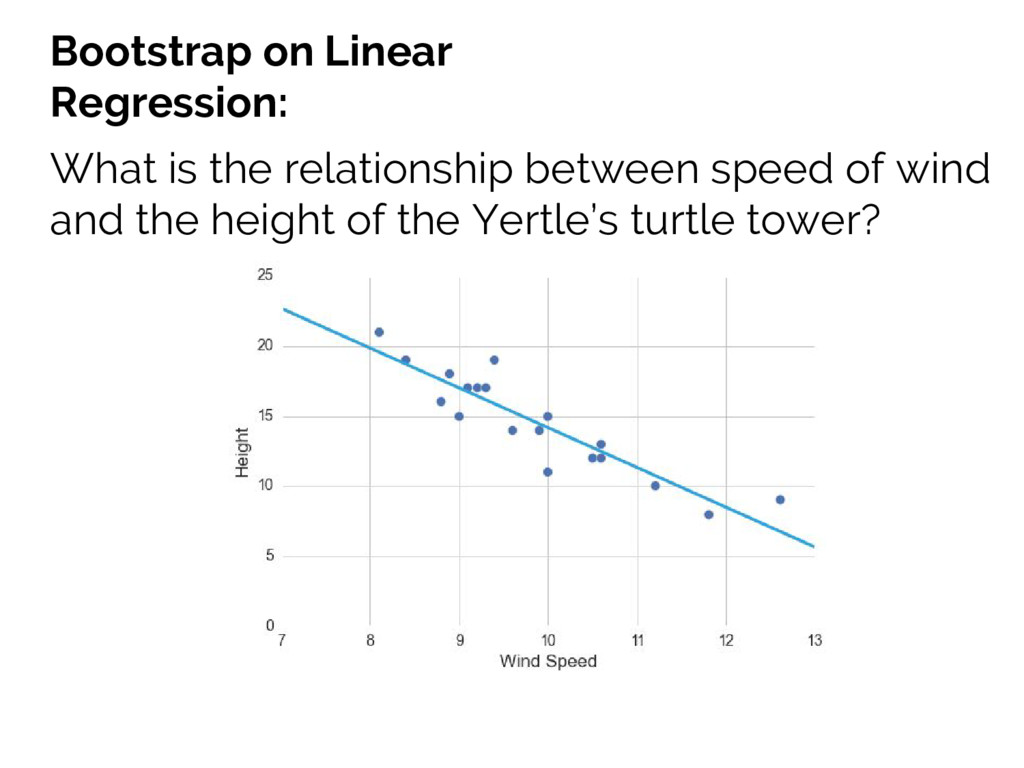
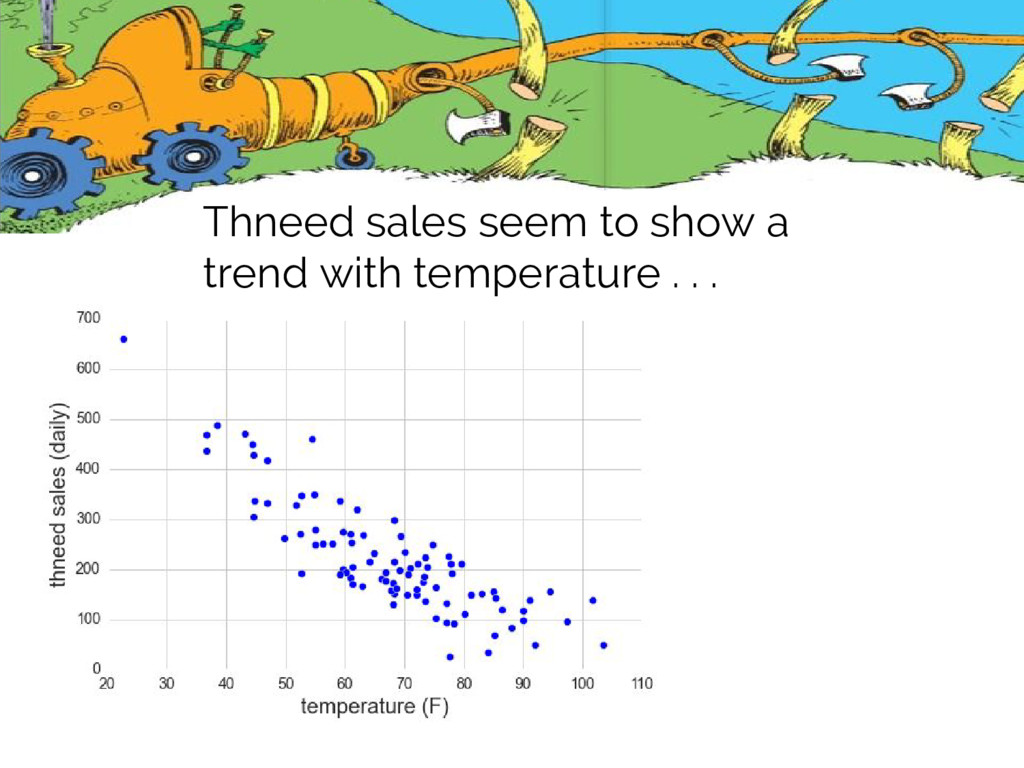
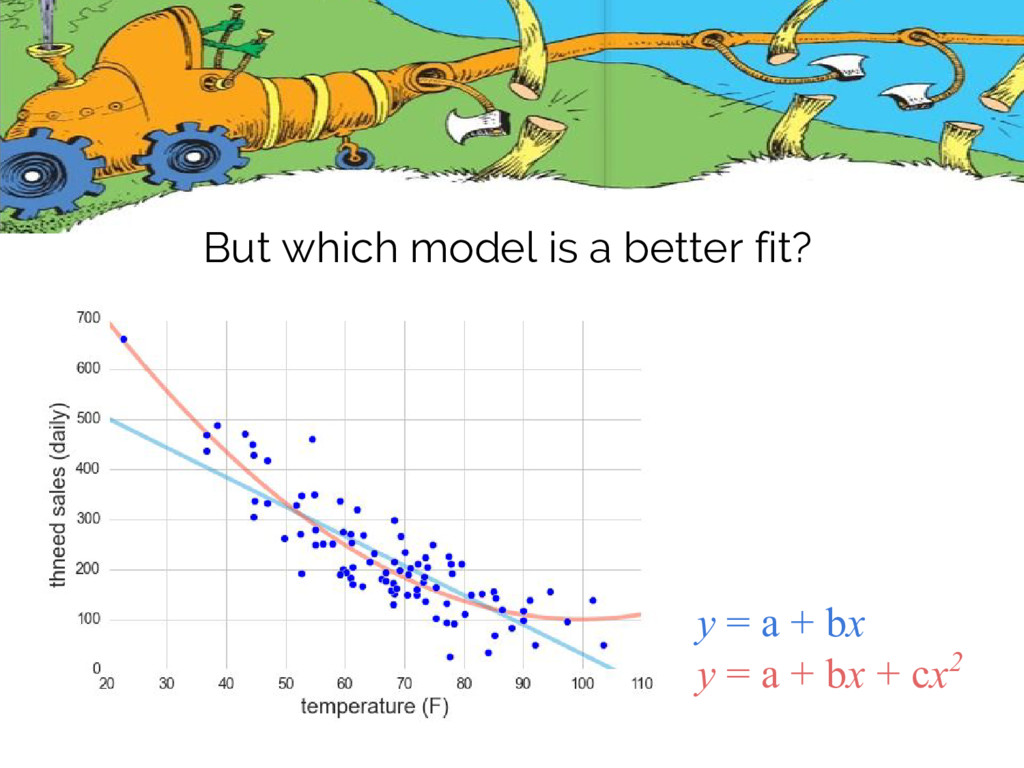
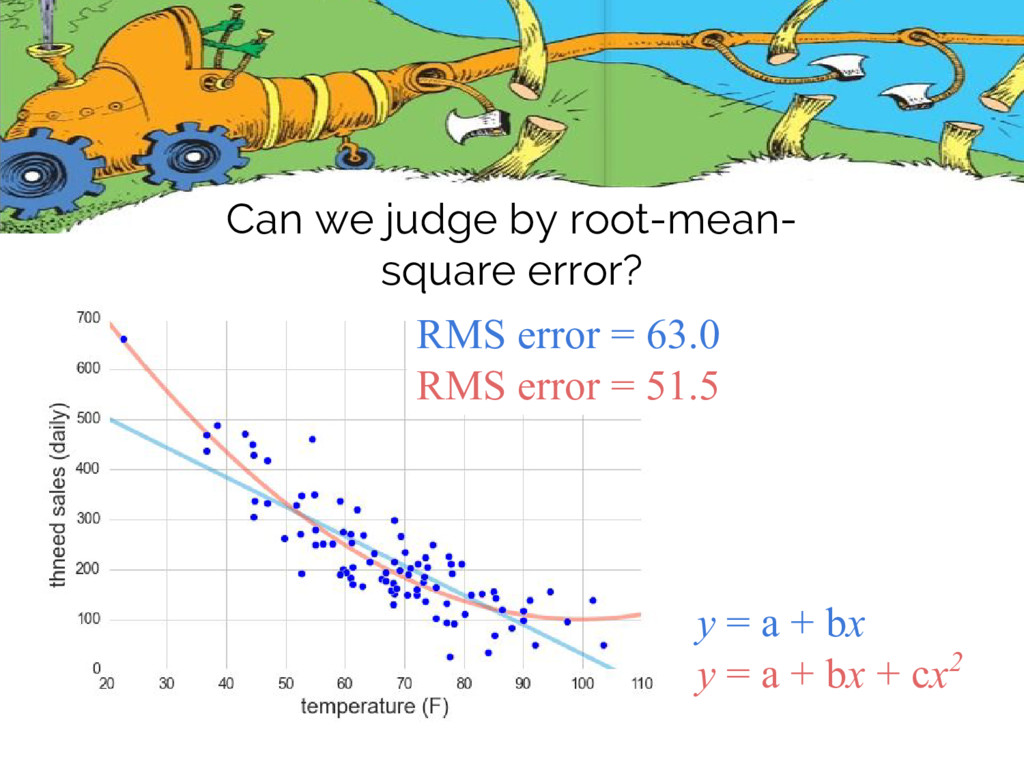
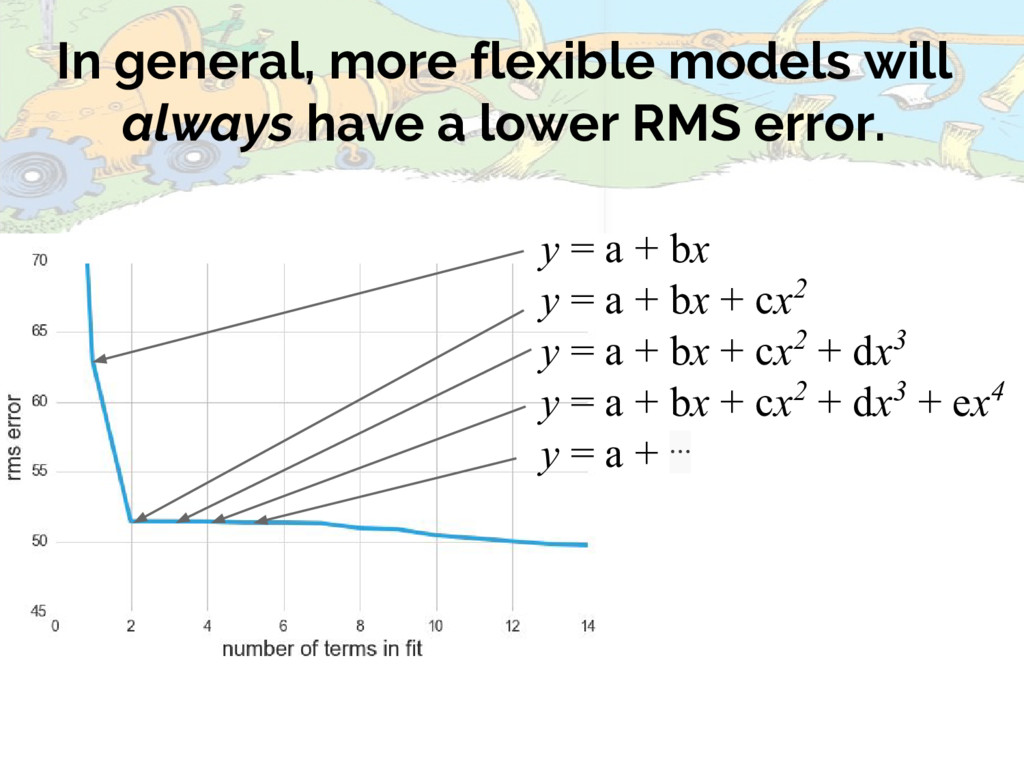
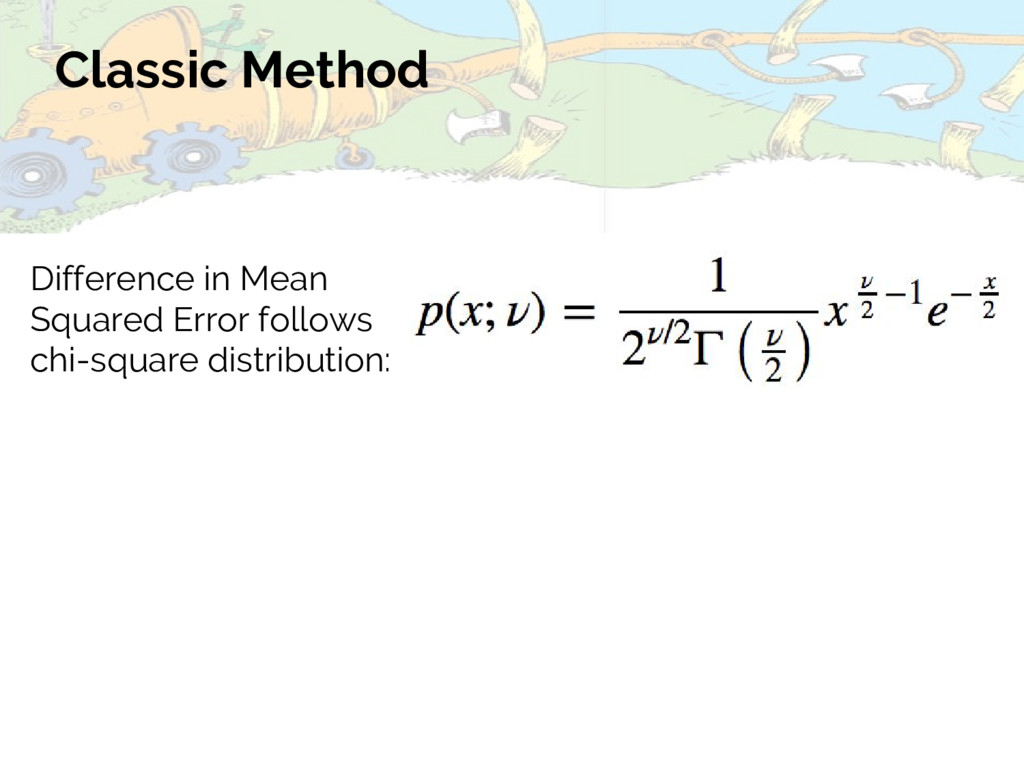
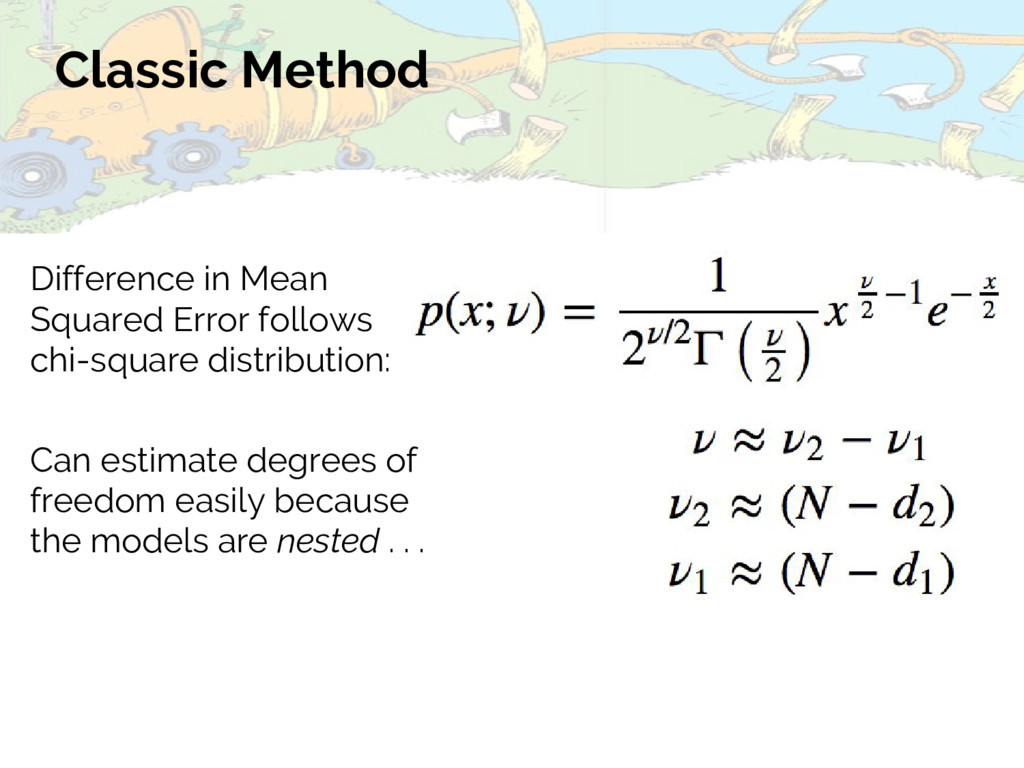
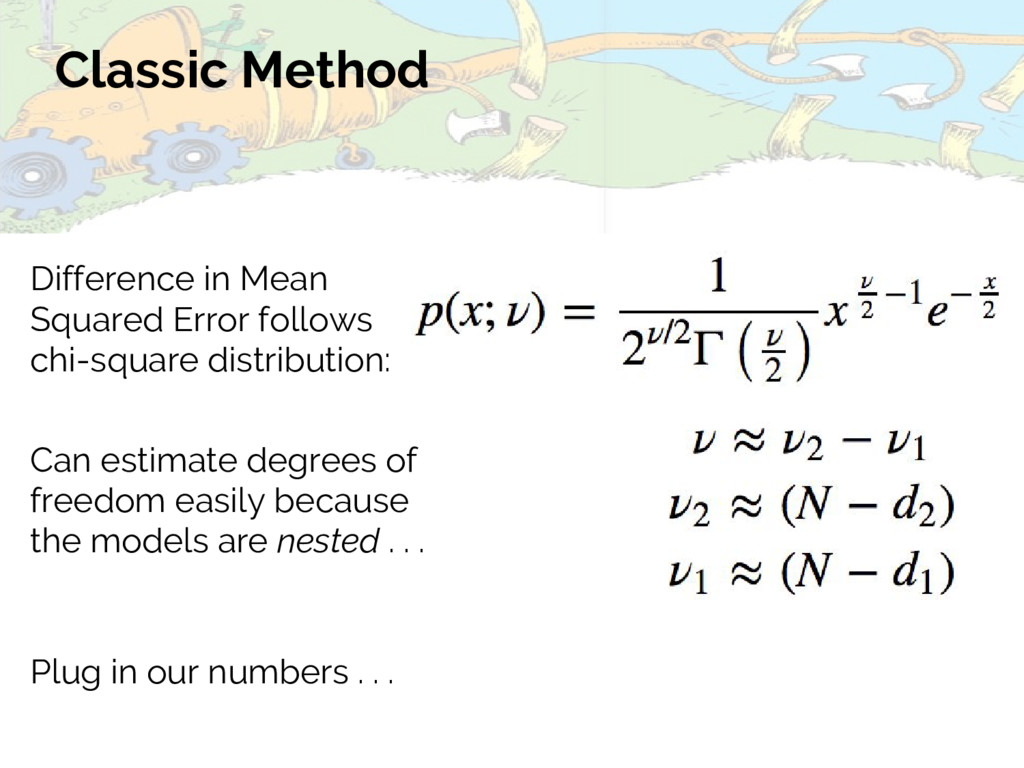
models are nested . . . Difference in Mean Squared Error follows chi-square distribution: Plug in our numbers . . . Wait… what question were we trying to answer again?
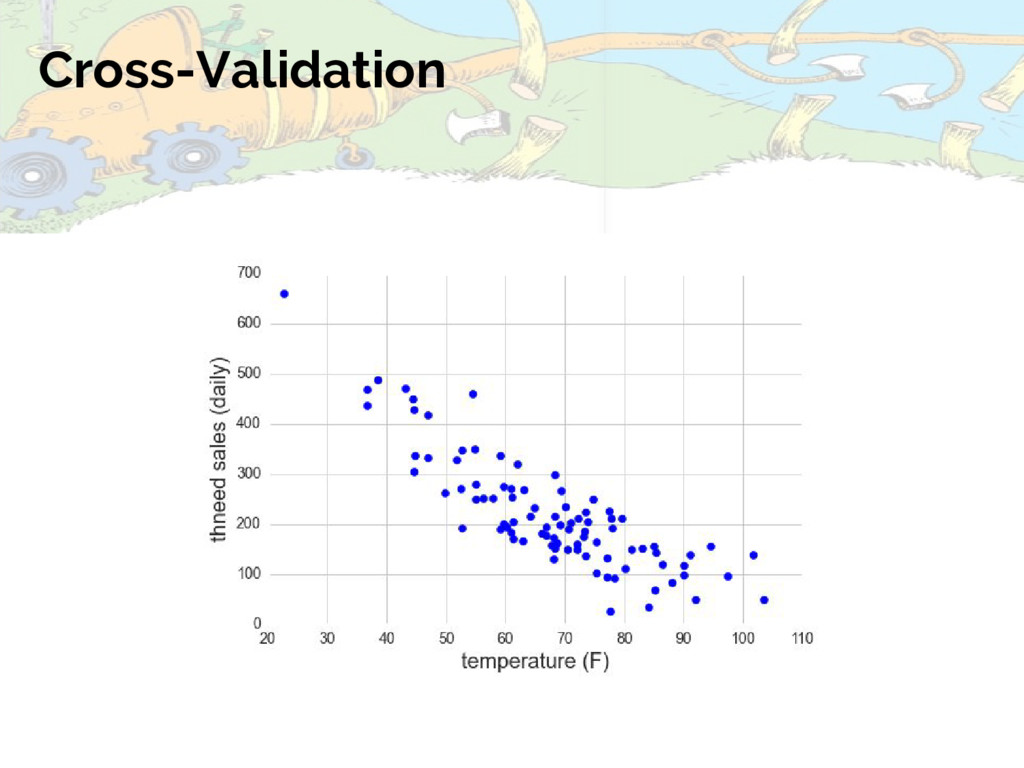
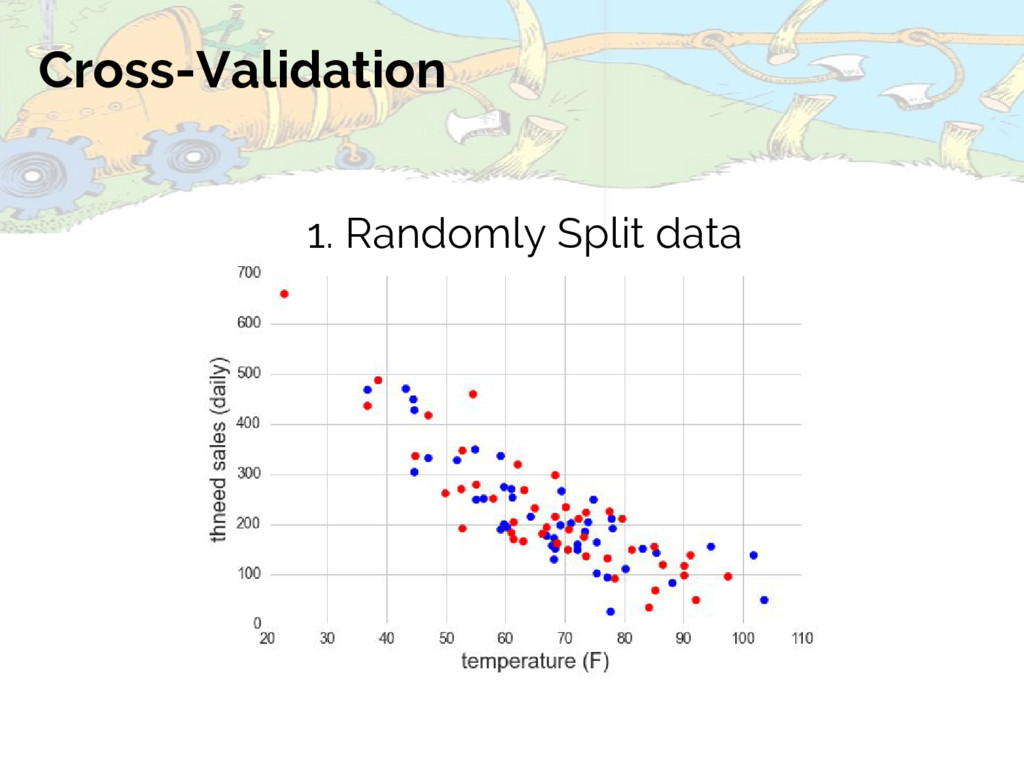
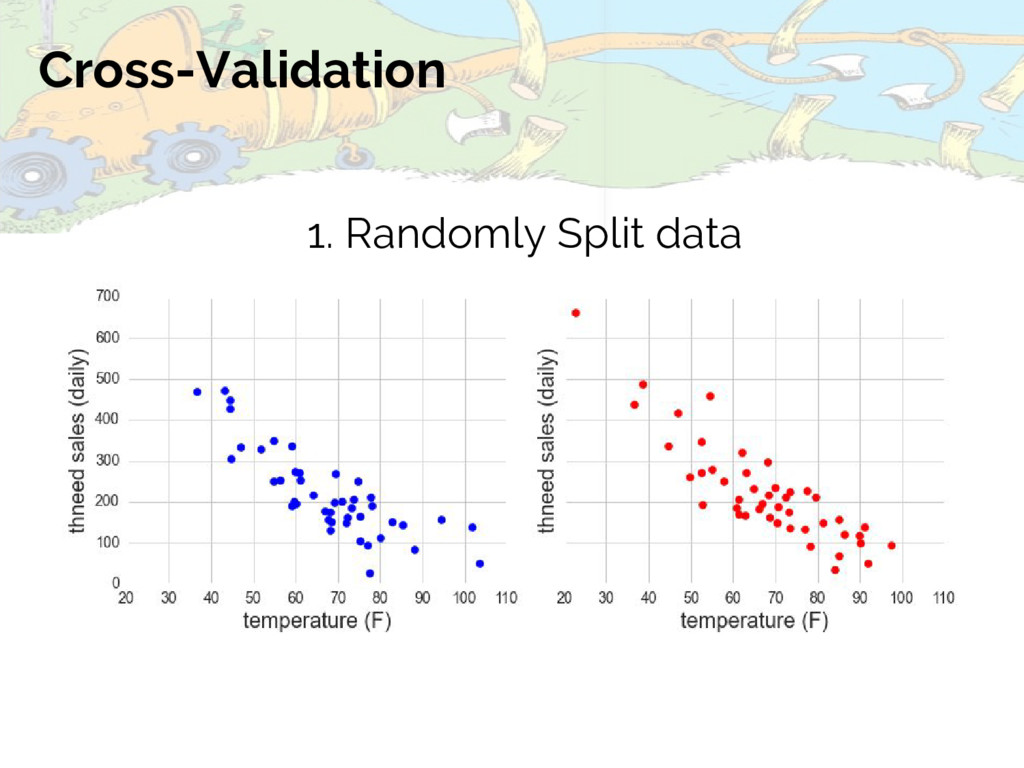
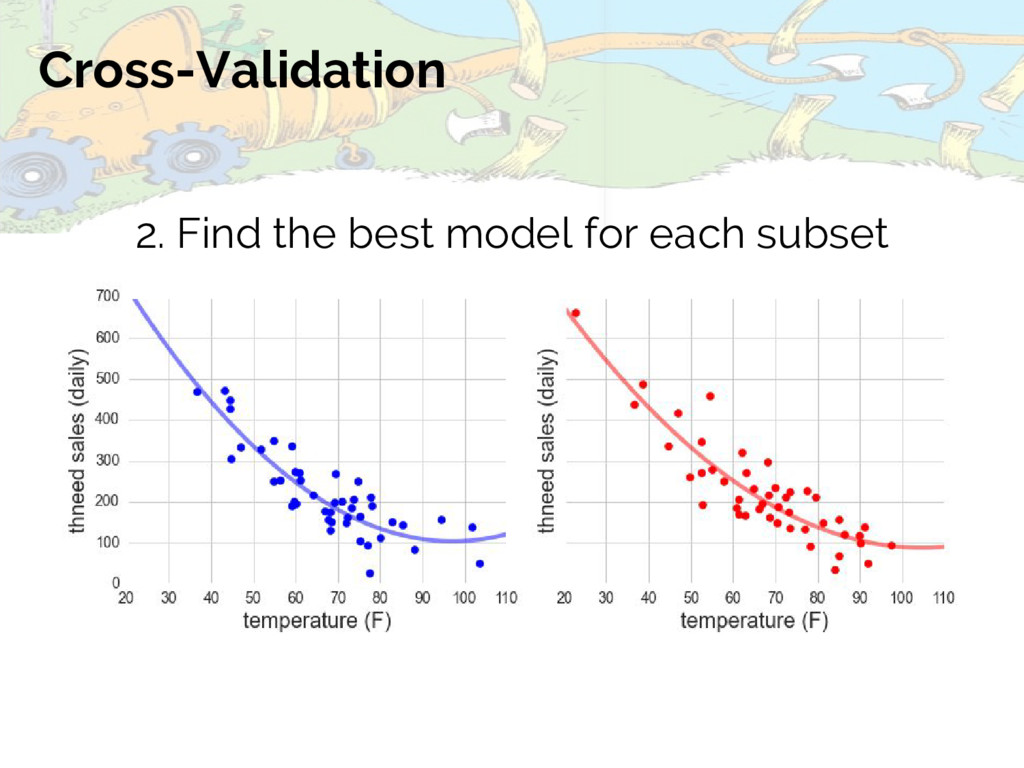
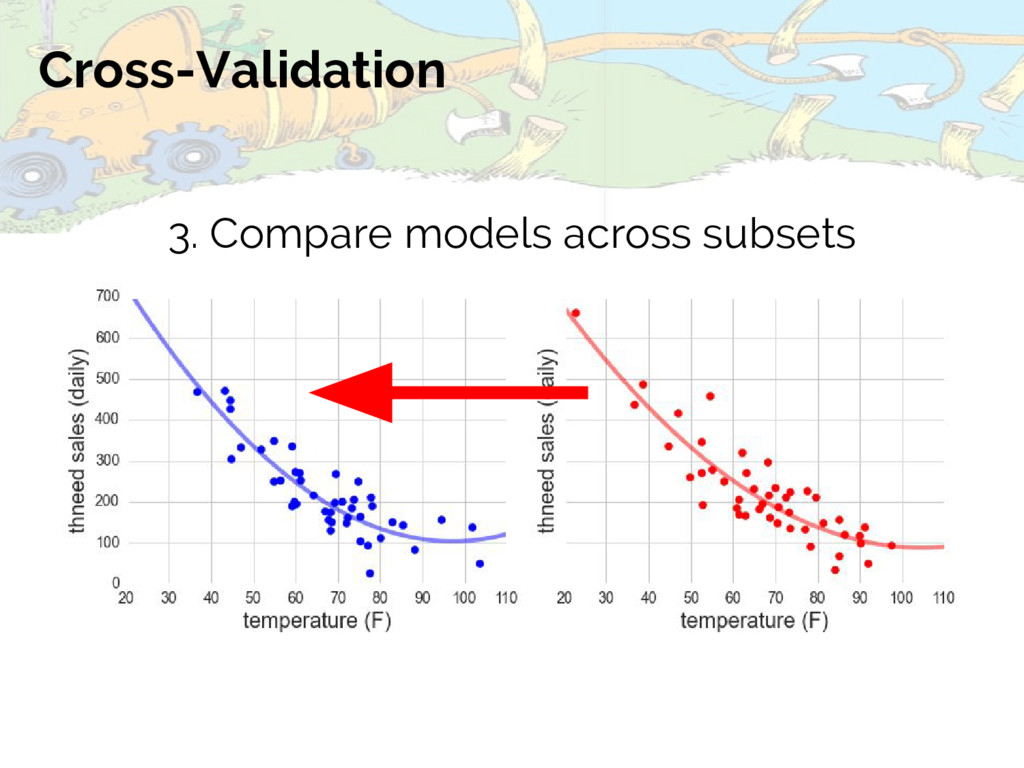
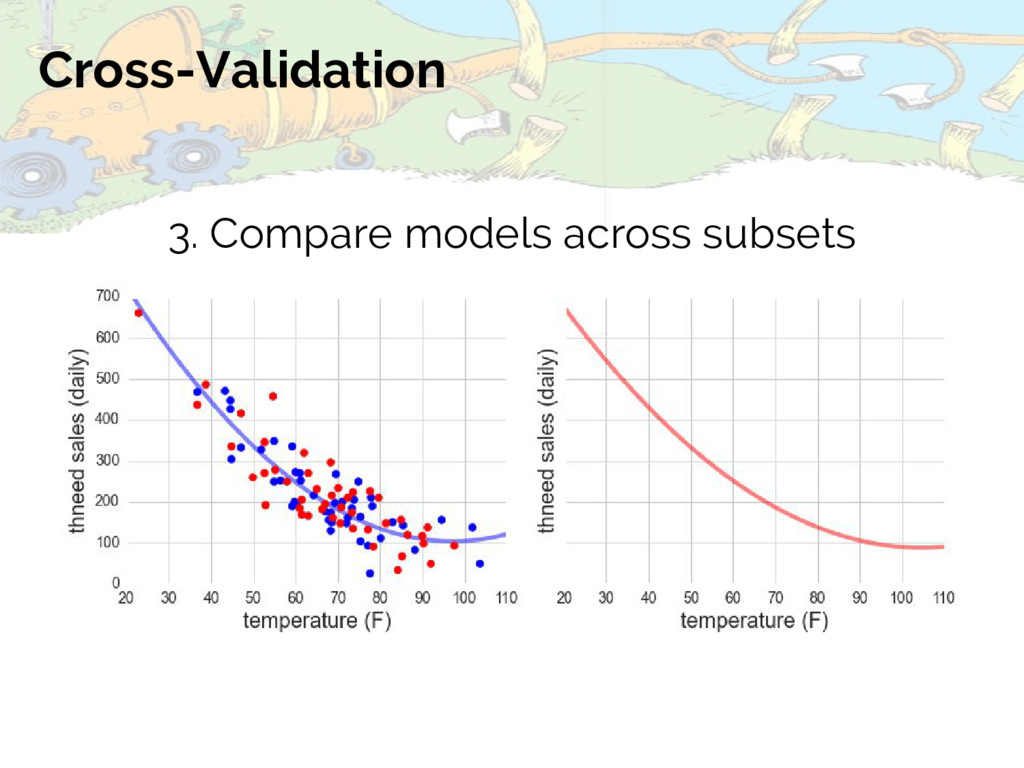
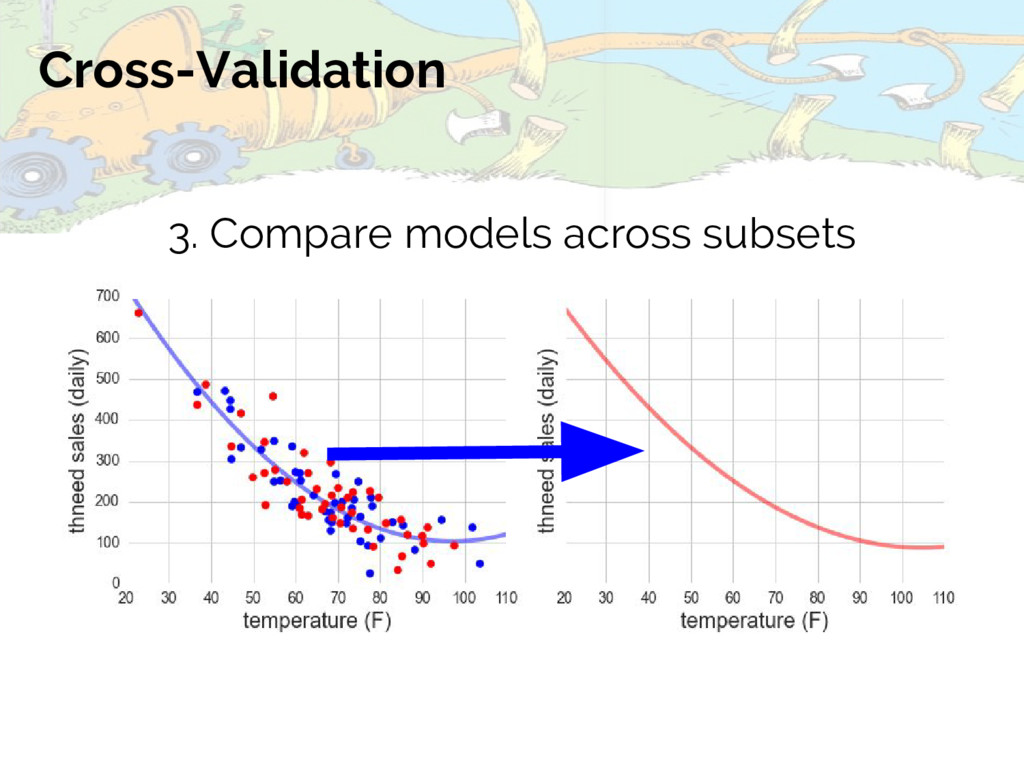
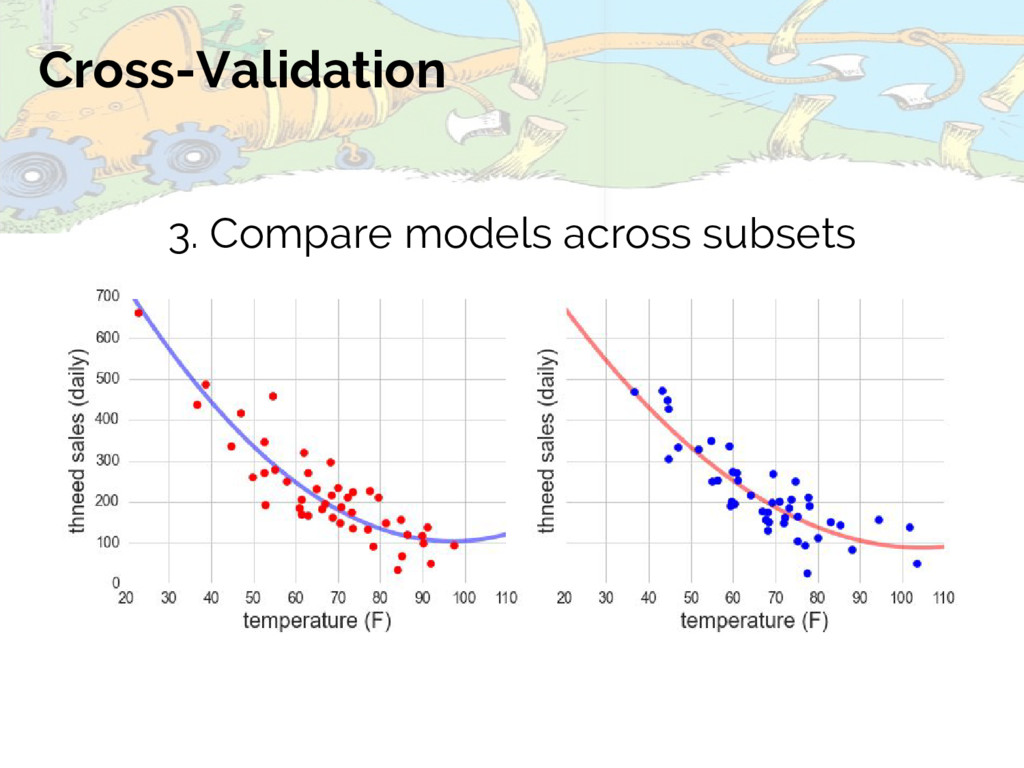
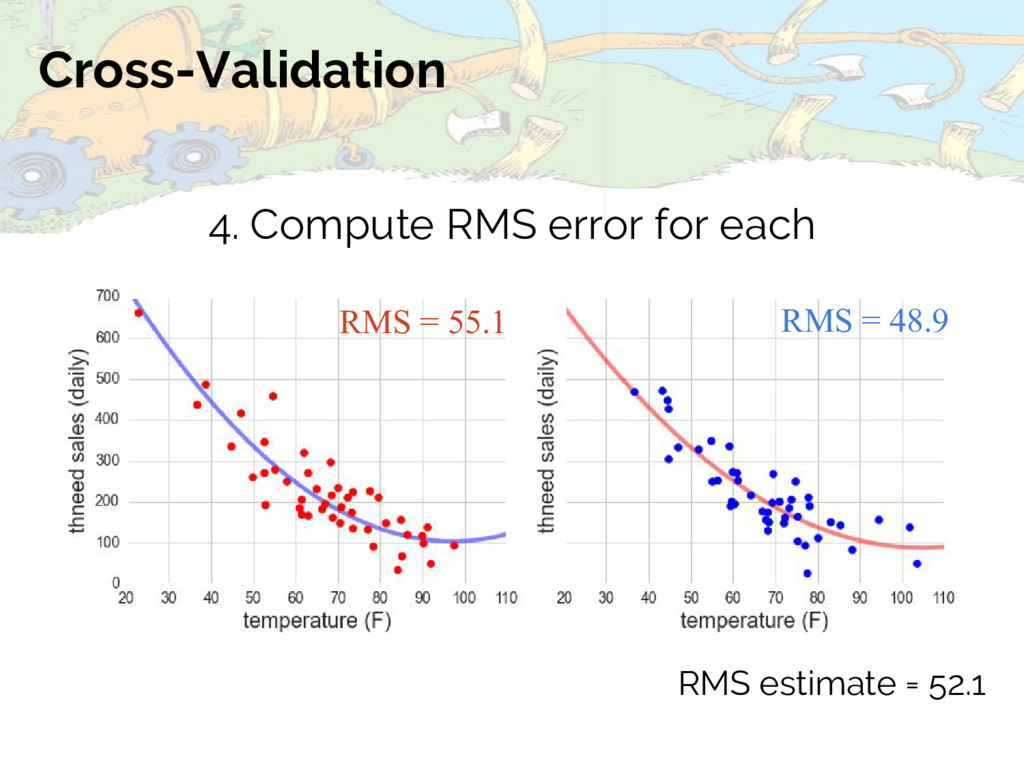
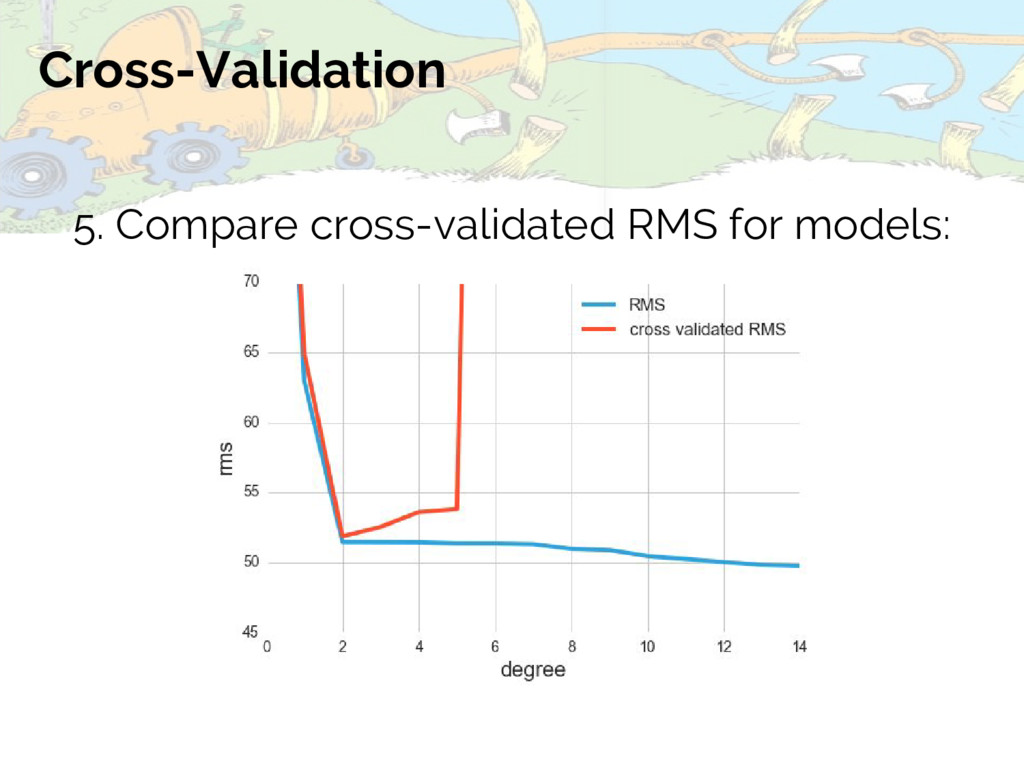
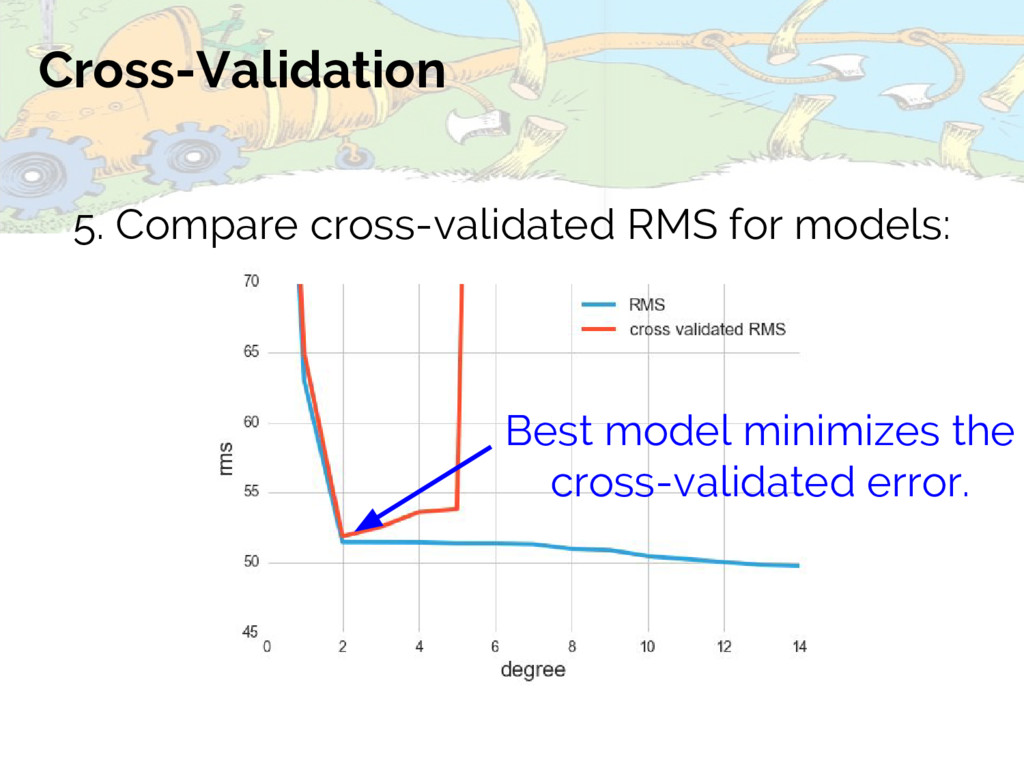
schemes exist & may perform better for your data (see e.g. scikit-learn docs) - Cross-validation is the go-to method for model evaluation in machine learning, as statistics of the models are often not known in the classical sense. - Again: caveats about selection bias and independence in data.
intuitive & powerful approaches to more sophisticated modeling. (see e.g. Bayesian Methods for Hackers by Cam Davidson-Pilon) - Selection Bias: if you get data selection wrong, you’ll have a bad time. (See Chris Fonnesbeck’s Scipy 2015 talk, Statistical Thinking for Data Science) - Detailed considerations on use of sampling, shuffling, and bootstrapping. (I recommend Statistics Is Easy by Shasha & Wilson And Resampling: The New Statistics by Julian Simon)


 y0hgi
 teamlab
 pfn
 mhrtech
 takanorip
 shugo
 rfdnxbro
 takuroabe
 codmoninc
 gionn
 willnet
 jonoalderson
 nmsamuel
 sachag
 holman
 eileencodes
 rkendrick25
 destraynor
 katarinadahlin
 ks91
 geshan
 tonyrice
 wayneb77