Upgrade to Pro — share decks privately, control downloads, hide ads and more …

Data journalism with R at Süddeutsche Zeitung

Data journalism with R at Süddeutsche Zeitung

Slides from a RLadies Munich meetup.
Katharina Brunner and Martina Schories

Avatar for Katharina Brunner

Katharina Brunner

July 31, 2018

Other Decks in Programming

Transcript

  1. Who are we? Two data journalists working at Süddeutsche Zeitung

    in the data and digital investigations team. - Martina Schories, Twitter: @MSchories - Katharina Brunner, Twitter: @cutterkom - other team members: Vanessa, Hannes, Christian, Benedict, Moritz, Felix Katharina Brunner, Martina Schories 2
  2. What is Süddeutsche Zeitung (SZ)? - One of the most

    important quality newspapers in Germany - Focus on politics, business, sports - International fame because of Panama Papers and Paradise Papers Katharina Brunner, Martina Schories 3
  3. What is data journalism #ddj? In contrast to traditional journalism

    which is based on qualitative reporting, data journalism is based on quantitative reporting. Our protagonists are means or filtered columns or standard deviations. But at first there is always the question: Which data could answer your question? How can we get it? How to extract the information? Be aware: Data only tells that something IS, but never WHY. Katharina Brunner, Martina Schories 4
  4. We use R in different parts of data journalism •

    How to analyse crowd-sourced answers • Show more uncertainty to be more precise • Using text mining in political reporting • Automated text generation for election coverage • When all you got is a hammer, everything looks like nails • Getting an idea of the blackbox Facebook Katharina Brunner, Martina Schories 6
  5. How to analyse crowd-sourced answers "Der Mietmarkt ist kaputt" (German,

    English) Katharina Brunner, Martina Schories 7
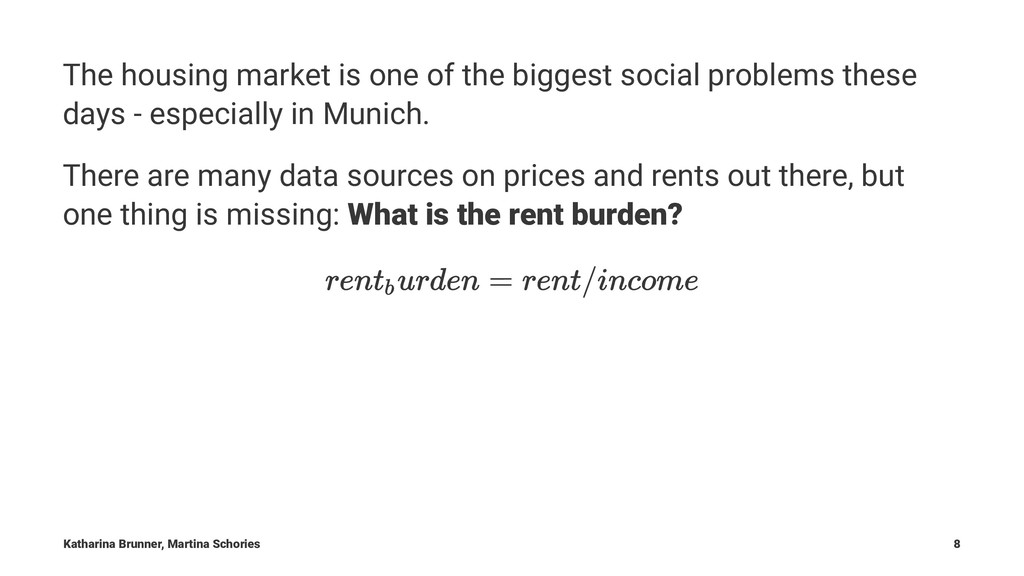
  6. The housing market is one of the biggest social problems

    these days - especially in Munich. There are many data sources on prices and rents out there, but one thing is missing: What is the rent burden? Katharina Brunner, Martina Schories 8
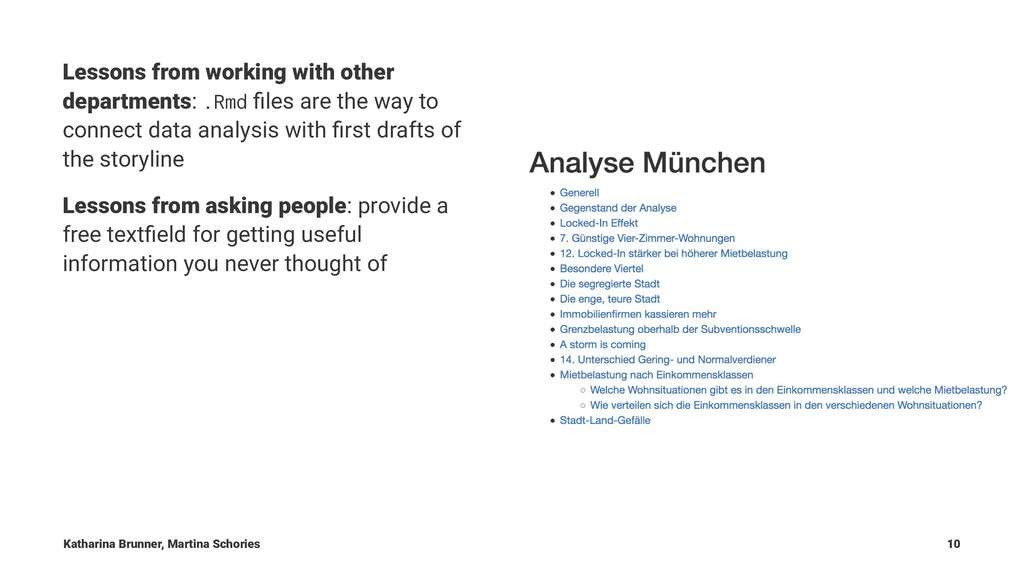
  7. Lessons from working with other departments: .Rmd files are the

    way to connect data analysis with first drafts of the storyline Lessons from asking people: provide a free textfield for getting useful information you never thought of Katharina Brunner, Martina Schories 10
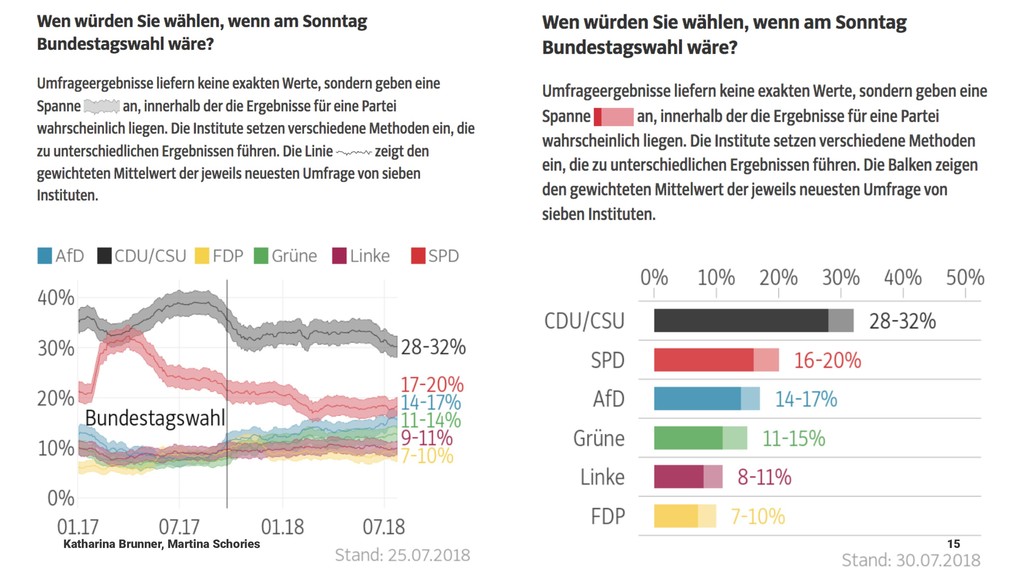
  8. Show more uncertainty to be more precise "Wie wir über

    Umfragen berichten" (German, English) Katharina Brunner, Martina Schories 11
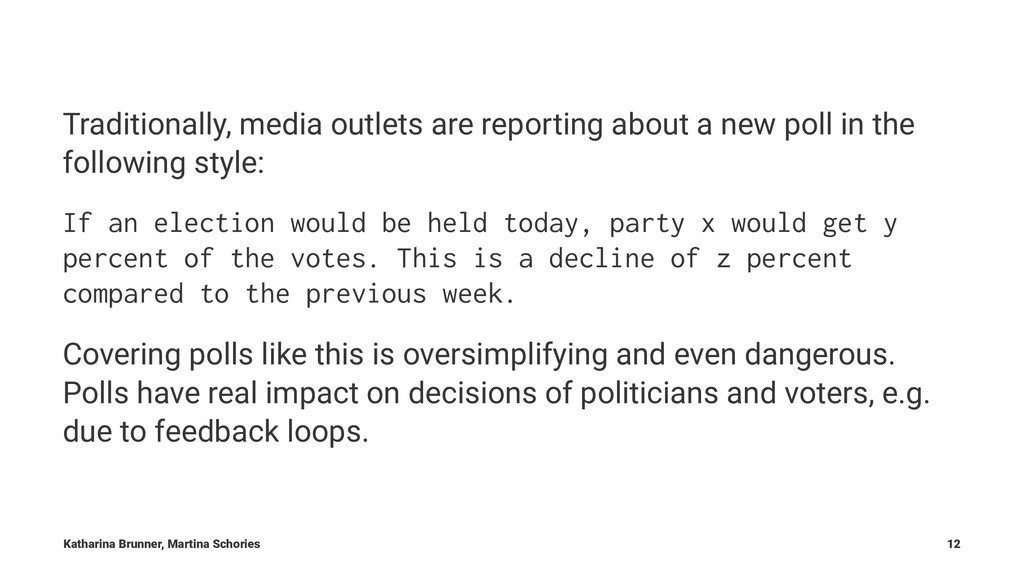
  9. Traditionally, media outlets are reporting about a new poll in

    the following style: If an election would be held today, party x would get y percent of the votes. This is a decline of z percent compared to the previous week. Covering polls like this is oversimplifying and even dangerous. Polls have real impact on decisions of politicians and voters, e.g. due to feedback loops. Katharina Brunner, Martina Schories 12
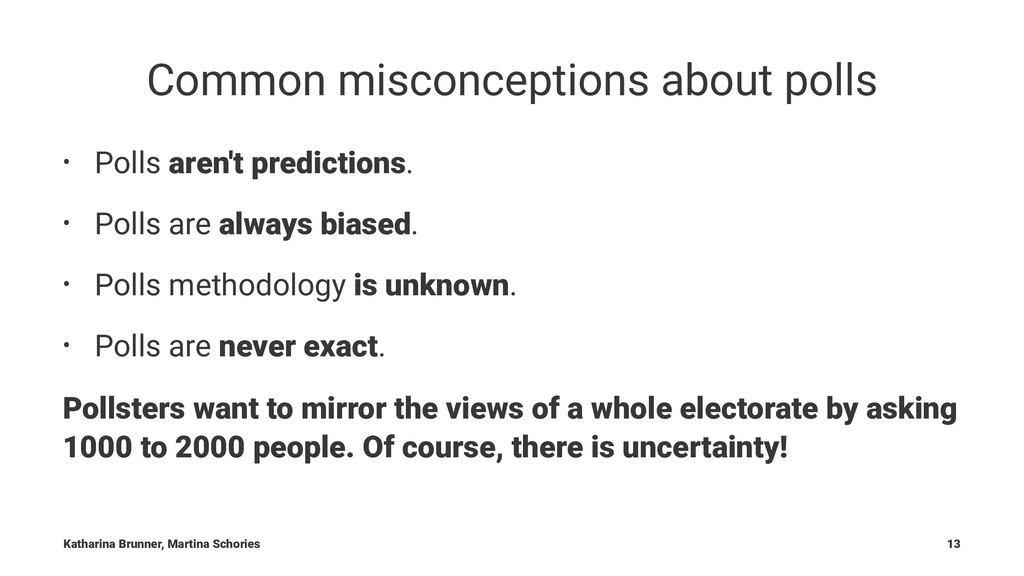
  10. Common misconceptions about polls • Polls aren't predictions. • Polls

    are always biased. • Polls methodology is unknown. • Polls are never exact. Pollsters want to mirror the views of a whole electorate by asking 1000 to 2000 people. Of course, there is uncertainty! Katharina Brunner, Martina Schories 13
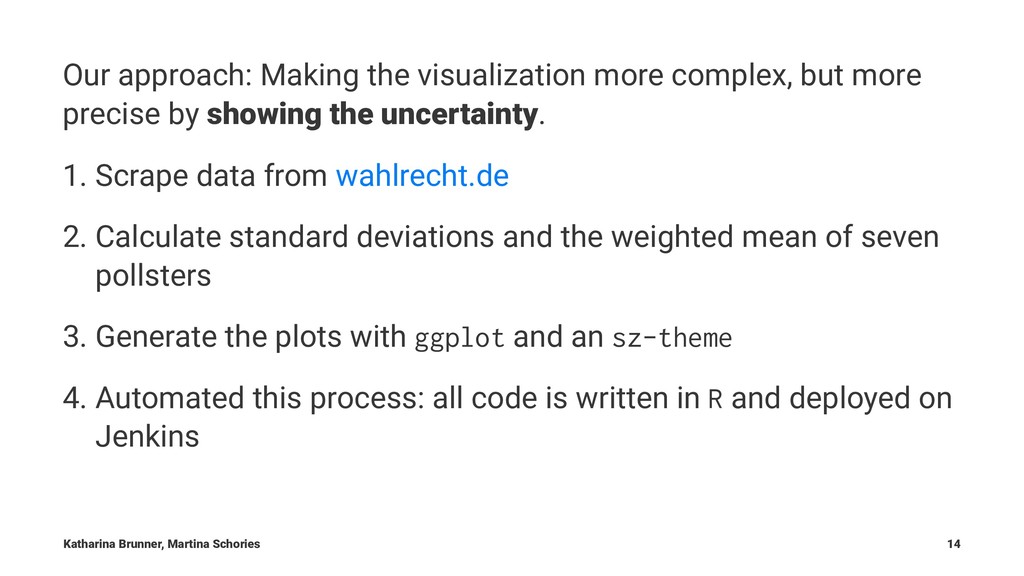
  11. Our approach: Making the visualization more complex, but more precise

    by showing the uncertainty. 1. Scrape data from wahlrecht.de 2. Calculate standard deviations and the weighted mean of seven pollsters 3. Generate the plots with ggplot and an sz-theme 4. Automated this process: all code is written in R and deployed on Jenkins Katharina Brunner, Martina Schories 14
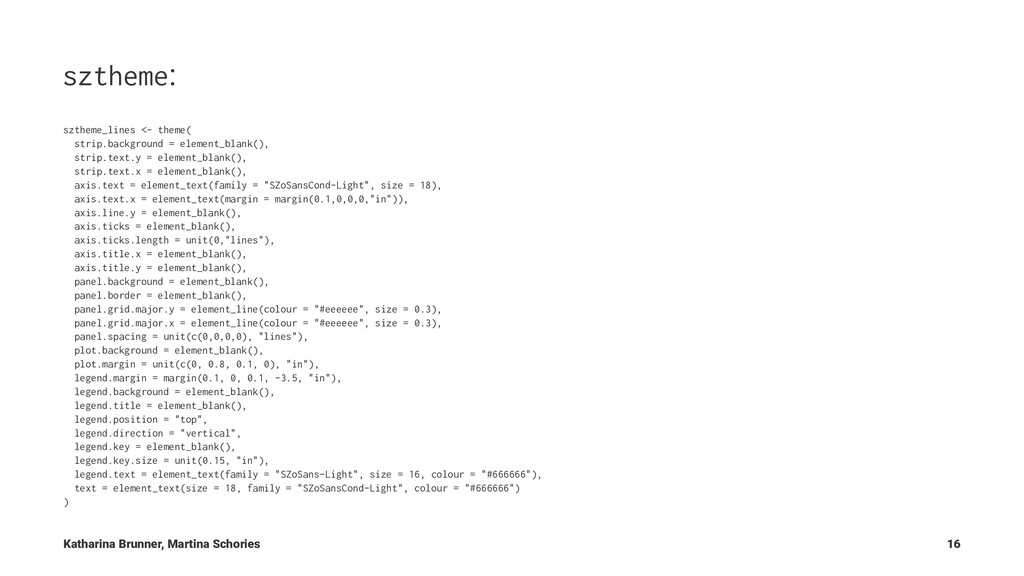
  12. sztheme: sztheme_lines <- theme( strip.background = element_blank(), strip.text.y = element_blank(),

    strip.text.x = element_blank(), axis.text = element_text(family = "SZoSansCond-Light", size = 18), axis.text.x = element_text(margin = margin(0.1,0,0,0,"in")), axis.line.y = element_blank(), axis.ticks = element_blank(), axis.ticks.length = unit(0,"lines"), axis.title.x = element_blank(), axis.title.y = element_blank(), panel.background = element_blank(), panel.border = element_blank(), panel.grid.major.y = element_line(colour = "#eeeeee", size = 0.3), panel.grid.major.x = element_line(colour = "#eeeeee", size = 0.3), panel.spacing = unit(c(0,0,0,0), "lines"), plot.background = element_blank(), plot.margin = unit(c(0, 0.8, 0.1, 0), "in"), legend.margin = margin(0.1, 0, 0.1, -3.5, "in"), legend.background = element_blank(), legend.title = element_blank(), legend.position = "top", legend.direction = "vertical", legend.key = element_blank(), legend.key.size = unit(0.15, "in"), legend.text = element_text(family = "SZoSans-Light", size = 16, colour = "#666666"), text = element_text(size = 18, family = "SZoSansCond-Light", colour = "#666666") ) Katharina Brunner, Martina Schories 16
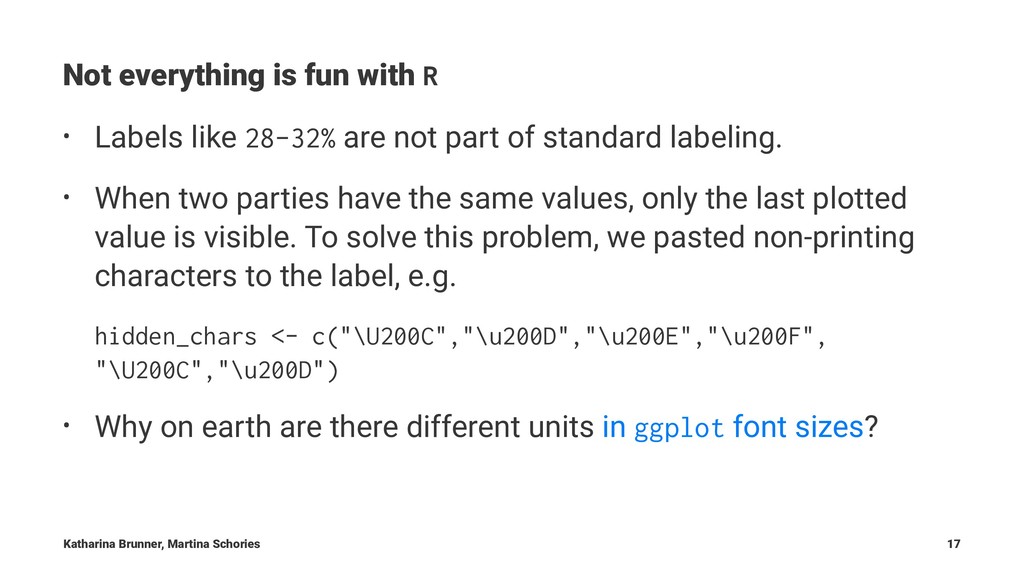
  13. Not everything is fun with R • Labels like 28-32%

    are not part of standard labeling. • When two parties have the same values, only the last plotted value is visible. To solve this problem, we pasted non-printing characters to the label, e.g. hidden_chars <- c("\U200C","\u200D","\u200E","\u200F", "\U200C","\u200D") • Why on earth are there different units in ggplot font sizes? Katharina Brunner, Martina Schories 17
  14. More about our approach: • Code on Github • Methodology:

    Wie wir über Umfragen berichten - in English: How we report on polls • Umfragen sind nur ein Schnappschuss der Gegenwart - in English: Surveys are just a snapshot of the present • Süddeutsche Zeitung is improving the way media reports on political polls: @GENinnovate about the project Katharina Brunner, Martina Schories 18
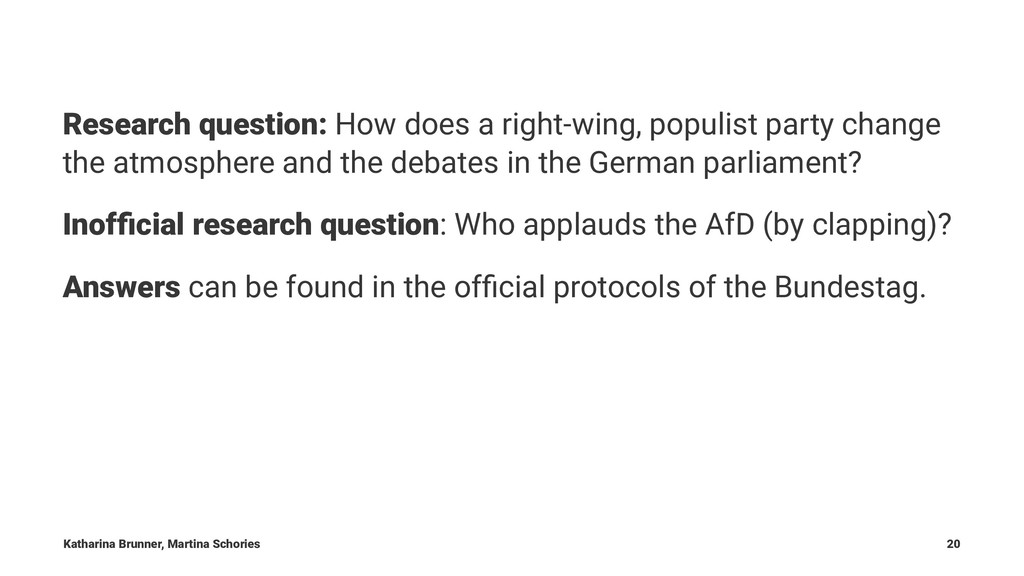
  15. Research question: How does a right-wing, populist party change the

    atmosphere and the debates in the German parliament? Inofficial research question: Who applauds the AfD (by clapping)? Answers can be found in the official protocols of the Bundestag. Katharina Brunner, Martina Schories 20
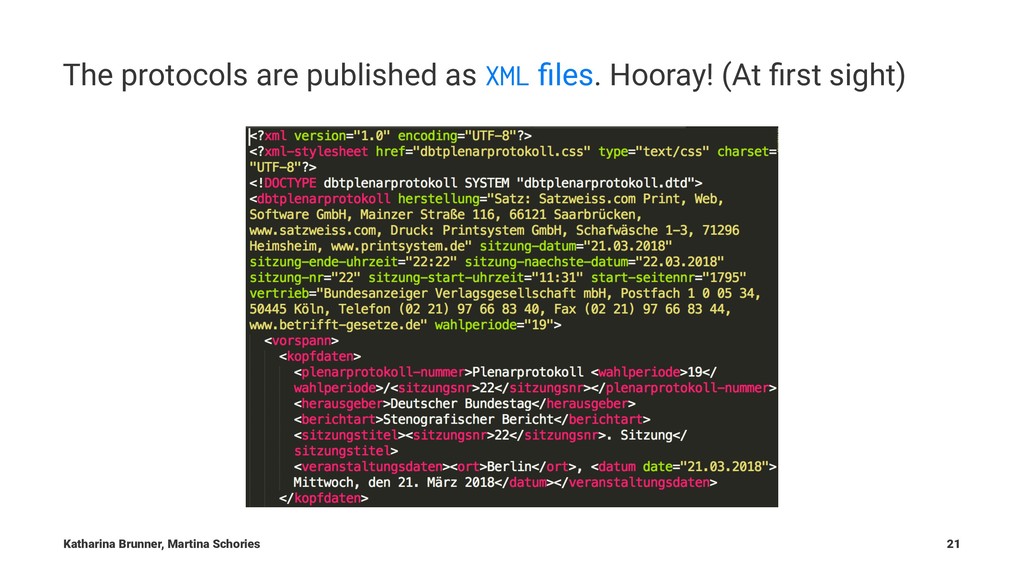
  16. The protocols are published as XML files. Hooray! (At first

    sight) Katharina Brunner, Martina Schories 21
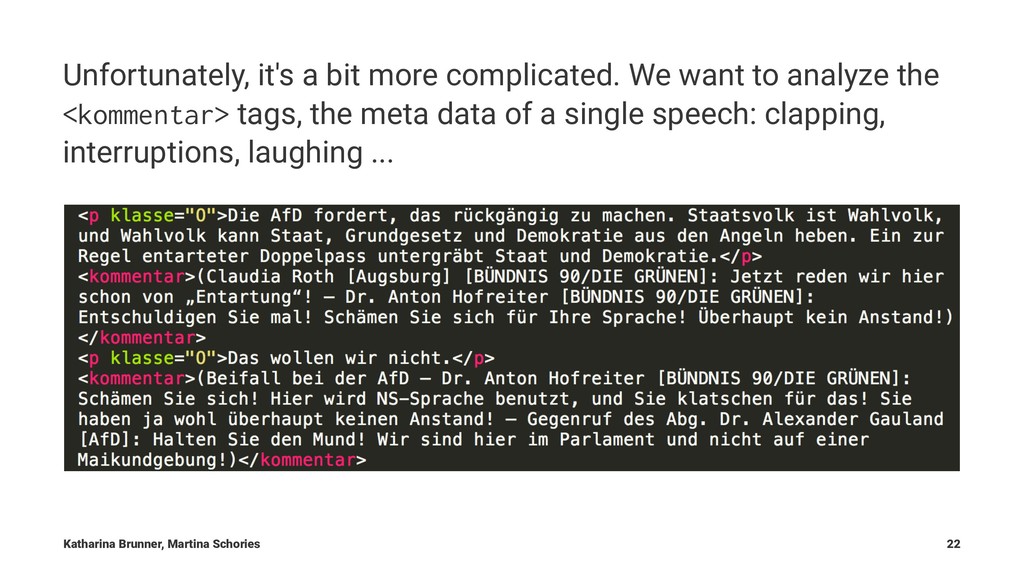
  17. Unfortunately, it's a bit more complicated. We want to analyze

    the <kommentar> tags, the meta data of a single speech: clapping, interruptions, laughing ... Katharina Brunner, Martina Schories 22
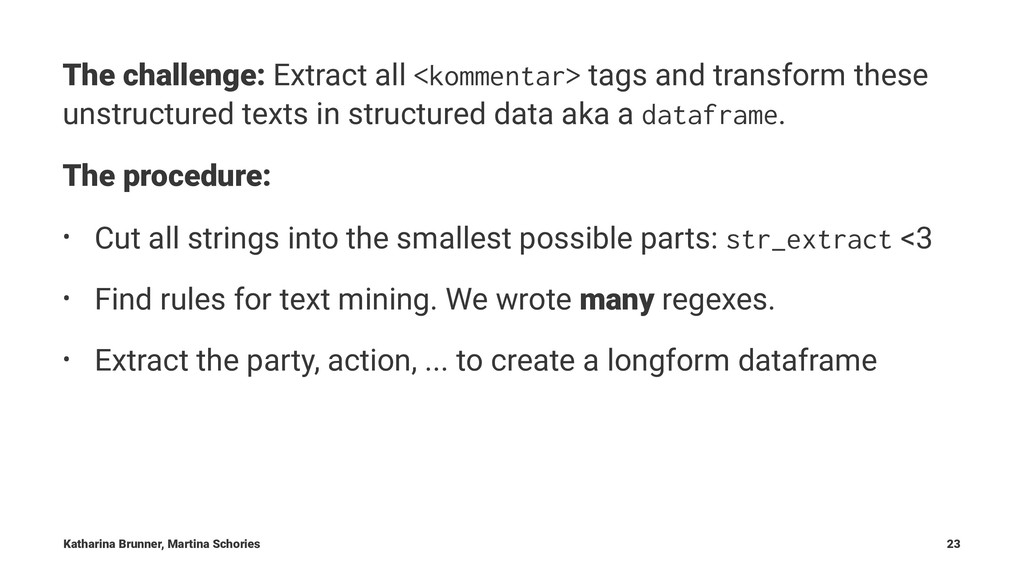
  18. The challenge: Extract all <kommentar> tags and transform these unstructured

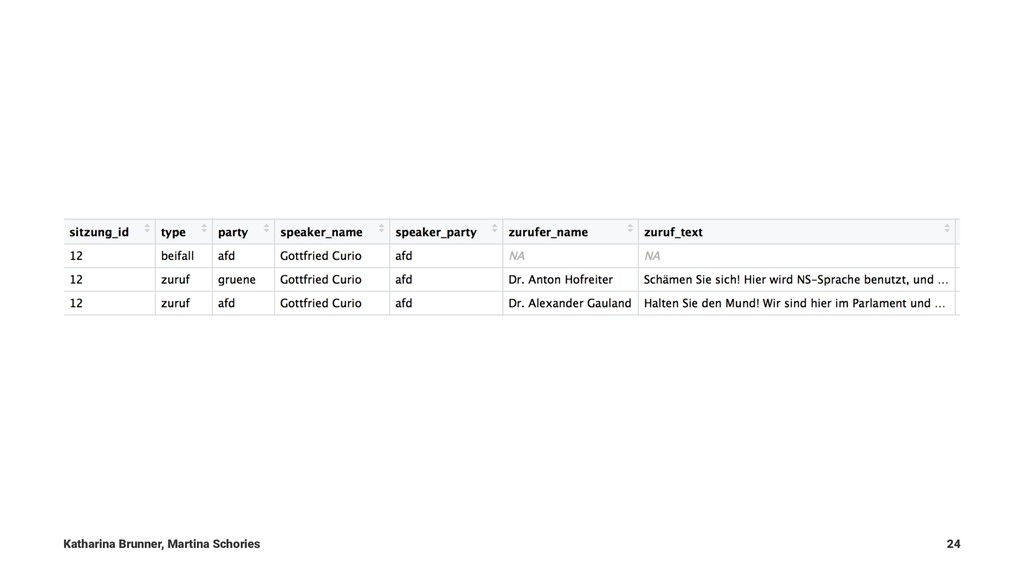
    texts in structured data aka a dataframe. The procedure: • Cut all strings into the smallest possible parts: str_extract <3 • Find rules for text mining. We wrote many regexes. • Extract the party, action, ... to create a longform dataframe Katharina Brunner, Martina Schories 23
  19. We did this for every protocol which resulted in a

    dataframe with • 24 396 rows for 24 meetings • more than 1500 speakers. Which stories can we find inside the data? Katharina Brunner, Martina Schories 25
  20. How to get from a dataframe to a story? We

    interview our dataset. A lot of filter(), select(), group_by, mutate(), ggplot(). And serveral .Rmd files later... The final questions and answers(!) our story is based on, you can find on Github. Katharina Brunner, Martina Schories 26
  21. More on that story Main story: Das gespaltene Parlament in

    German, Methodology Github Repository Katharina Brunner, Martina Schories 27
  22. Automated text generation for election coverage "Wie hat Ihr Wahlkreis

    gewählt" (German, English) Katharina Brunner, Martina Schories 28
  23. Context: After an election there are two tasks for journalism:

    1. report the results instantly (which is easy) 2. interpret the results (which is not that easy) We wanted to do these two things in an automated way and as fast as possible for all 299 election districts on the morning after the election. Katharina Brunner, Martina Schories 29
  24. User-centered approach: How did my election district vote? Compared to

    the national level and other districts? What we wanted: Offer useful interpretation, not just copying and publishing plain data you can find anywhere on the Internet. Katharina Brunner, Martina Schories 30
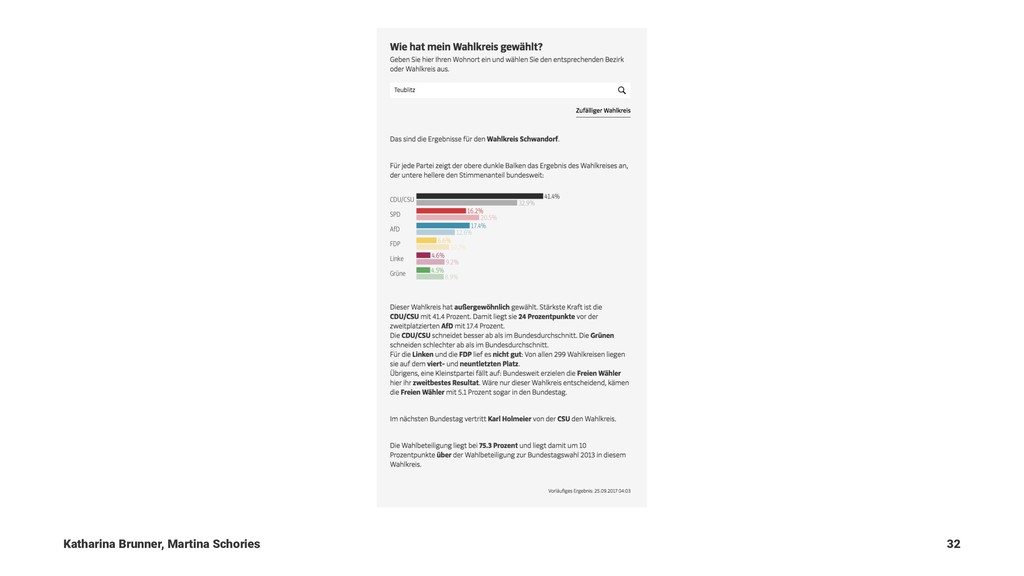
  25. Our solution: • auto-generated texts based on the results of

    every single district • bar charts for every district Katharina Brunner, Martina Schories 31
  26. Did a district vote extraordinarily? Similar to the national level?

    Just slightly different? Our method for finding differences between the districts was calculating jenks buckets for every party. The big advantage of Jenks is that they refer to the data and cluster them by the range: "seeks to minimize the variance within categories, while maximizing the variance between categories" (R documentation BAMMtools) Katharina Brunner, Martina Schories 33
  27. The hardest part: auto-generated German sentences that are good enough

    to be published at SZ, a newspaper that is proud of its high text quality (German grammar!) Because hardly none of the election districts are similar to the others, the possiblities of combining the sentences are “endless”. Katharina Brunner, Martina Schories 34
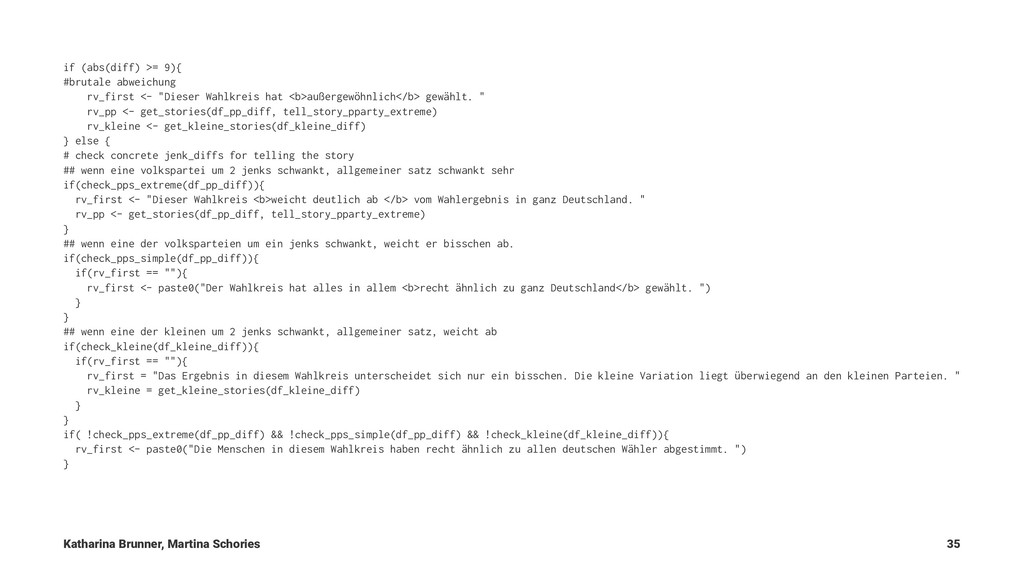
  28. if (abs(diff) >= 9){ #brutale abweichung rv_first <- "Dieser Wahlkreis

    hat <b>außergewöhnlich</b> gewählt. " rv_pp <- get_stories(df_pp_diff, tell_story_pparty_extreme) rv_kleine <- get_kleine_stories(df_kleine_diff) } else { # check concrete jenk_diffs for telling the story ## wenn eine volkspartei um 2 jenks schwankt, allgemeiner satz schwankt sehr if(check_pps_extreme(df_pp_diff)){ rv_first <- "Dieser Wahlkreis <b>weicht deutlich ab </b> vom Wahlergebnis in ganz Deutschland. " rv_pp <- get_stories(df_pp_diff, tell_story_pparty_extreme) } ## wenn eine der volksparteien um ein jenks schwankt, weicht er bisschen ab. if(check_pps_simple(df_pp_diff)){ if(rv_first == ""){ rv_first <- paste0("Der Wahlkreis hat alles in allem <b>recht ähnlich zu ganz Deutschland</b> gewählt. ") } } ## wenn eine der kleinen um 2 jenks schwankt, allgemeiner satz, weicht ab if(check_kleine(df_kleine_diff)){ if(rv_first == ""){ rv_first = "Das Ergebnis in diesem Wahlkreis unterscheidet sich nur ein bisschen. Die kleine Variation liegt überwiegend an den kleinen Parteien. " rv_kleine = get_kleine_stories(df_kleine_diff) } } if( !check_pps_extreme(df_pp_diff) && !check_pps_simple(df_pp_diff) && !check_kleine(df_kleine_diff)){ rv_first <- paste0("Die Menschen in diesem Wahlkreis haben recht ähnlich zu allen deutschen Wähler abgestimmt. ") } Katharina Brunner, Martina Schories 35
  29. From where we started: • a xml from the Bundeswahlleiter

    with election results from 2013 as training set • we knew the structure of the xml file that will be updated all night long after the election in 2017 Meaning: we were prepared! Katharina Brunner, Martina Schories 36
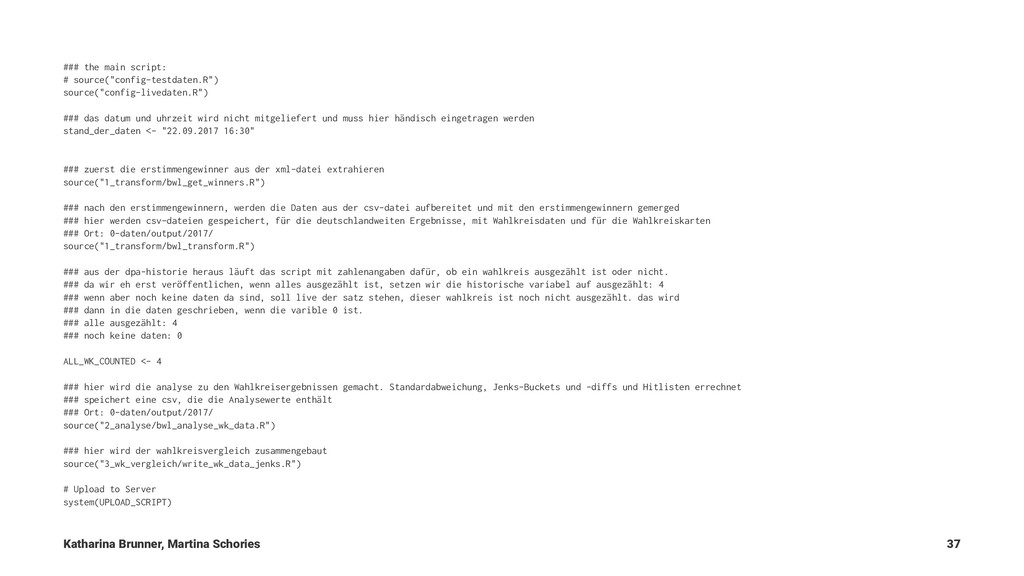
  30. ### the main script: # source("config-testdaten.R") source("config-livedaten.R") ### das datum

    und uhrzeit wird nicht mitgeliefert und muss hier händisch eingetragen werden stand_der_daten <- "22.09.2017 16:30" ### zuerst die erstimmengewinner aus der xml-datei extrahieren source("1_transform/bwl_get_winners.R") ### nach den erstimmengewinnern, werden die Daten aus der csv-datei aufbereitet und mit den erstimmengewinnern gemerged ### hier werden csv-dateien gespeichert, für die deutschlandweiten Ergebnisse, mit Wahlkreisdaten und für die Wahlkreiskarten ### Ort: 0-daten/output/2017/ source("1_transform/bwl_transform.R") ### aus der dpa-historie heraus läuft das script mit zahlenangaben dafür, ob ein wahlkreis ausgezählt ist oder nicht. ### da wir eh erst veröffentlichen, wenn alles ausgezählt ist, setzen wir die historische variabel auf ausgezählt: 4 ### wenn aber noch keine daten da sind, soll live der satz stehen, dieser wahlkreis ist noch nicht ausgezählt. das wird ### dann in die daten geschrieben, wenn die varible 0 ist. ### alle ausgezählt: 4 ### noch keine daten: 0 ALL_WK_COUNTED <- 4 ### hier wird die analyse zu den Wahlkreisergebnissen gemacht. Standardabweichung, Jenks-Buckets und -diffs und Hitlisten errechnet ### speichert eine csv, die die Analysewerte enthält ### Ort: 0-daten/output/2017/ source("2_analyse/bwl_analyse_wk_data.R") ### hier wird der wahlkreisvergleich zusammengebaut source("3_wk_vergleich/write_wk_data_jenks.R") # Upload to Server system(UPLOAD_SCRIPT) Katharina Brunner, Martina Schories 37
  31. When all you got is a hammer, everything looks like

    nails "Hire and Fire" unter Trump (German, English) Katharina Brunner, Martina Schories 38
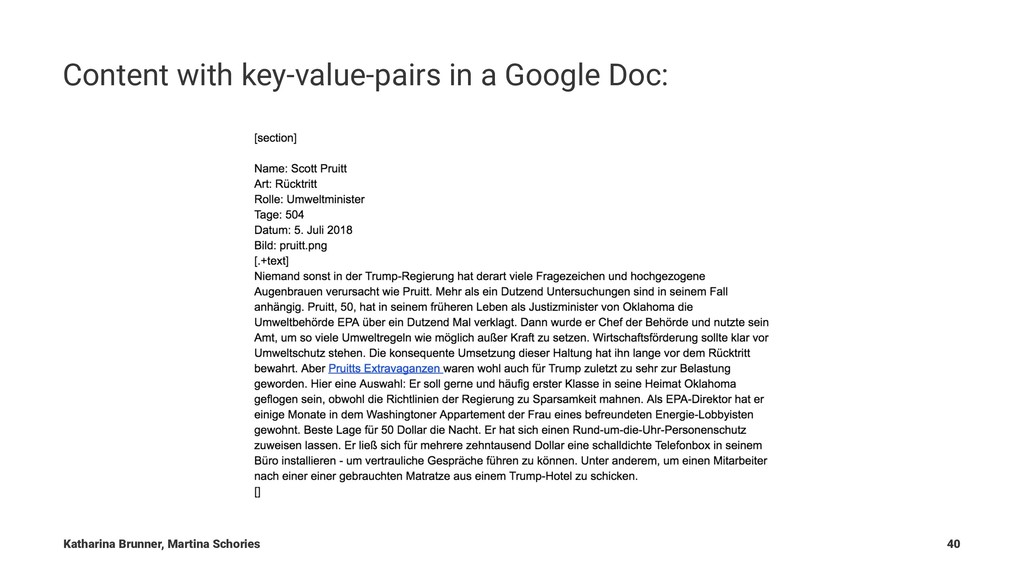
  32. Problem: In many newsrooms the software for publishing is not

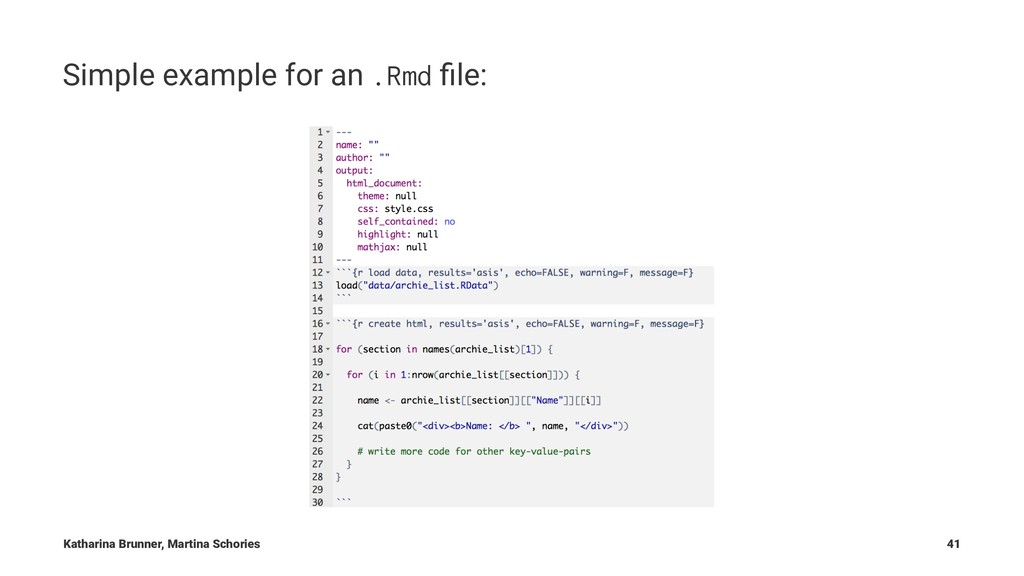
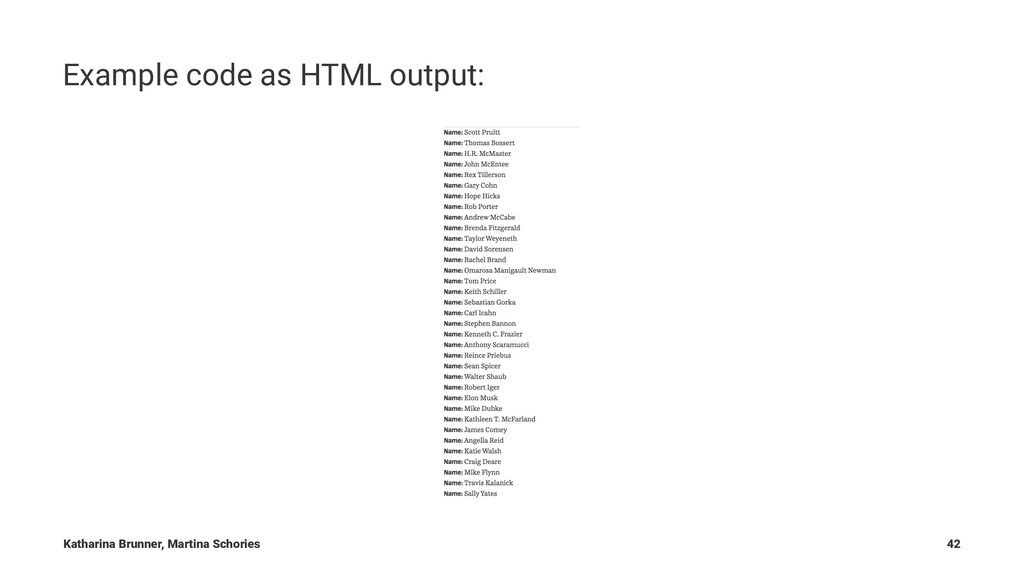
    up-to-date. For example, the Content Management Systems are not flexible enough to cope with modern formats in journalism. Solution: • We created a system that uses Google Docs as input, by using ArchieML created by the NYTimes. • we import that data into R and build html websites with .Rmd files. Katharina Brunner, Martina Schories 39
  33. Getting an idea of the blackbox Facebook Der Facebook-Faktor -

    Wie das soziale Netzwerk die Wahl beeinflusst (German, English) Katharina Brunner, Martina Schories 43
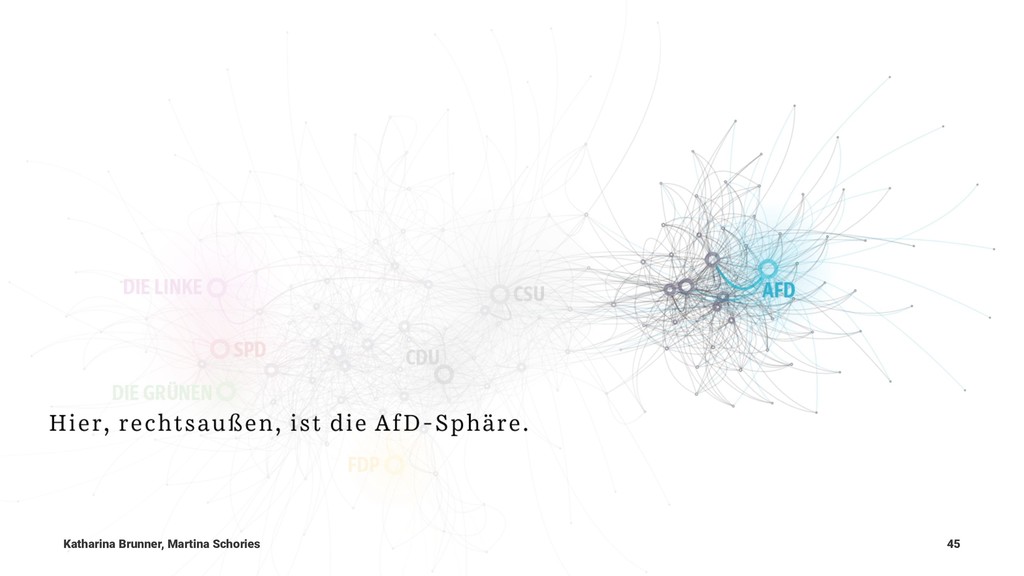
  34. Goal: Investigating the political sphere on Facebook by crawling the

    sites of political parties and active users. • We evaluated more than one million public Facebook likes from a little less than 5000 politically interested Facebook users. • Data is stored in the graph database Neo4J Katharina Brunner, Martina Schories 44
  35. Role of R: • export data from Neo4J • aggregate

    the user data to get a sense of echo chambers • a lot of data transforming Katharina Brunner, Martina Schories 46
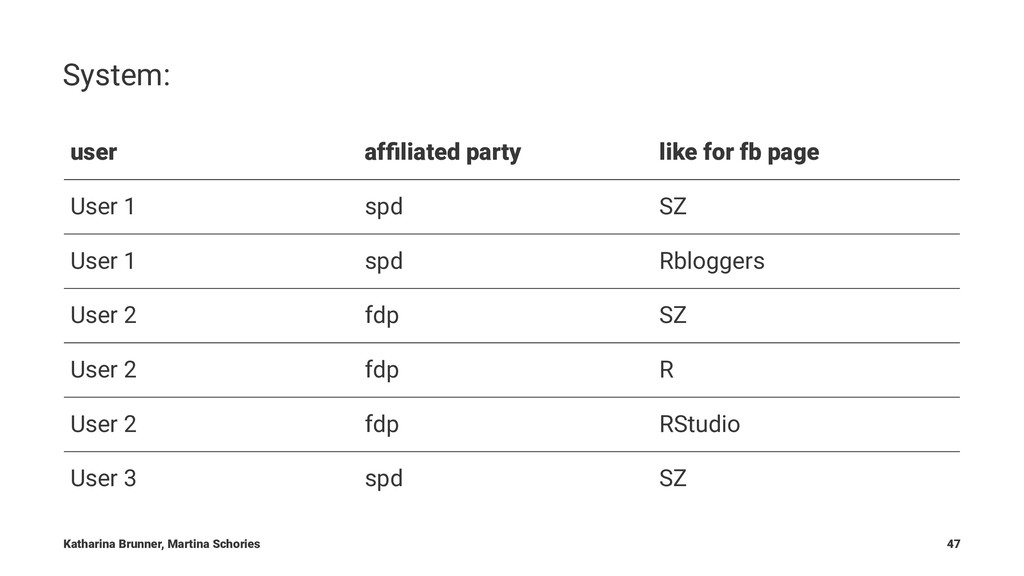
  36. System: user affiliated party like for fb page User 1

    spd SZ User 1 spd Rbloggers User 2 fdp SZ User 2 fdp R User 2 fdp RStudio User 3 spd SZ Katharina Brunner, Martina Schories 47
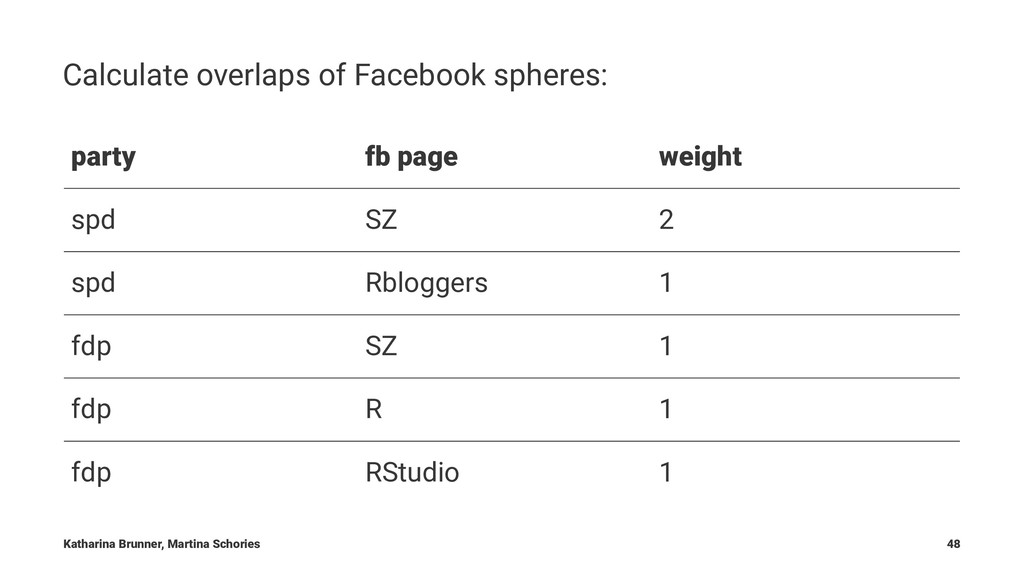
  37. Calculate overlaps of Facebook spheres: party fb page weight spd

    SZ 2 spd Rbloggers 1 fdp SZ 1 fdp R 1 fdp RStudio 1 Katharina Brunner, Martina Schories 48
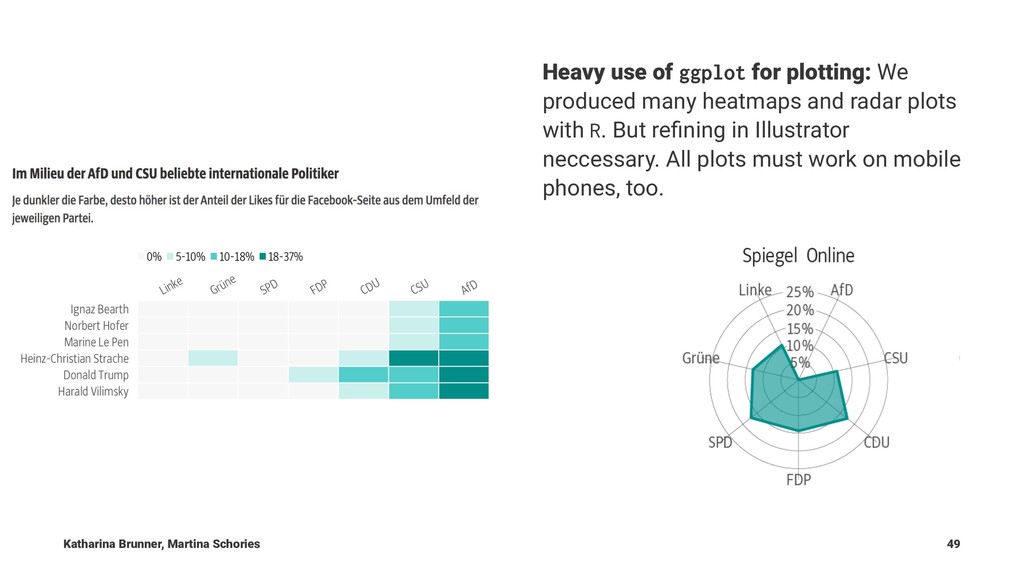
  38. Heavy use of ggplot for plotting: We produced many heatmaps

    and radar plots with R. But refining in Illustrator neccessary. All plots must work on mobile phones, too. Katharina Brunner, Martina Schories 49
  39. More on the Facebook Factor • Main story: Der Facebook

    Faktor • Methodology: So haben wir die Daten recherchiert • Von AfD bis Linkspartei - so politisch ist Facebook • Was links und rechts verbindet - und trennt • Wie es in Facebooks Echokammern aussieht - von links bis rechts • All stories Katharina Brunner, Martina Schories 50