Upgrade to Pro — share decks privately, control downloads, hide ads and more …

ENCASE

Data Intelligence
June 28, 2017
83

 ENCASE

Antonia Gogoglou, Aristotle University of Thessaloniki, SignalGeneriX Ltd Cyprus
Audience level: Intermediate
Topic area: Modeling
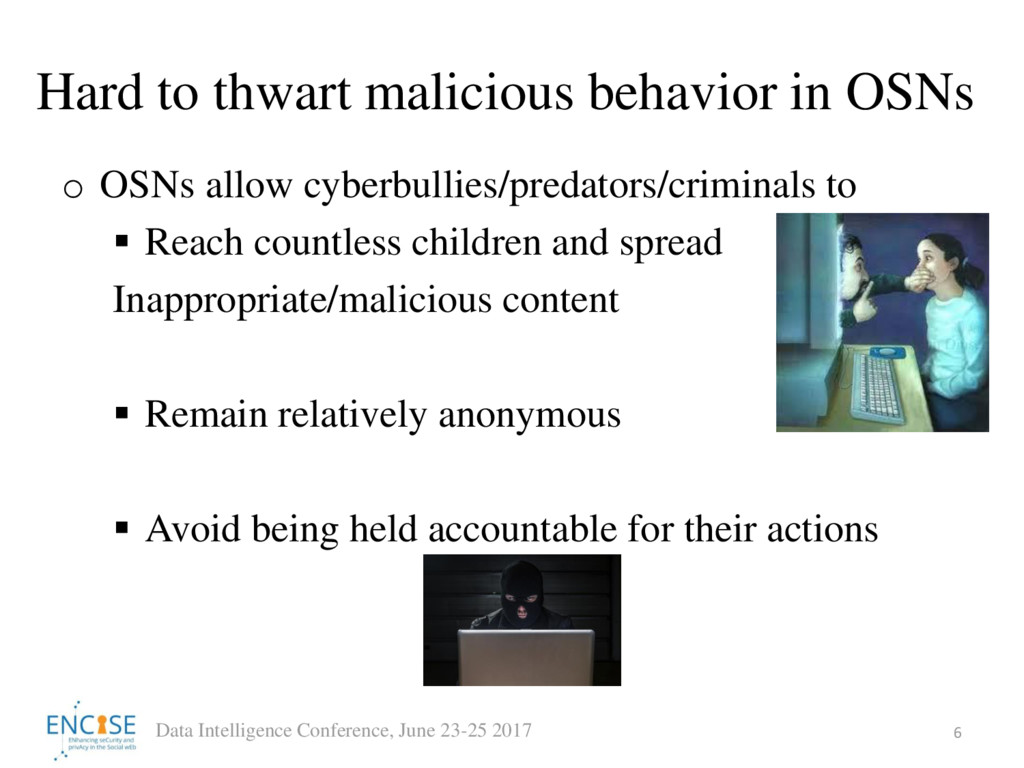
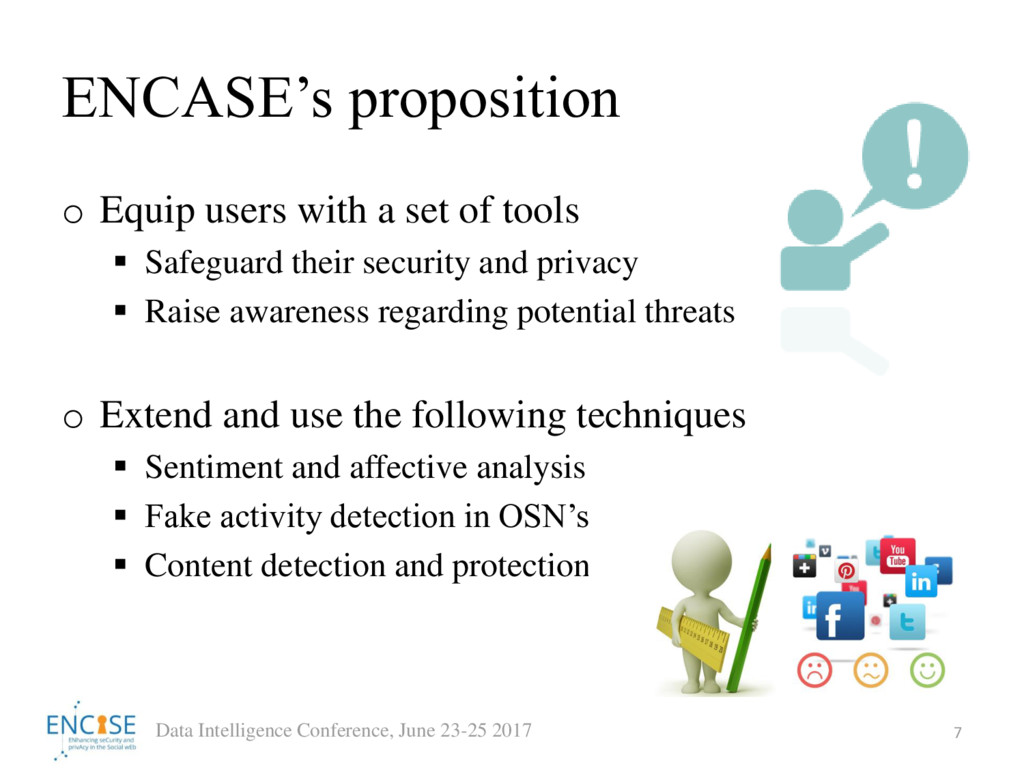
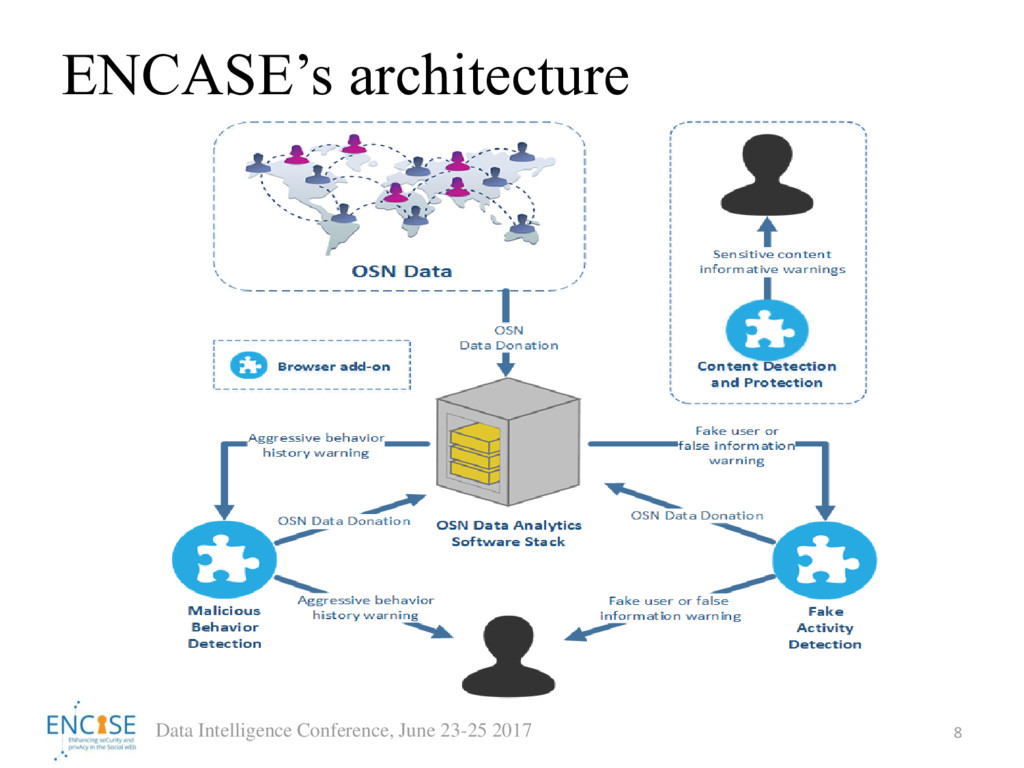
The ENCASE project aims to leverage the latest advances in web security and privacy to design and implement a browser-based architecture for the protection of minors from malicious actors in online social networks, by exploiting sentiment and affective analysis along with graph mining.

Data Intelligence

June 28, 2017
Tweet

Transcript

  1. ENCASE: Raising awareness and safe guarding Online Social
    Networks

    View Slide

  2. Online abuse with minors as victims
    2
    Data Intelligence Conference, June 23-25 2017

    View Slide

  3. Cyberbullying
    3
    Data Intelligence Conference, June 23-25 2017

    View Slide

  4. An escalating problem: Criminal
    Communities
    4
    Data Intelligence Conference, June 23-25 2017

    View Slide

  5. Online Social Networks (OSN’s) (2)
    5
    Data Intelligence Conference, June
    23-25 2017
    o 42% of teenagers in USA between ages 15-17
    actively use Twitter
    o Popularity in younger kids has risen also with 21% of
    13-14 year old kids using Twitter in 2015
    o Young users often have different protection needs
    online and are more susceptible to bad influence

    View Slide

  6. Hard to thwart malicious behavior in OSNs
    o OSNs allow cyberbullies/predators/criminals to
    ▪ Reach countless children and spread
    Inappropriate/malicious content
    ▪ Remain relatively anonymous
    ▪ Avoid being held accountable for their actions
    6
    Data Intelligence Conference, June 23-25 2017

    View Slide

  7. ENCASE’s proposition
    o Equip users with a set of tools
    ▪ Safeguard their security and privacy
    ▪ Raise awareness regarding potential threats
    o Extend and use the following techniques
    ▪ Sentiment and affective analysis
    ▪ Fake activity detection in OSN’s
    ▪ Content detection and protection
    7
    Data Intelligence Conference, June 23-25 2017

    View Slide

  8. ENCASE’s architecture
    8
    Data Intelligence Conference, June 23-25 2017

    View Slide

  9. Approaches for OSN Analysis
    o Complex network analysis:
    ▪ A graph with non-trivial topological features
    ▪ Used often to represent real-world networks, such as social networks
    o Graph decomposition:
    ▪ Break down a complex graph into subparts
    ▪ Identify communities, spreading mechanisms, topological order, etc.
    o Feature selection:
    ▪ Relevant and influential factors that
    distinguish users
    o Machine Learning
    ▪ Classification of users, pattern recognition
    9
    Data Intelligence Conference, June 23-25 2017

    View Slide

  10. Motivation
    o Scenario:
    ▪ A kid makes a new connection in an OSN
    ▪ If that new connection has spam/bullying/aggressive behavior or is in
    contact with such malicious users  danger
    o Criminal hubs, social promoters, social butterflies, spam
    neighborhood and other influential groups:
    ▪ May affect youngsters in a different way compared to adults
    ▪ Need to be identified and flagged even before they shared explicit
    malicious content
    o Our contribution:
    ▪ Early detection framework to identify dangerous groups based on
    limited information
    ▪ Identified new category of potentially dangerous users: Social Bridges
    10
    Data Intelligence Conference, June 23-25 2017

    View Slide

  11. Dataset Description(1)
    o We chose Twitter for our experiments due to
    openness, accessibility and popularity
    o Original dataset from MPI [1] with more than 50
    million users
    ▪ We sampled a graph starting from
    500 spammers
    [1]
    http://socialnetworks.mpi-sws.org/datasets.html
    11
    Data Intelligence Conference, June 23-25 2017

    View Slide

  12. Dataset Description(2)
    o The graph was extracted based on the following
    relationships amongst users
    o The resulting dataset contains: 303,999 unique users
    and 1,002,316 links, directed and unweighted
    Data Intelligence Conference, June 23-25 2017 12

    View Slide

  13. Social Graph Analysis(1)
    o Connected components is a topological invariant of a
    graph
    o Is a subgraph in which any two nodes are connected
    with each other, and no additional edges or vertices
    from G can be included in the subgraph without
    breaking its property
    ▪ Strongly connected component (SCC): every
    node is reachable from every other node
    ▪ Tarjan algorithm: single pass DFS
    Data Intelligence Conference, June 23-25 2017 13

    View Slide

  14. Social Graph Analysis(2)
    o Tarjan algorithm:
    ▪ Nodes are placed in a stack in the order they are visited
    ▪ When the recursive call that visits node v and its
    descendants ends, v is left on the stack if there is a path to
    earlier nodes
    ▪ If not, v is removed  v is a root of a SCC, whose nodes
    have no connection to previous ones
    Data Intelligence Conference, June 23-25 2017 14

    View Slide

  15. Social Graph Analysis(3)
    Data Intelligence Conference, June 23-25 2017 15
    o Force Atlas layout
    by Jacomy et al
    o Core SCC
    o Peripheral SCC

    View Slide

  16. Social Graph Analysis(4)
    o K-core decomposition: partition a graph into layers
    from external to more central vertices
    o A subgraph is a k-core if and only if it is the
    maximal subgraph so that the degree
    of every node is greater or equal to k
    o k-shell contains all vertices belonging
    to the kth
    core but not the (k+1)th
    Data Intelligence Conference, June 23-25 2017 16
    k
    G G

    View Slide

  17. Social Graph Analysis(5)
    Data Intelligence Conference, June 23-25 2017 17
    o kmax
    core is the maximum k value for which Gk
    is non
    empty
    o Nodes belonging to the kmax
    core form the nucleus, a
    strongly connected globally distributed subset (73%
    malicious, 28% honest)
    o The largest connected component of the kmax
    -1 shell
    is the peer component (88% honest)

    View Slide

  18. Social Graph Analysis(6)
    Data Intelligence Conference, June 23-25 2017 18
    o Force Atlas layout
    o Core-periphery
    o Loosely connected
    nodes

    View Slide

  19. Social Graph Analysis(7)
    Data Intelligence Conference, June 23-25 2017 19
    o Modularity: the fraction of the edges that fall within
    given groups (communities) minus the expected
    fraction if edges were distributed at random
    o Taxonomy of vertices according to their modularity
    class (community membership)
    o Result depends on boundaries between communities
    (strict or loose), randomization method, etc.

    View Slide

  20. Social Graph Analysis(8)
    Data Intelligence Conference, June 23-25 2017 20
    o Detailed community
    segmentation
    o Yifan Hu layout
    ▪ The repulsive forces on
    one node from a cluster
    of distant nodes are
    approximated by a
    Barnes-Hut calculation,
    which treats them as one
    super node

    View Slide

  21. Social Bridges(1)
    Data Intelligence Conference, June 23-25 2017 21
    o Denser representation
    o Black: least populated
    community
    o Red: intermediate
    community
    o Green: largest well
    connected community

    View Slide

  22. Social Bridges(2)
    Data Intelligence Conference, June 23-25 2017 22
    o 92% of the least populated community are spammers
    o 87% of the intermediate community are spam
    followers
    o 96% of the largest connected community are honest
    users
    o Spammers (black) use intermediate (red) to penetrate
    the core of honest users (green)

    View Slide

  23. Social Bridges(3)
    Data Intelligence Conference, June 23-25 2017 23
    o Spam followers constituting the largest connected
    component of the intermediate community constitute
    the social bridges of spammers
    o They can prove dangerous to vulnerable impressionable
    users (e.g. children) & are hard to identify
    o From here on social bridges and spammers will be
    referred to as malicious users

    View Slide

  24. Social Bridges(4)
    Data Intelligence Conference, June 23-25 2017 24
    o Social bridges removed
    ▪ Spammers become disconnected
    from the major community
    o Evidence on the
    importance of social
    bridges
    o Innocent users become
    part of the expansive
    network of malicious users

    View Slide

  25. Feature Selection(1)
    o Network features to investigate graph topology and
    categorize users:
    ▪ In-Degree: incoming connections (followers)
    ▪ Out-Degree: outgoing connections (whom a user follows)
    ▪ Betweeness Centrality: number of shortest paths from all
    users to all others that pass through that specific node
    ▪ Closeness Centrality: average distance from a specific
    node to all others (here harmonic mean)
    Data Intelligence Conference, June 23-25 2017 25

    View Slide

  26. Feature Selection(2)
    ▪ Eigenvector Centrality: extended in-degree centrality
    awarding higher importance to links coming from more
    relevant nodes
    ▪ K-core number: largest integer k for a node such that this
    node exists in a graph where all vertices have degree >=k
    Data Intelligence Conference, June 23-25 2017 26

    View Slide

  27. Experiments and Results (1)
    o Utilizing social graph topology to alert users early on
    about the dangers of a new connection
    ▪ Classification (malicious – honest)
    o Highly imbalanced classes  4 approaches to deal
    with skewed dataset
    Data Intelligence Conference, June 23-25 2017 27

    View Slide

  28. Experiments and Results (2)
    o Approach 1: SMOTE, oversampling minority class and
    undersampling majority one (potential overfitting)
    o Approach 2: Cost Sensitive Learning, higher penalty to
    the misplaced points of minority class
    o Approach 3: Combination of 1 &2
    o Approach 4: Rejection Sampling with majority voting,
    each point independently included or not given a
    probability function determined by the misclassification
    cost of each class and the max classification cost
    Data Intelligence Conference, June 23-25 2017 28

    View Slide

  29. Experiments and Results (3)
    o 70% of the majority class (honest) – 70% sampled
    from the minority class (malicious)
    o 30% with natural imbalance
    o C-SVM classifier from LibSVM[1]
    o Performance metrics: F-measure and sensitivity of
    the minority class instead of accuracy
    Data Intelligence Conference, June 23-25 2017 29

    View Slide

  30. Experiments and Results (4)
    Data Intelligence Conference, June 23-25 2017 30
    o Why these approaches?
    ▪ A form of sampling is necessary to deal with
    imbalanced classes
    ▪ Cost sensitive learning mitigates skewness of data

    View Slide

  31. Experiments and Results (5)
    Data Intelligence Conference, June 23-25 2017 31

    View Slide

  32. Experiments and Results (6)
    o Appropriate sampling is allowing for the biggest increase
    in performance compared with cost assignment
    o Combination of Cost Sensitive and SMOTE with all
    features ensures highest performance
    o Most important feature: closeness centrality
    ▪ For graphs containing disconnected nodes it is the most
    representative metric for connectivity and topological position
    o Addition of k-core numbers also 27% improvement
    Data Intelligence Conference, June 23-25 2017 32

    View Slide

  33. Future Work
    Data Intelligence Conference, June 23-25 2017 33
    o Explore more groups that can prove to be potentially dangerous
    o Add more features to improve performance (text, multimedia, etc.)
    o In depth study of social dynamics to determine spreading
    mechanisms in OSNs real time (streaming)

    View Slide

  34. A Sneak Peek
    o User. Basic, i.e., avg. # posts, account age, #
    subscribed lists, Interarrival time
    o Text. Basic, i.e., # hashtags, # uppercases, #
    emoticons, # URLs, Sentiment, Hate and curse words
    Data Intelligence Conference, June 23-25 2017 34

    View Slide

  35. Thank you!
    ΤΕΧΝΟΛΟΓΙΚΟ ΠΑΝΕΠΙΣΤΗΜΙΟ ΚΥΠΡΟΥ
    CYPRUS UNIVERSITY OF TECHNOLOGY
    www.cut.ac.cy
    This work was funded by the European Unions Horizon 2020 research and innovation
    program under the Marie Skodowska-Curie grant agreement No 691025

    View Slide

  36. Some good reads!
    • Jacomy M, Venturini T, Heymann S, Bastian M (2014)
    ForceAtlas2: A Continuous Graph Layout Algorithm for Handy
    Network Visualization Designed for the Gephi Software, PLOS
    ONE 9(6): e98679.
    • Vincent D Blondel, Jean-Loup Guillaume, Renaud Lambiotte
    and Etienne Lefebvre, Fast unfolding of communities in large
    networks, IOP Publishing Ltd, Journal of Statistical Mechanics:
    Theory and Experiment, Volume 2008, October 2008
    • Heymann, S., Gephi, Encyclopedia of Social Network Analysis
    and Mining, (2014), Springer New York, p. 612--625
    • Hu YF (2005) Efficient and high quality force-directed graph
    drawing. Math J, 10:(37–71)

    View Slide