Upgrade to Pro — share decks privately, control downloads, hide ads and more …

When a Picture is Worth a Thousand Network Packets and System Logs

Data Intelligence
June 28, 2017
200

When a Picture is Worth a Thousand Network Packets and System Logs

Awalin Sopan FireEye Inc
Audience level: Intermediate
Topic area: Misc

Description

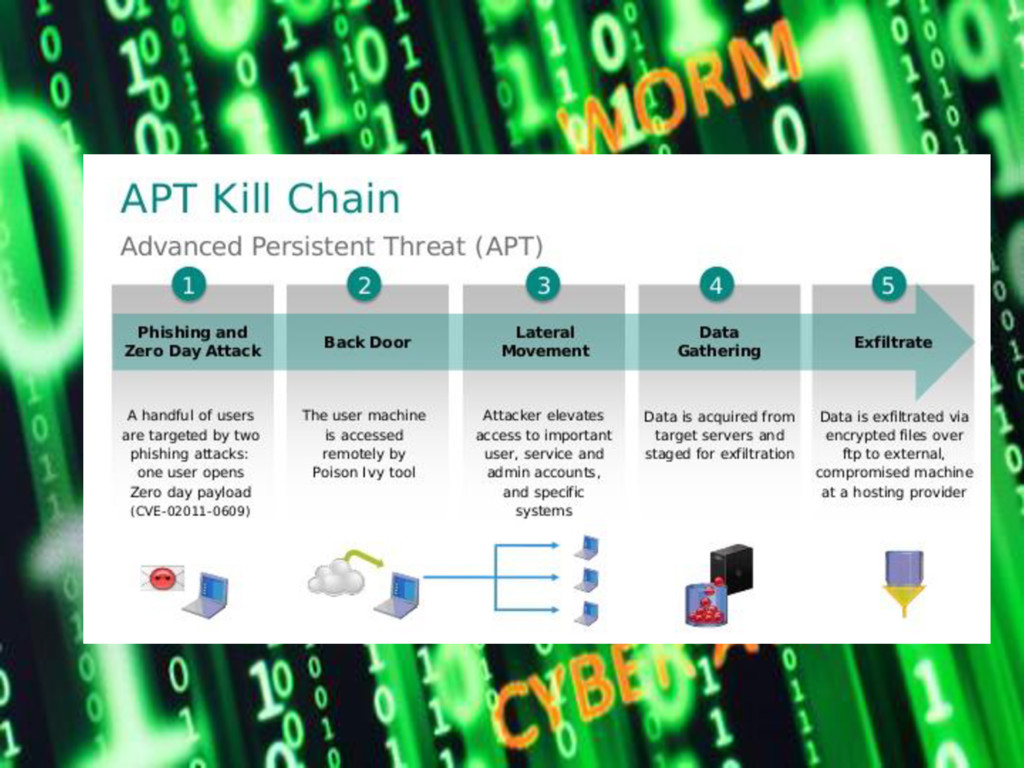
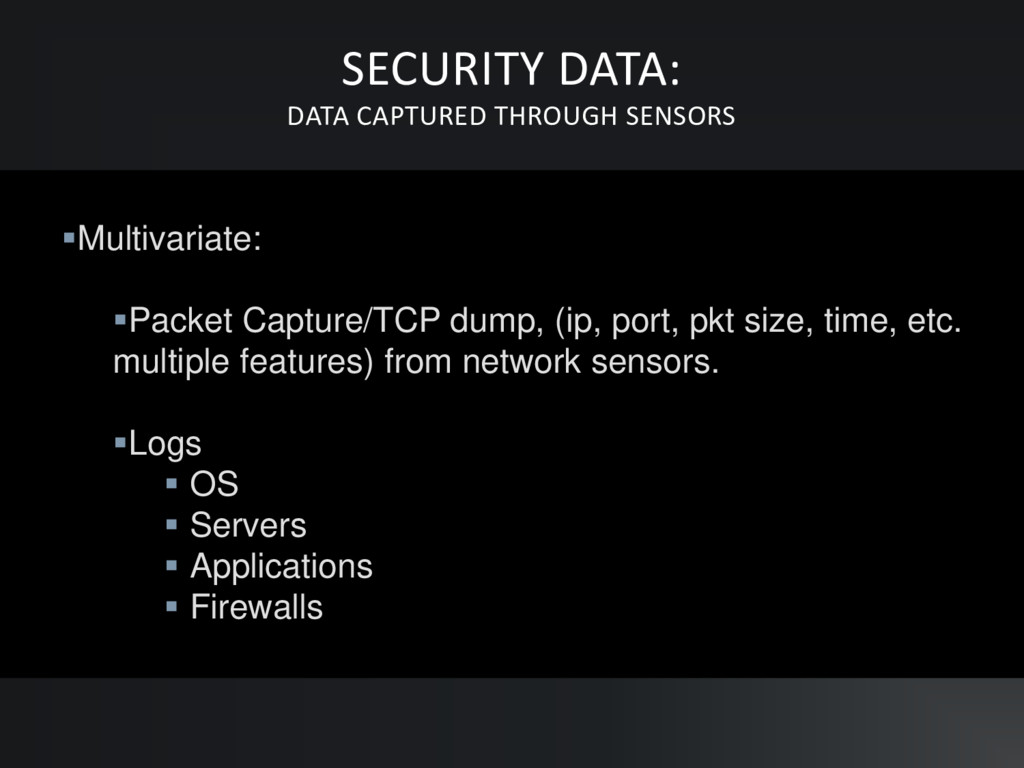
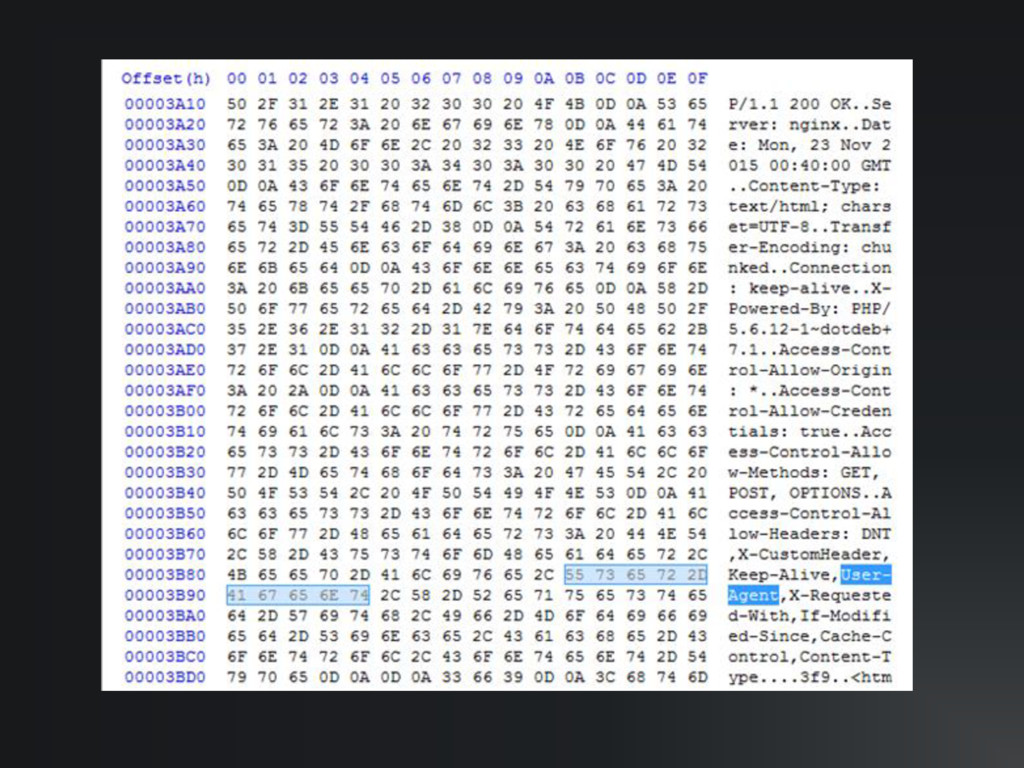
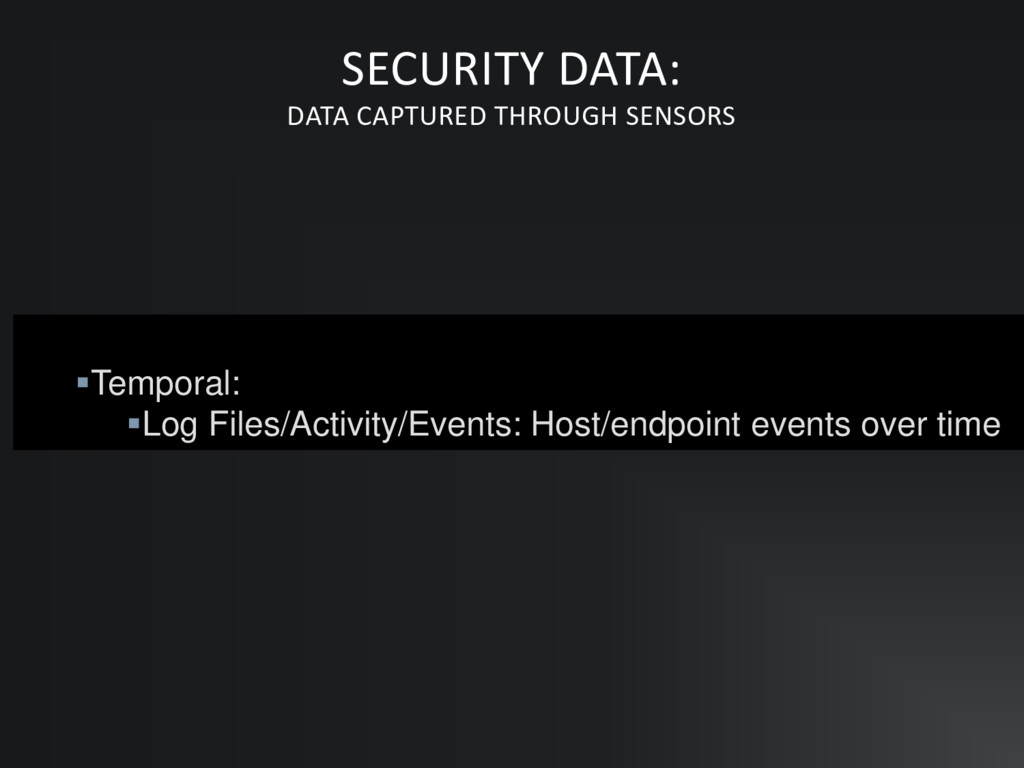
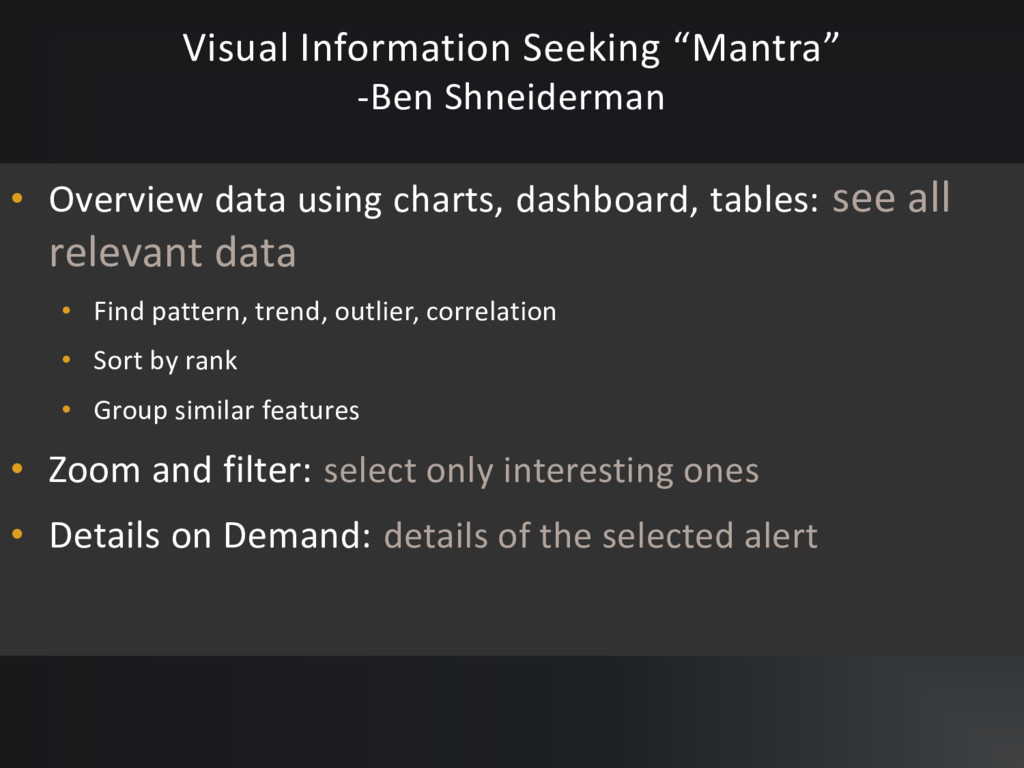
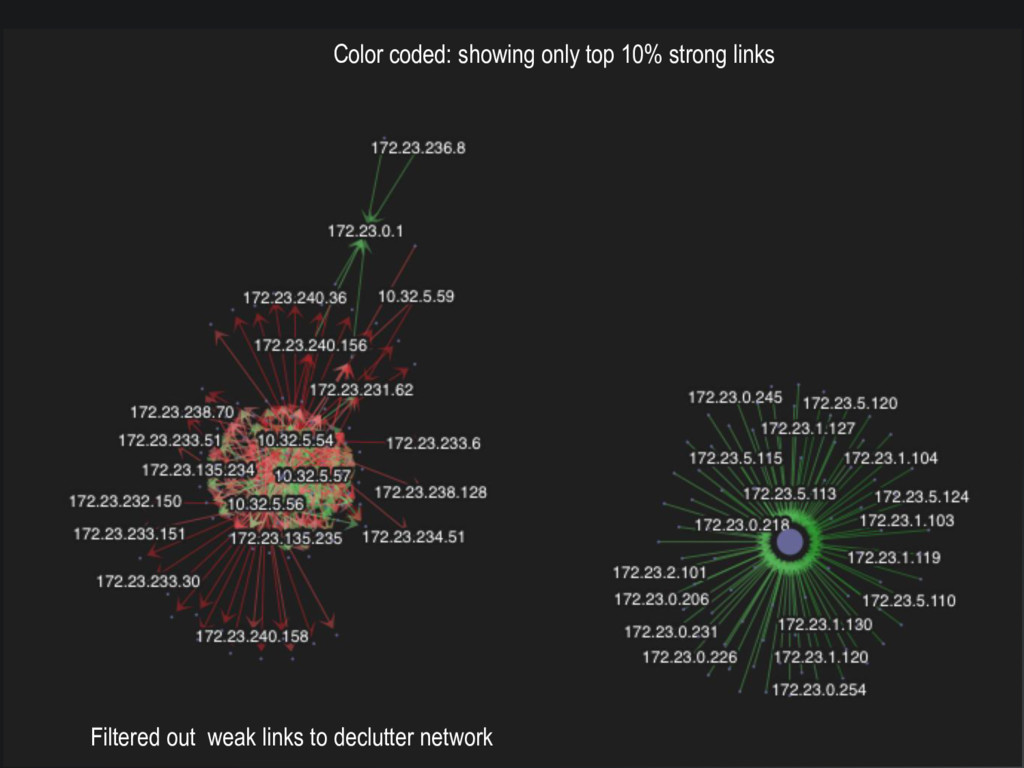
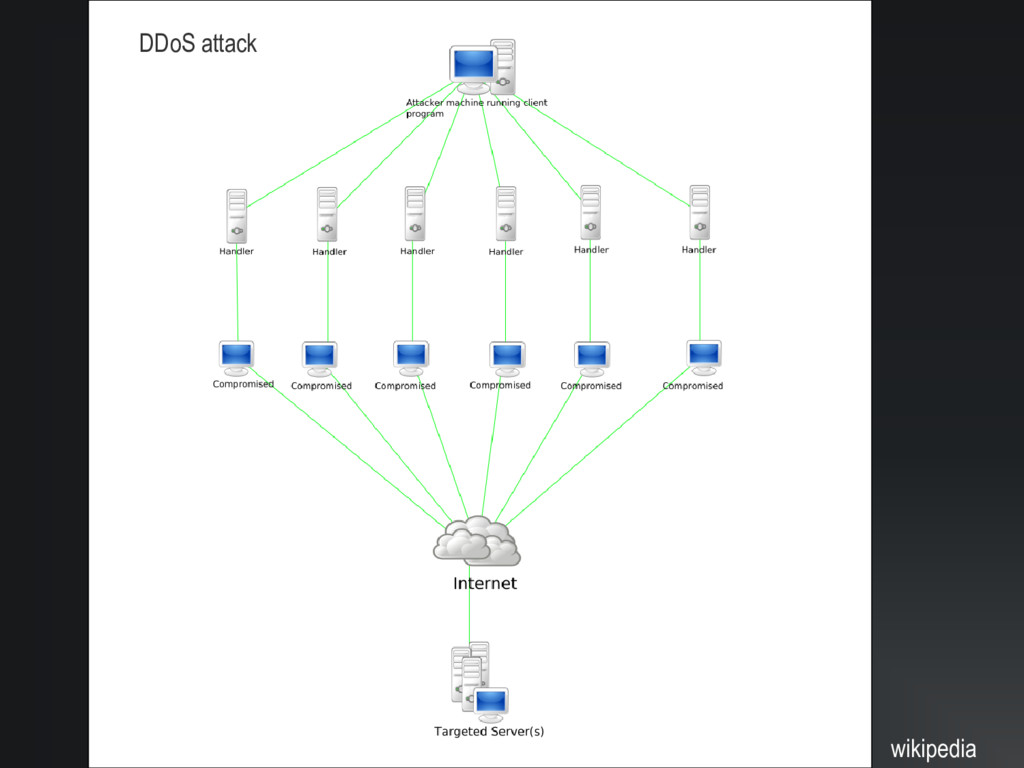
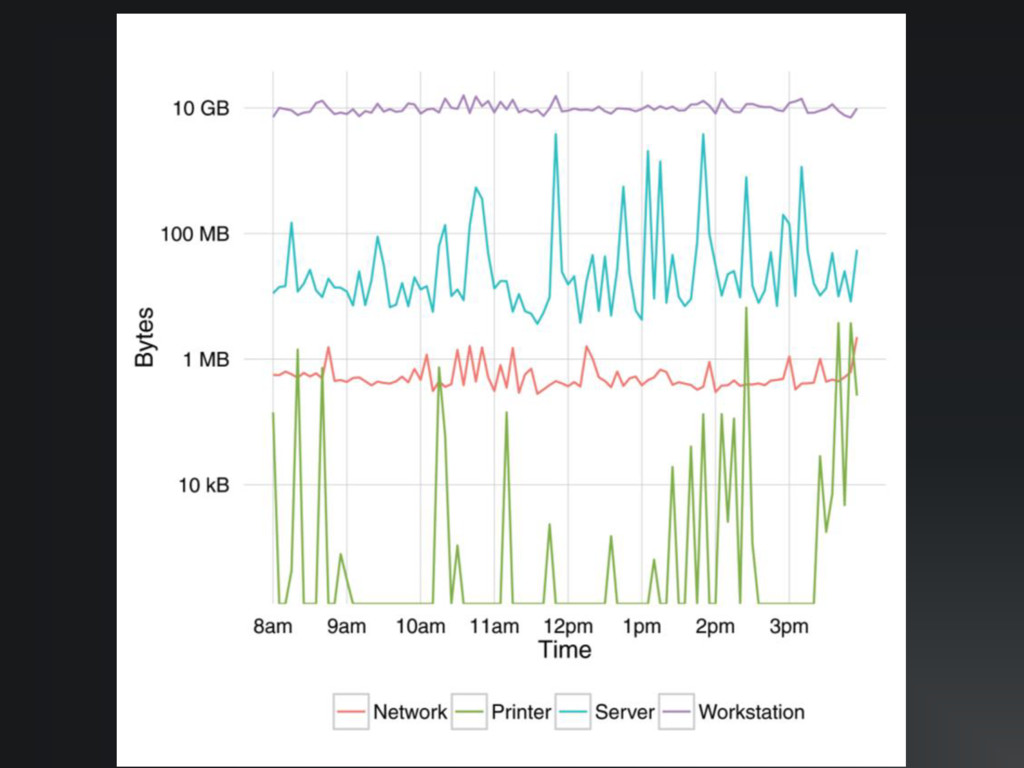
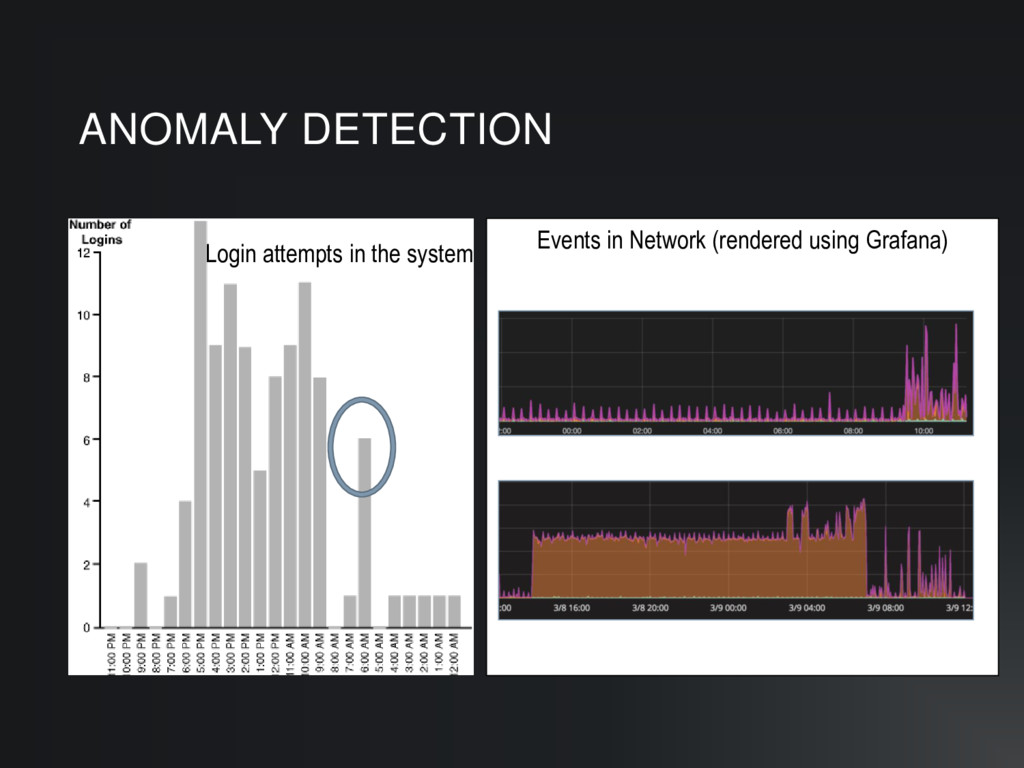
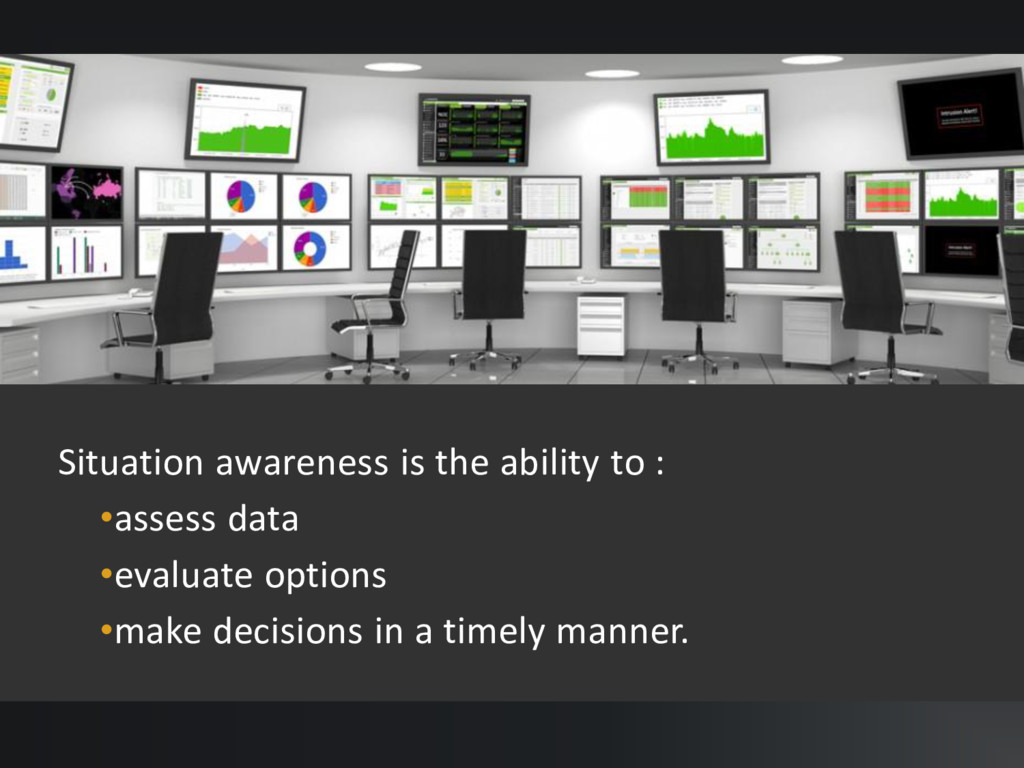
A typical Security Operation Center (SOC) employs security analysts who monitor security log from heterogeneous devices. The analysts identify whether there is a security threat and how to respond to that threat by analyzing that data. Visualizing this large-scale data to a succinct human digestible form can reduce their cognitive load and enable them to operate more efficiently.

Data Intelligence

June 28, 2017
Tweet

Transcript

  1. Over 200 attacks on major industrial control systems in 2013.

    “Cyber threat is one of the most serious economic and national security challenges we face as a nation”- White House Press release, May 29, 2009
  2. DEFENSE AGAINST CYBER ATTACK: Role of a Human (Cyber Analyst)

    • Detect intrusion • Recommend solution • Threat insight • Gather evidence • Prevent intrusion • Find vulnerability in the system • Block suspected traffic • Forensic analysis: • Create rules to detect future attack • Nature of attack
  3. ▪Multivariate: ▪Packet Capture/TCP dump, (ip, port, pkt size, time, etc.

    multiple features) from network sensors. ▪Logs ▪ OS ▪ Servers ▪ Applications ▪ Firewalls SECURITY DATA: DATA CAPTURED THROUGH SENSORS
  4. ▪Relational: ▪Flow data through Network: can be collected from routers:

    connection between IPs, hosts. SECURITY DATA: DATA CAPTURED THROUGH SENSORS
  5. • Communicate findings • Overview • Analyze: • Compare and

    Relate • Find trend/ pattern • Predict • Find anomaly WHY VISUALIZATION
  6. Visual Information Seeking “Mantra” -Ben Shneiderman • Overview data using

    charts, dashboard, tables: see all relevant data • Find pattern, trend, outlier, correlation • Sort by rank • Group similar features • Zoom and filter: select only interesting ones • Details on Demand: details of the selected alert
  7. DATA -> VISUALIZATION Multivariate Packet capture, tcp dump from network

    sensors, server logs, operating system logs, firewall logs: Host based Intrusion Detection System. Data with multiple variables like ip, port, packet size, time, etc. Table, scatter plot, bubble chart, parallel coordinate Relational/ Hierarchical Network data flow from routers, connection between ips, hosts. Top-down hierarchy of the system: Network Based Intrusion Detection System. Node-link diagram, matrix diagram. Pie chart, treemap. Tempor al Log file, activity events over time Line chart, time series, timeline, histogram, sparklines Designing the User Interface 4th Edition: Ben Shneiderman and Catherine Plaisant
  8. VAST 2012 Challenge Data: 2 days of Flow data Nodes

    sized by in-degree Sized by in-degree
  9. Color coded: showing only top 25% strong links Links color

    coded by strength: red low, green high
  10. MODES OF OPERATIONS Put it all together in analysts workflow:

    • Contextual views • Dashboard for overview • Visual analytics with multiple coordinated views • Situational awareness for immediate assessment
  11. Situation awareness is the ability to : •assess data •evaluate

    options •make decisions in a timely manner.
  12. • (Machine + Human) > Machine || Human. • Bridge

    the gap btwn security experts & dataviz experts. • Provide contextual clues to the analysts. • Integrate visual analytics in analyst workflow. • Make room for scalability and efficiency. • Avoid visual representations requiring lot of explanation. • Choose the network layout that avoids edge crossing or node overlapping. • Aggregation of data should be obvious. TAKE AWAY [email protected]