Upgrade to Pro — share decks privately, control downloads, hide ads and more …

V. Kupriyanov - The Power of Data-Driven Storyt...

DataViz CPH
May 02, 2019
34

V. Kupriyanov - The Power of Data-Driven Storytelling

Some principles behind data-driven storytelling in digital marketing, a few campaign examples, and learnings from the field.

DataViz CPH

May 02, 2019
Tweet

Transcript

  1. Why? Data = source of stories Viz is a powerful

    way to communicate them Interesting stories make for effective campaigns
  2. Core questions What does our audience care about? What topics

    are of interest to them? What content do they like to consume?
  3. 2) Grounding campaigns in data Government data and national statistics

    Industry reports Internal client data Surveys
  4. Core questions What data source can we use? How recent

    and comprehensive is the data? What biases does it carry?
  5. Core questions How do we visualise this? What makes the

    most sense for • audience • data • budget
  6. What are they interested in? Tech, innovation, the startup scene

    Famous tech companies Famous tech founders and entrepreneurs
  7. How can we enrich that knowledge? What data can we

    use? How can we visualise it in a way that would show something new?
  8. Four things we were after For each “mafioso” we wanted

    to find out the companies they went on to… 1. Start 2. Invest in 3. Lead 4. Advise
  9. Following the hunch We knew … that these guys founded

    some big-name companies … that they often worked and invested together But what we didn’t realise was just how connected they are
  10. Core story points The sheer degree of collaboration between members

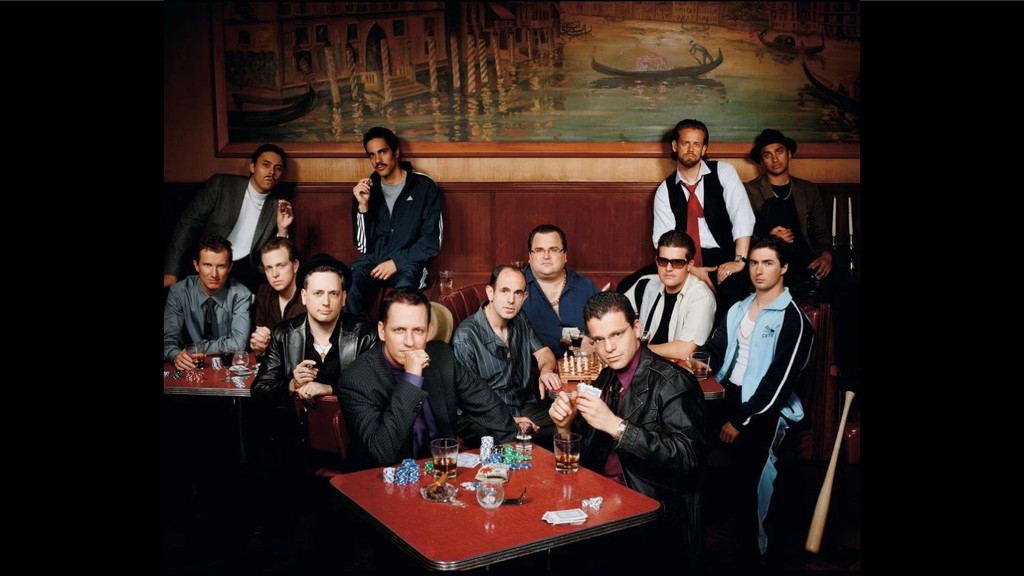
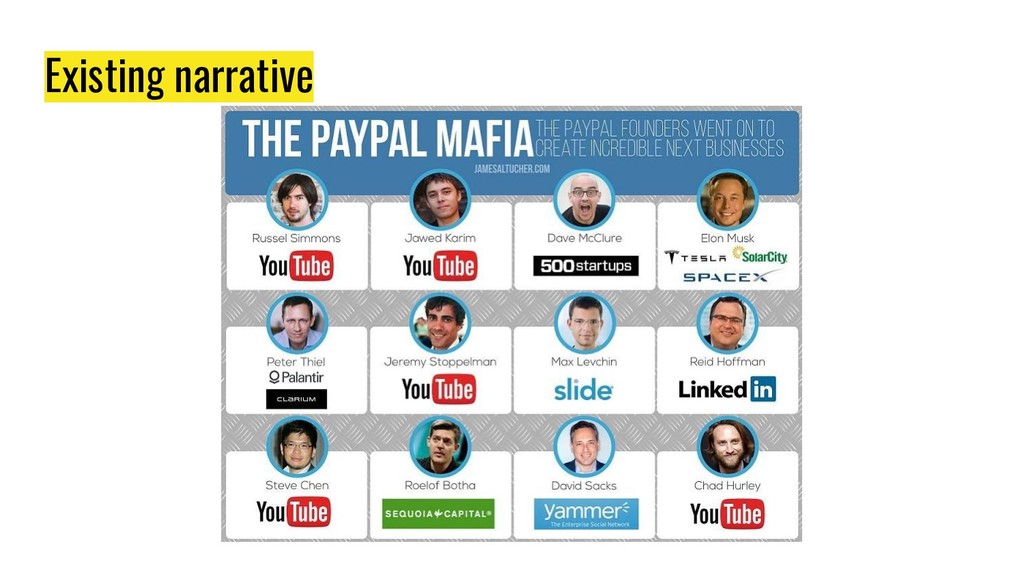
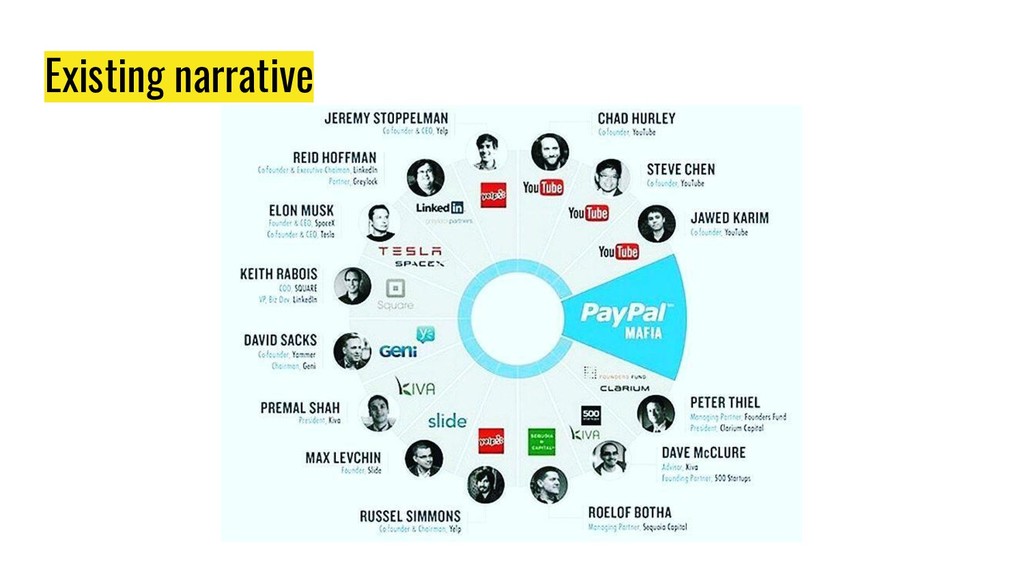
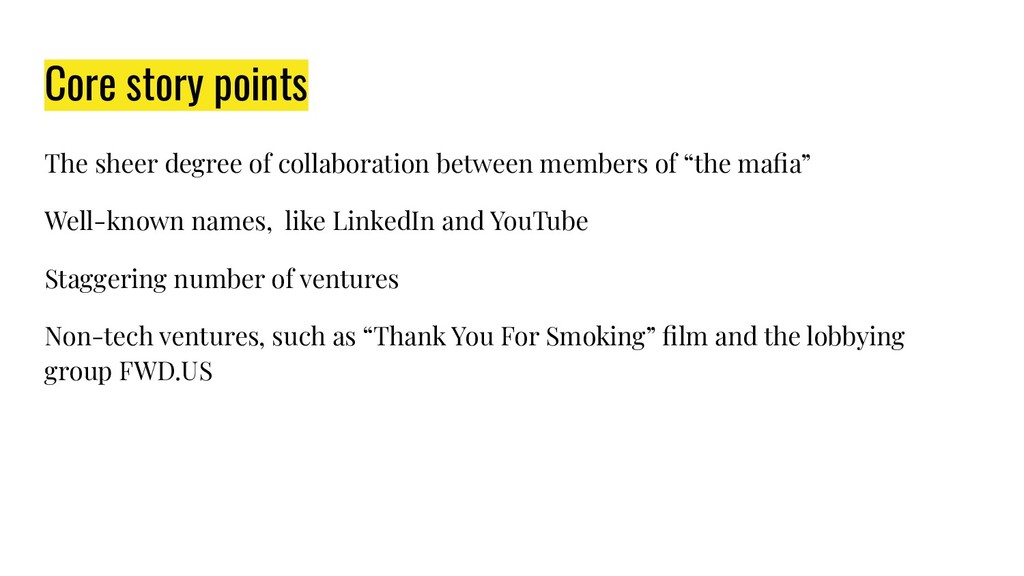
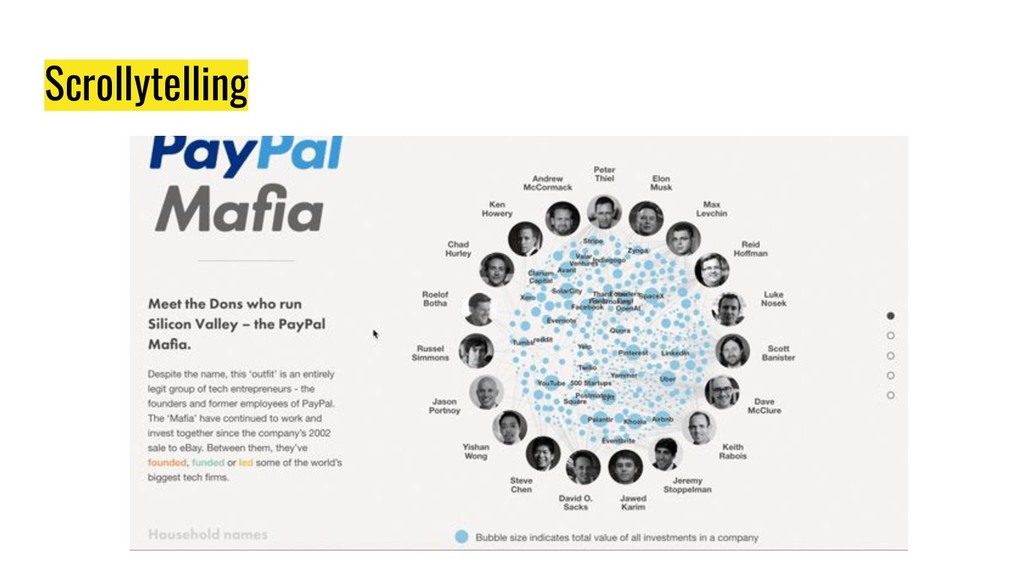
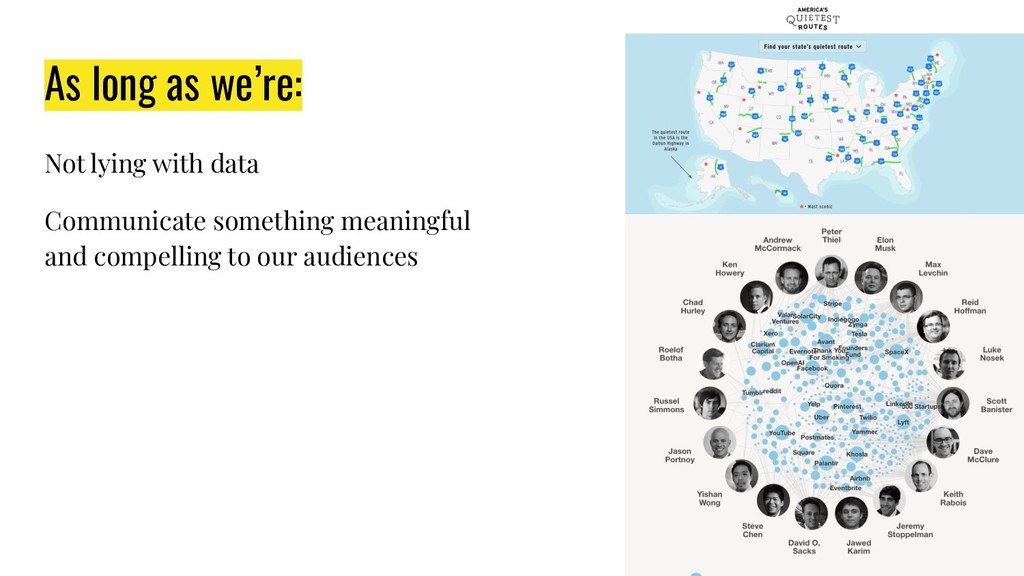
    of “the mafia” Well-known names, like LinkedIn and YouTube Staggering number of ventures Non-tech ventures, such as “Thank You For Smoking” film and the lobbying group FWD.US
  11. Results Features on VentureBeat, Gizmodo +70 sites Thousands of social

    shares and engagements Building authority as a tech-savvy brand
  12. Why did it work? Tapped into what the audience care

    about Used relevant data to add insight Visualise it in a way that reveals something new Make it work for the audience and platform
  13. Audience insight US Drivers (basically, the whole country) Enjoy driving,

    road trips, travel Don’t like getting stuck in traffic
  14. Highway Performance Monitoring System A database of all the roads

    in the US detailing, among other things • Location • Length • Volume of traffic
  15. What can this data tell us? The busiest roads in

    America but also… The quietest roads in America
  16. Fairly simple analysis Extract data layer from a shapefile Split

    state-by-state Estimate avg flow of vehicles Low # of vehicles = quietest roads
  17. PR: People like maps. Me: But this has no regional

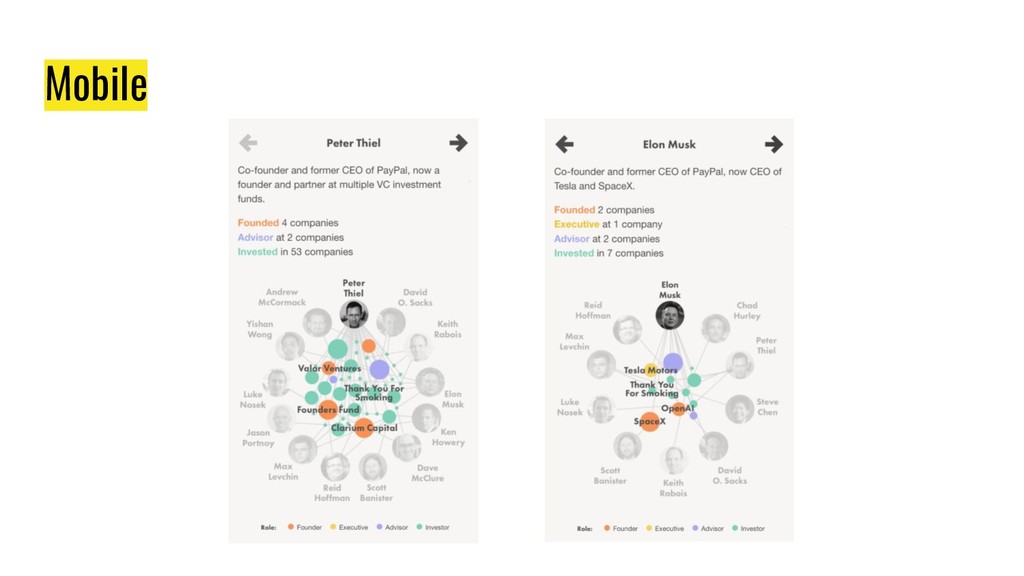
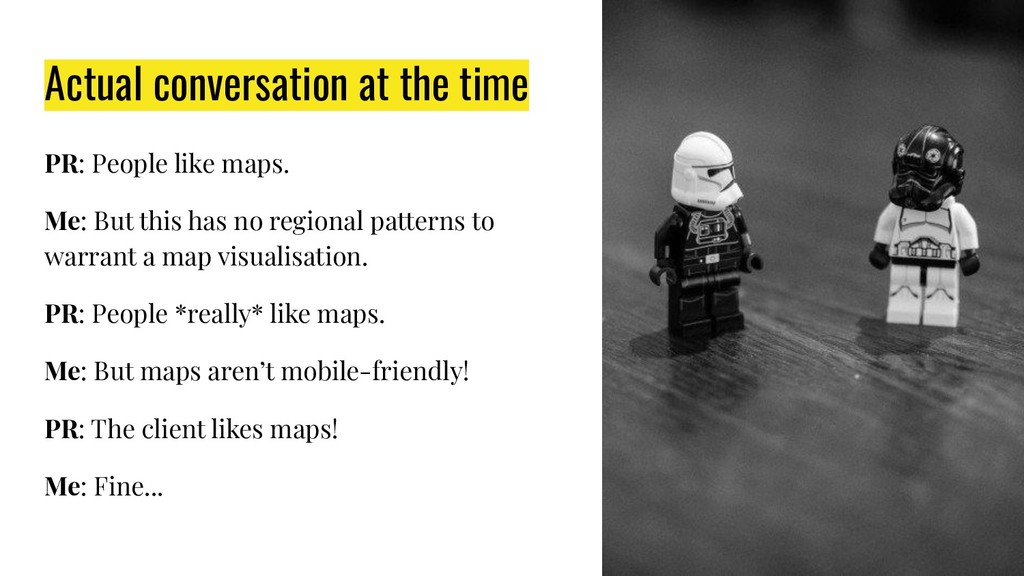
    patterns to warrant a map visualisation. PR: People *really* like maps. Me: But maps aren’t mobile-friendly! PR: The client likes maps! Me: Fine... Actual conversation at the time
  18. The Atlantic, Thrillist, Lonely Planet + 175 other news articles

    Thousands of social shares Brand awareness ++ Results
  19. Why did it work? Brought data to the conversation Revealed

    something previously unknown Chose the audience-appropriate visual format
  20. Do the research Research your audience Figure out what’s important

    to them Ask yourself, how can you add insight/value to that? What data can you use?
  21. Add insight with data Bringing *good* data to conversations that

    aren’t traditionally data-rich Adding new data to existing data-rich narratives
  22. Add insight with visualisation Using visualisation to make data more

    accessible Dataviz doesn’t have to be complex to be effective
  23. As long as we’re: Not lying with data Communicate something

    meaningful and compelling to our audiences
  24. Sources and references: Paypal Mafia • http://fortune.com/2007/11/13/paypal-mafia/ • https://www.crunchbase.com/ •

    https://www.nytimes.com/interactive/2014/06/20/sports/w orldcup/how-world-cup-players-are-connected.html • https://gephi.org/ Quietest Roads • https://www.fhwa.dot.gov/policyinformation/statistics.cfm • https://www.thrillist.com/travel/nation/most-fun-stretche s-of-road-in-america • https://www.outsideonline.com/1926186/americas-best-car- touring-roads • https://www.r-project.org/ Sources and image credits Image attribution (where required): • https://xkcd.com/1732/ • marcinignac on Visualhunt.com / CC BY-NC-ND • https://commons.wikimedia.org/wiki/File:Elon_Musk_Roy al_Society.jpg • https://jamesaltucher.com/wp-content/uploads/2015/09/p aypal-mafia.jpg • https://www.instagram.com/p/BUkUZh7DxOl/ • https://www.informationisbeautifulawards.com/awards/20 16 • http://datadrivenjournalism.net/ • https://www.linsonbusinessconsulting.com/wp-content/u ploads/2017/09/Non-disclosure-Agreement-1024x675.jpg