Upgrade to Pro — share decks privately, control downloads, hide ads and more …

How to Freelance in Dataviz

DataViz CPH
September 29, 2021

How to Freelance in Dataviz

Some practical tips on getting started, getting work, and making a living as a dataviz freelancer.

DataViz CPH

September 29, 2021
Tweet

More Decks by DataViz CPH

Other Decks in Business

Transcript

  1. Who we are: Volodymyr Freelance data journalist 󰑒 →󰏅 →󰎴

    Works with marketing teams & agencies Creates data-driven stories, makes dashboards, and writes analytical reports VK
  2. Who we are: Kirstin Music teacher → IT researcher →

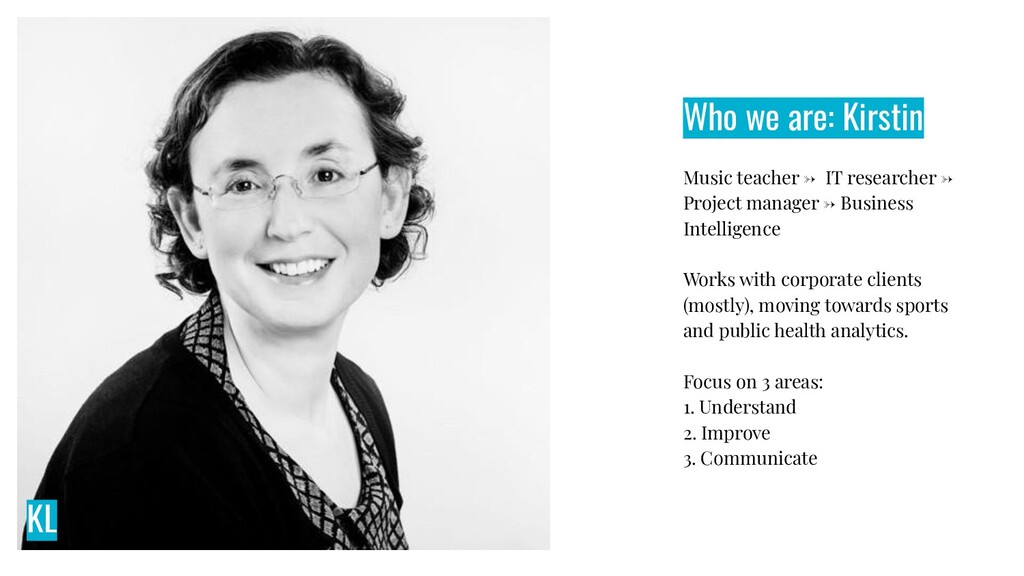
    Project manager → Business Intelligence Works with corporate clients (mostly), moving towards sports and public health analytics. Focus on 3 areas: 1. Understand 2. Improve 3. Communicate KL
  3. My two “jobs” - how did this happen? KICK.OUT Data

    Visualisation consultant analytics for elite trampoline gymnastics One-woman army (code, design, implement, sell, admin…. ) Jumping higher with analytics
  4. Get out there and be noticed Create content portfolio (+

    personal website) Stay visible Organise events Post on LinkedIn Join networks Talk about my work Look for opportunities (job posting)
  5. Creating my portfolio What are you showing? What do you

    want to achieve? Where will I upload my work? How will others access it? How do I get people to see my work?
  6. https://mockaroo.com/ Showing my work - previous “all my work is

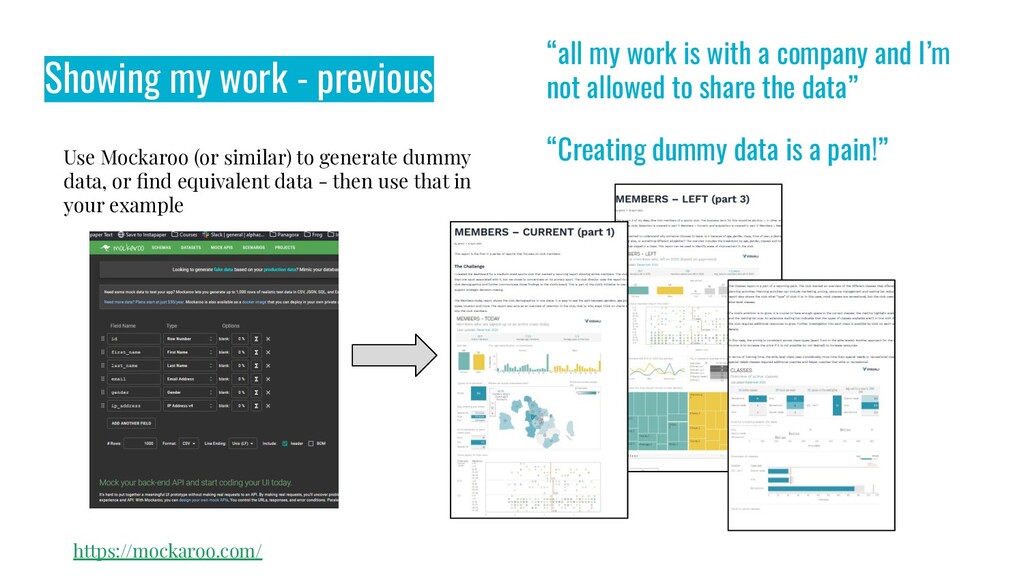
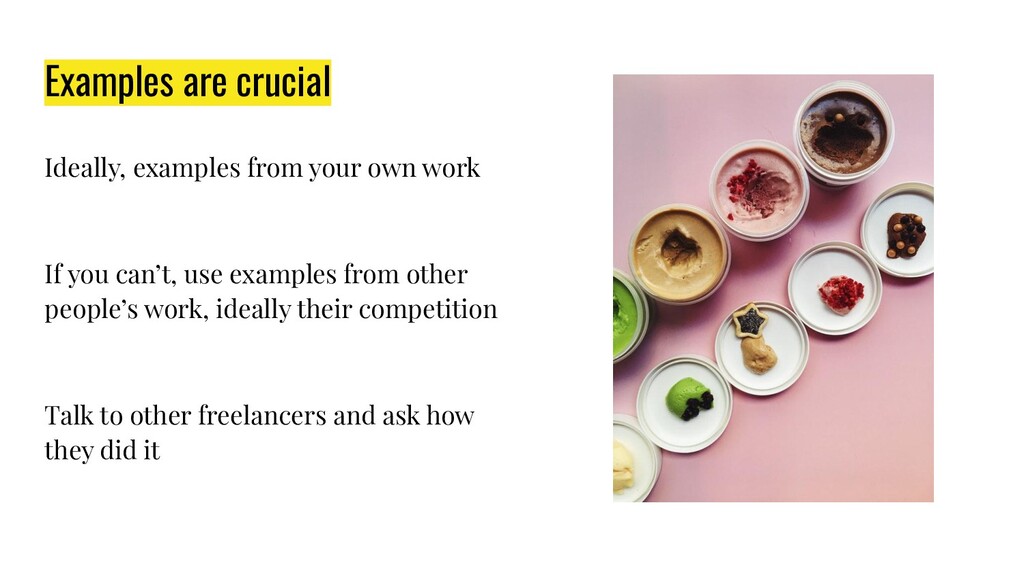
    with a company and I’m not allowed to share the data” “Creating dummy data is a pain!” Use Mockaroo (or similar) to generate dummy data, or find equivalent data - then use that in your example
  7. Reach out to people you worked with Can you get

    work from them? Can they introduce you to anyone? They already know you They know what you can do
  8. Made a website on Squarespace Showcased favourite most relevant projects

    I worked on Highlighted what I wanted people to notice Every time I would speak to someone, I’d refer them there Used it as my business card
  9. Websites are easy to make these days There are so

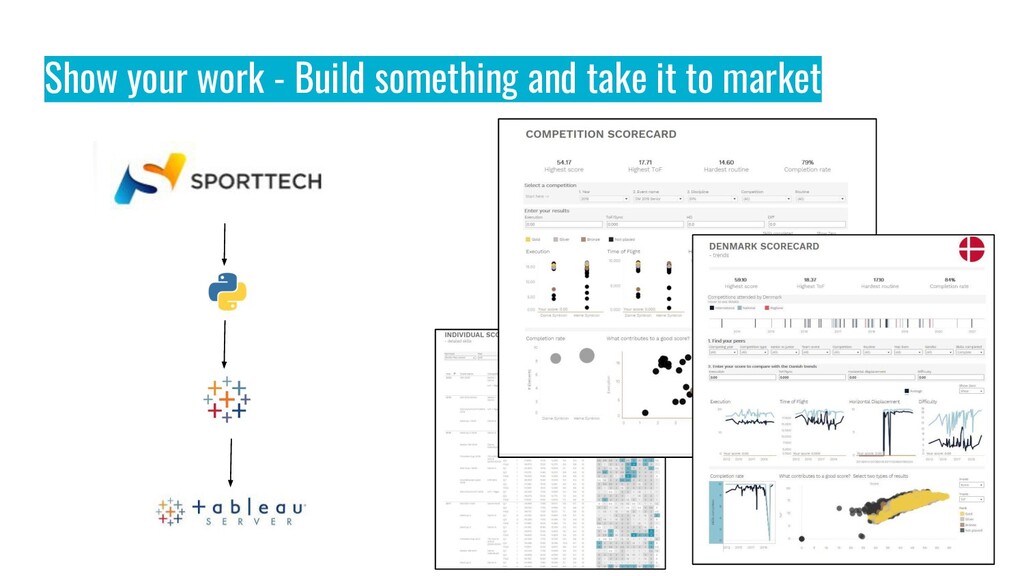
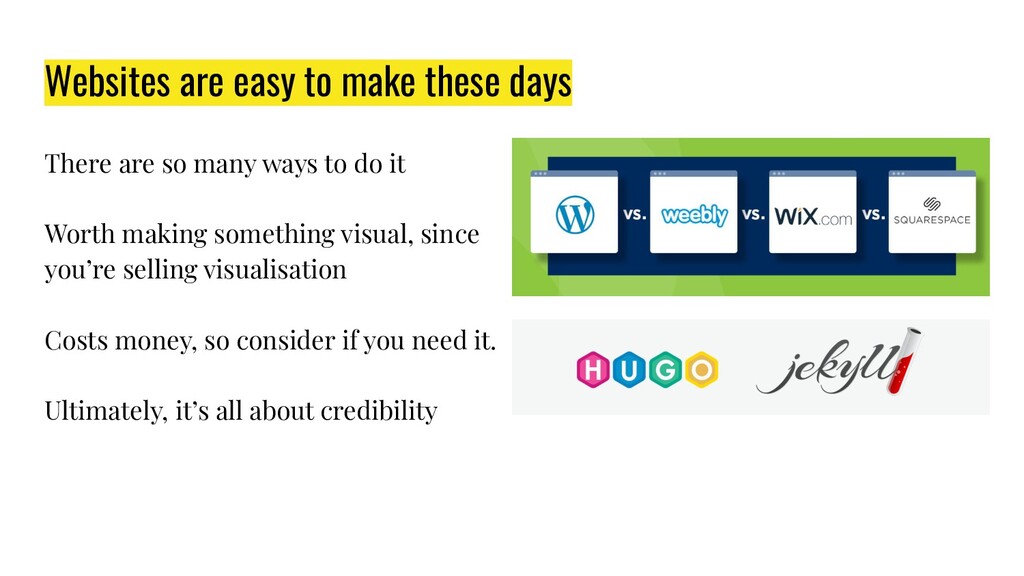
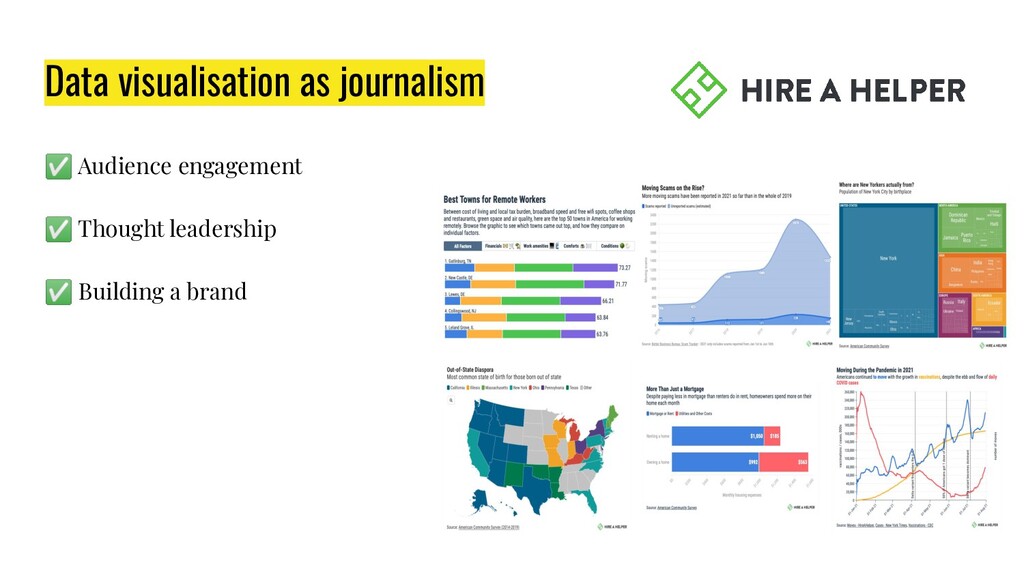
    many ways to do it Worth making something visual, since you’re selling visualisation Costs money, so consider if you need it. Ultimately, it’s all about credibility
  10. NOT A SALES PERSON (I hate selling too) Focus on

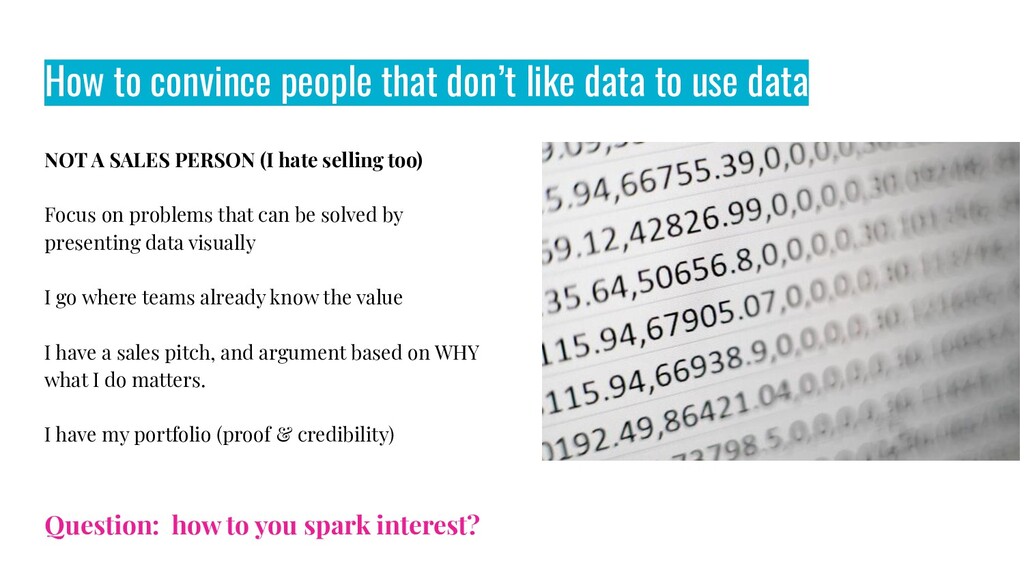
    problems that can be solved by presenting data visually I go where teams already know the value I have a sales pitch, and argument based on WHY what I do matters. I have my portfolio (proof & credibility) How to convince people that don’t like data to use data Question: how to you spark interest?
  11. But mostly, it’s about the outcomes What does data visualisation

    allow them to do that they couldn’t previously? What does it enable them to see? What business outcomes does it help drive?
  12. Examples are crucial Ideally, examples from your own work If

    you can’t, use examples from other people’s work, ideally their competition Talk to other freelancers and ask how they did it
  13. Outcomes ++ Traffic: Thousands more website visits each month ++

    Customers: YoY business performance up 50% (though not entirely thanks to my dataviz) ++ Happy people in the boardroom
  14. Outcomes ++ Access: One place for all marketing performance everyone

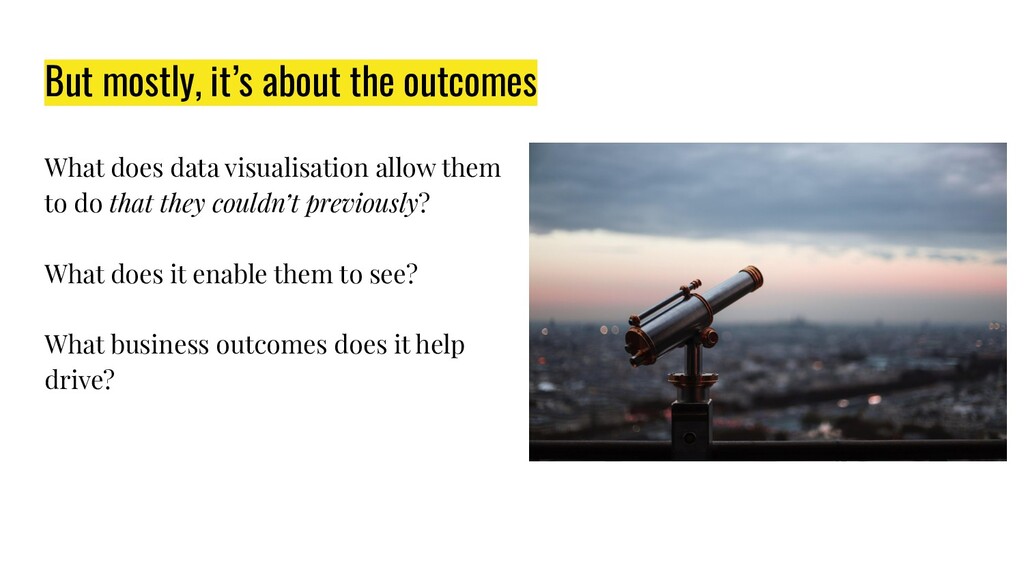
    can look at ++ Insight: Ability to quickly understand how things are going, dig into performance ++ Decisions: Easier to judge and prioritise future spending by channel and region
  15. Reduce the impact of the data Harder to see trends,

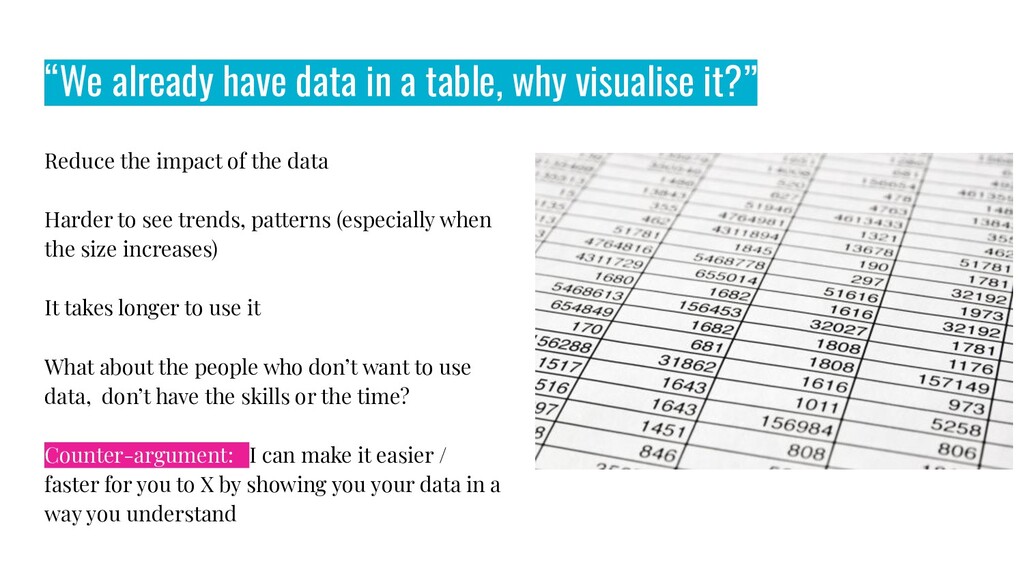
    patterns (especially when the size increases) It takes longer to use it What about the people who don’t want to use data, don’t have the skills or the time? Counter-argument: I can make it easier / faster for you to X by showing you your data in a way you understand “We already have data in a table, why visualise it?”
  16. “We tried using <insert tool> before, and it just didn’t

    work” Often, the problem has nothing to do with the tool or visual solution Try and find out why exactly it didn’t work. Explain how your approach is different.
  17. Some designers are good at dataviz Many, however, are not.

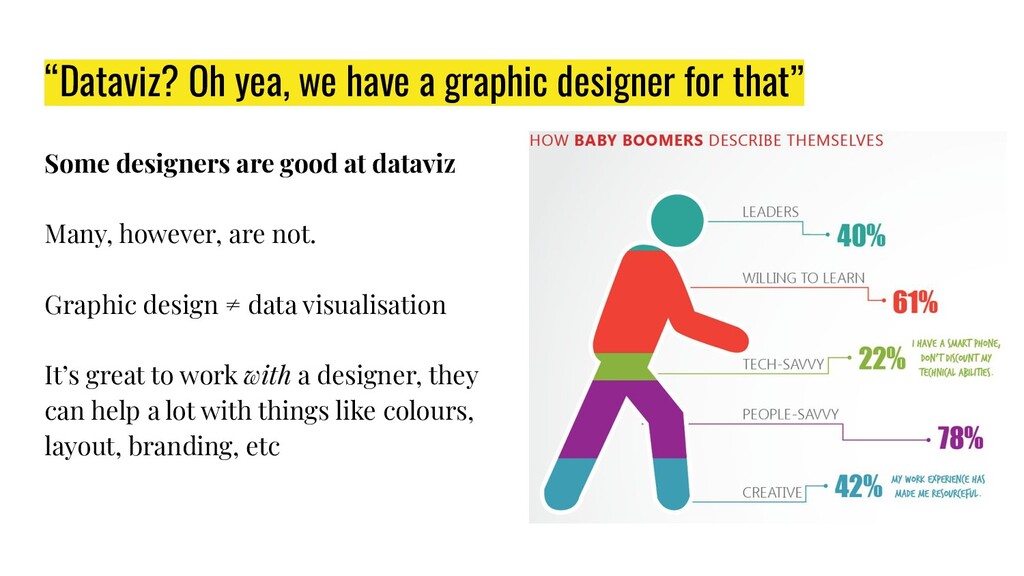
    Graphic design ≠ data visualisation It’s great to work with a designer, they can help a lot with things like colours, layout, branding, etc “Dataviz? Oh yea, we have a graphic designer for that”
  18. I have my minimum, I charge what is fair, and

    I have a plan B Moved to day-rates (plan to go to project rates) I ask about budgets in the interview I look at what others are doing (e.g. DVS survey data) I outsource what I can I focus on what I can do (not what I’m missing)
  19. Questions to think about Making or consulting on how to

    make? One-off projects or long-term ongoing support? Charge per hour/day or per project?
  20. How much do you want to earn? Need to earn

    vs Want to earn Think, how much do you want to earn a year / a month? Divide that by number of days you want to work = Your day rate
  21. If you ever want to do it There’s work across

    many industries It’s possible to earn a living It’s not easy, but it’s doable Gives you the freedom few jobs do