Upgrade to Pro — share decks privately, control downloads, hide ads and more …

DevOps and the Four Key Metrics

David Hodge
February 18, 2021

DevOps and the Four Key Metrics

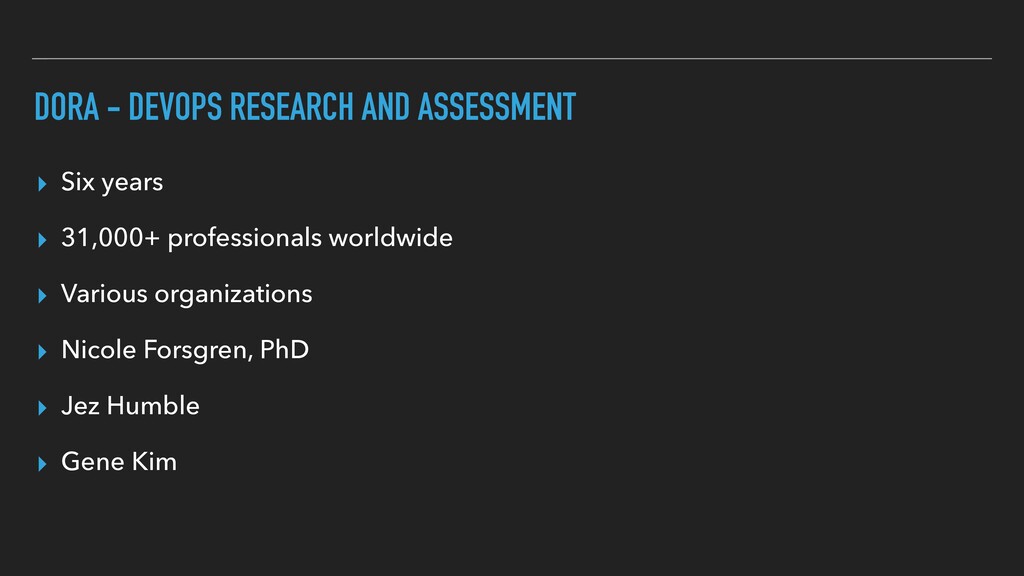
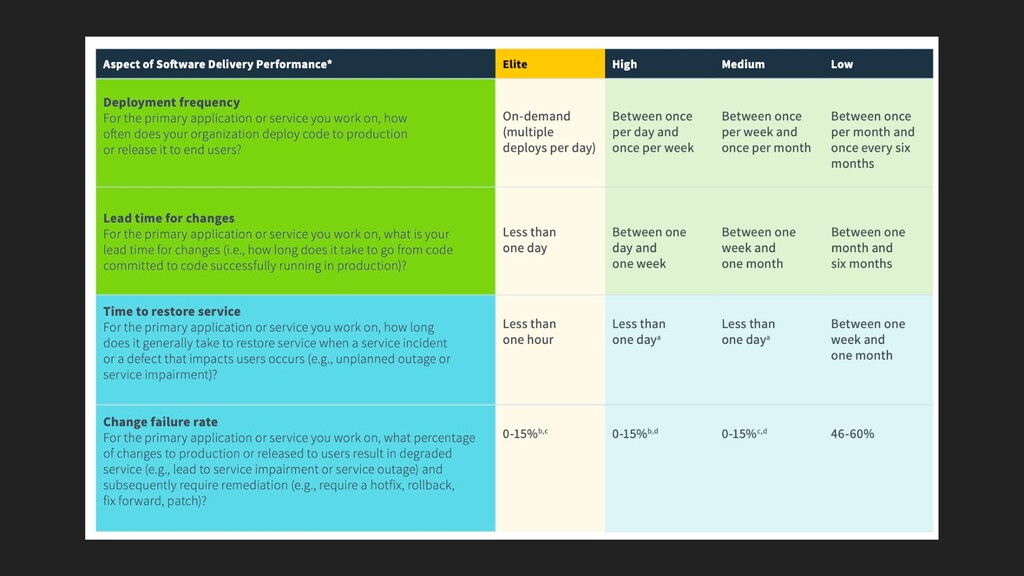
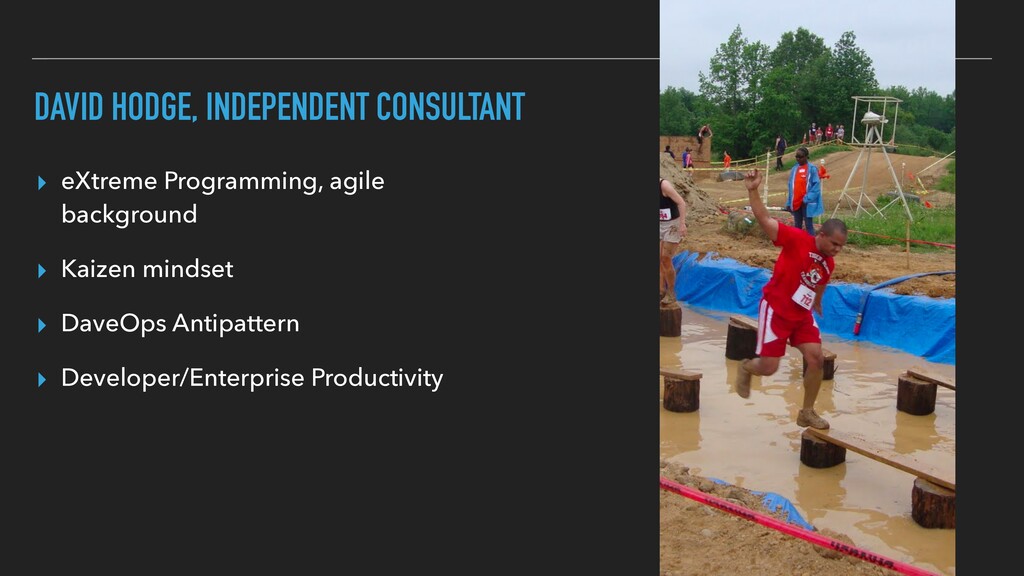
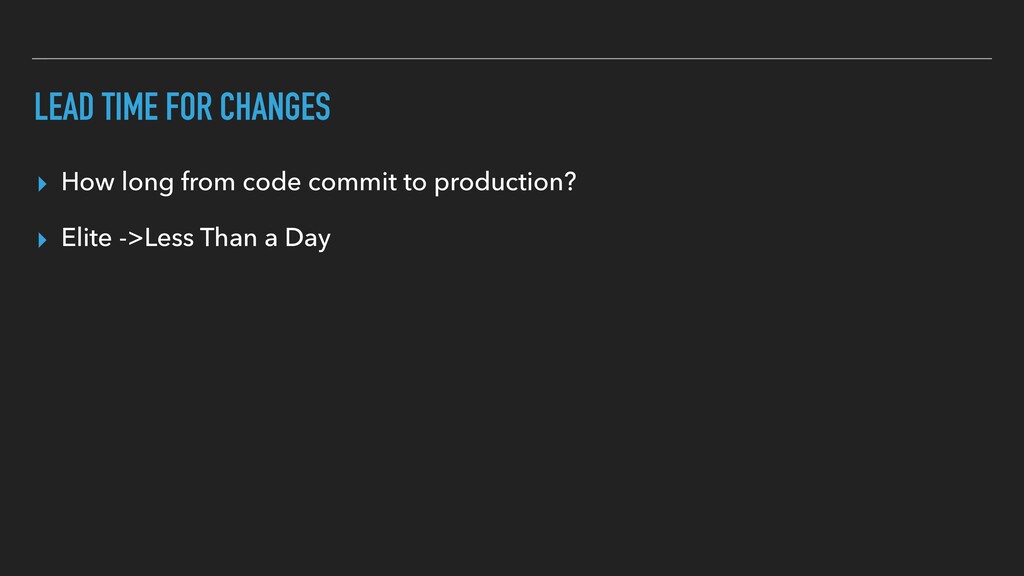
After years of research and data from over 30,000 professionals, the DevOps Research and Assessment (DORA) team identified four key metrics that separate elite teams. In this talk, David Hodge, Google Cloud Certified Architect, will discuss the four key metrics and one way to measure them. More importantly, we will discuss how organizations can adopt the mindset of measuring the metrics and potential pitfalls.

David Hodge

February 18, 2021
Tweet

More Decks by David Hodge

Other Decks in Technology

Transcript

  1. DORA - DEVOPS RESEARCH AND ASSESSMENT ▸ Six years ▸

    31,000+ professionals worldwide ▸ Various organizations ▸ Nicole Forsgren, PhD ▸ Jez Humble ▸ Gene Kim
  2. DAVID HODGE, INDEPENDENT CONSULTANT ▸ eXtreme Programming, agile background ▸

    Kaizen mindset ▸ DaveOps Antipattern ▸ Developer/Enterprise Productivity
  3. DEPLOYMENT FREQUENCY ▸ How often do you deploy to production?

    ▸ Elite -> On Demand Multiple Times per Day ▸ Basic Ingredients: Number of deployments ▸ How to Measure: Track Number of Deployments ▸ Start simple
  4. DEPLOYMENT FREQUENCY ▸ Basic Ingredients ▸ Code Repository ▸ Build

    Pipeline ▸ Monitoring ▸ How to measure ▸ Successful Deployments ▸ Deployment worked ▸ Post deployment checks ▸ Synthetic transactions
  5. DEPLOYMENT FREQUENCY ▸ Obstacles ▸ Permission, Process ▸ Overcome ▸

    Blue Green, Canary Deployments ▸ Bake in security in pipeline ▸ Track days waiting for permission
  6. LEAD TIME FOR CHANGES ▸ How long from code commit

    to production? ▸ Elite ->Less Than a Day
  7. LEAD TIME FOR CHANGES ▸ How to measure ▸ Build

    Pipeline, Release process, Repository commit ▸ Use Ticket management tool to track start and completion (JIRA, Trello) ▸ Quick Test - Make a comment in the code and put it in production
  8. TIME TO RESTORE SERVICE ▸ How Long Does It Take

    to resolve service incident or defect ▸ Elite ->Less Than an hour
  9. TIME TO RESTORE SERVICE ▸ Basic Ingredients ▸ Monitoring, Logging

    ▸ Incident Management process ▸ Health checks, Synthetic Transactions ▸ Pre Deployment Checks, Communication across teams ▸ Incident Time Start to End Time
  10. CHANGE FAILURE RATE ▸ Percentage of changes to production/released to

    users result in degraded service ▸ Elite -> 0-15% ▸ Failed Deployment, Hot fi x needed, Rollbacks, Features not correct
  11. CHANGE FAILURE RATE ▸ Basic Ingredients ▸ Number of deployments

    ▸ Number of Incidents per deployment ▸ How to Measure ▸ Honesty - log issues with deployments ▸ De fi ne failure per team
  12. ENTERPRISE ▸ Team Toplogies - Platform, Stream Aligned, Complicated Subsystem,

    Enabling Team ▸ Enabling Team can scale process vs Each Team Figuring it out ▸ Pilot ▸ Metrics are relevant for a particular team