Upgrade to Pro — share decks privately, control downloads, hide ads and more …

Getting Down To Earth: Geospatial Analysis With Rails

Getting Down To Earth: Geospatial Analysis With Rails

Presentation by Daniel Azuma from RailsConf 2012. Covers example implementations of geospatial projects in Ruby on Rails. For more info, see http://daniel-azuma.com/railsconf2012

Daniel Azuma

April 23, 2012
Tweet

More Decks by Daniel Azuma

Other Decks in Programming

Transcript

  1. Getting Down to Earth:
    Daniel Azuma
    RailsConf 2012
    Geospatial Analysis
    with Rails

    View Slide

  2. Getting Down to Earth:
    Daniel Azuma
    RailsConf 2012
    Geospatial Analysis
    with Rails

    View Slide

  3. View Slide

  4. Daniel Azuma
    Rails Developer
    since 2006
    Author of RGeo
    and related gems
    Chief Architect
    at Pirq

    View Slide

  5. We’re hiring!

    View Slide

  6. Beyond placing pushpins
    on a Google Map

    View Slide

  7. Let’s dive directly into code
    We can worry about the concepts another time

    View Slide

  8. Our agenda
    Setting up a geospatial Rails app
    Project 1: Visualizing geo-activity
    Project 2: Timezone lookup for a
    location
    Further material available online

    View Slide

  9. Setting up Rails

    View Slide

  10. Geospatial software stack
    libgeos — geometric algorithms
    libproj — coordinate projections
    PostGIS — spatial plugin for PostgreSQL
    RGeo — Ruby libraries

    View Slide

  11. …use Postgres — it’s awesome…

    View Slide

  12. View Slide

  13. …check out the README for more info…

    View Slide

  14. View Slide

  15. We installed some software
    We created a Rails app as usual
    But there were a few more configs
    …and that’s it!

    View Slide

  16. Project 1:
    Visualizing location activity

    View Slide

  17. …use the “point” data type…

    View Slide

  18. …configuring the migration…

    View Slide

  19. …SRID 3785 is the Google
    Maps Mercator projection…

    View Slide

  20. …make sure the index is marked “spatial”…

    View Slide

  21. …configuring the model…

    View Slide

  22. …assign an RGeo Factory to the model…

    View Slide

  23. Need Input!

    View Slide

  24. …some data to load…

    View Slide

  25. View Slide

  26. …remember to transform coordinate systems…

    View Slide

  27. Goal: visualize data on a map

    View Slide

  28. …query for points in a rectangle…

    View Slide

  29. …queries need to use the
    data’s coordinate system…

    View Slide

  30. …search for overlap with the box…

    View Slide

  31. Rectangles are not rectangular
    in geographic coordinates

    View Slide

  32. View Slide

  33. …use Squeel — it’s awesome…

    View Slide

  34. View Slide

  35. OUCH!

    View Slide

  36. View Slide

  37. …create a heatmap in javascript…

    View Slide

  38. View Slide

  39. Project 1 summary
    We created a model to hold location data
    We loaded a bunch of data into it
    We queried data within a map rectangle
    We visualized the data using a heatmap

    View Slide

  40. Project 2:
    Location time zone lookup

    View Slide

  41. World time zone regions

    View Slide

  42. …a timezone has_many polygon regions…

    View Slide

  43. View Slide

  44. …configure the migration…

    View Slide

  45. …configure the model with an RGeo Factory…

    View Slide

  46. http:/
    /efele.net/maps/tz/world/

    View Slide

  47. “I don’t even see the code anymore.
    All I see is point, polygon, circle…”

    View Slide

  48. …load a shapefile as a stream of records…

    View Slide

  49. …obtain the timezone object…

    View Slide

  50. …populate the polygon table…

    View Slide

  51. …query using the st_contains() SQL function…

    View Slide

  52. View Slide

  53. View Slide

  54. View Slide

  55. …our original query…

    View Slide

  56. …also query for “nearby” polygons…

    View Slide

  57. …check the distance…

    View Slide

  58. …distances also have a coordinate system…

    View Slide

  59. …take the closest polygon…

    View Slide

  60. Ain’t my fault
    you asked for
    st_distance…

    View Slide

  61. View Slide

  62. View Slide

  63. …PostGIS can optimize intersections…

    View Slide

  64. A “tall” table
    with many rows

    View Slide

  65. A database index
    eliminates lots of
    rows quickly

    View Slide

  66. Spatial databases are sometimes “fat”.

    View Slide

  67. Reduce width
    by increasing
    the row count

    View Slide

  68. Reduce width
    by increasing
    the row count

    View Slide

  69. 4-to-1 subdivision

    View Slide

  70. Looking for the sweet spot

    View Slide

  71. View Slide

  72. …let’s add polygon subdivision…

    View Slide

  73. View Slide

  74. View Slide

  75. …the core of the algorithm…

    View Slide

  76. …check the number of sides…

    View Slide

  77. …create a bounding box and subdivide…

    View Slide

  78. …use RGeo — it’s awesome…

    View Slide

  79. Whew! That was
    a lot of code!

    View Slide

  80. Project 2 summary
    We created timezone and polygon models
    We 
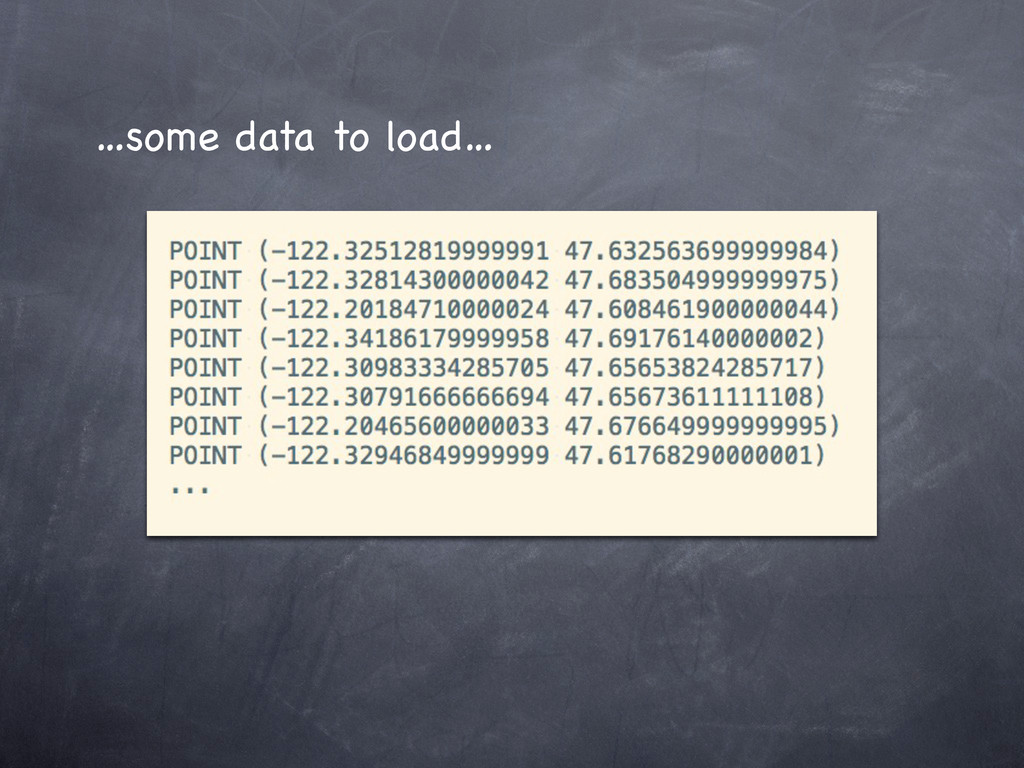
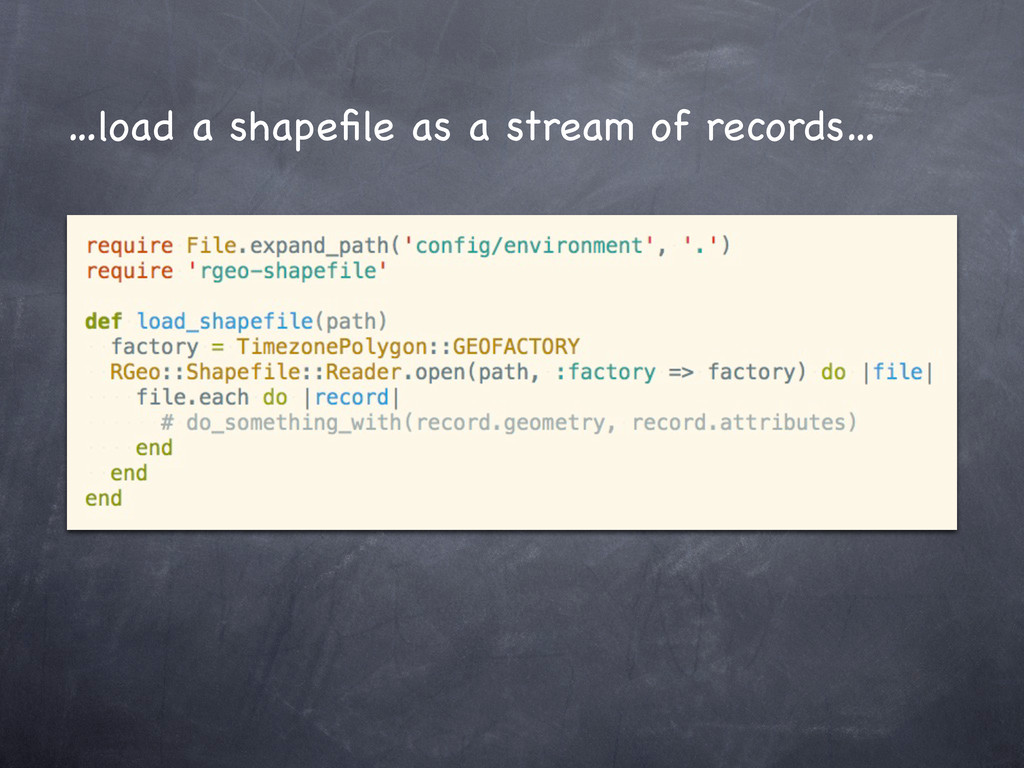
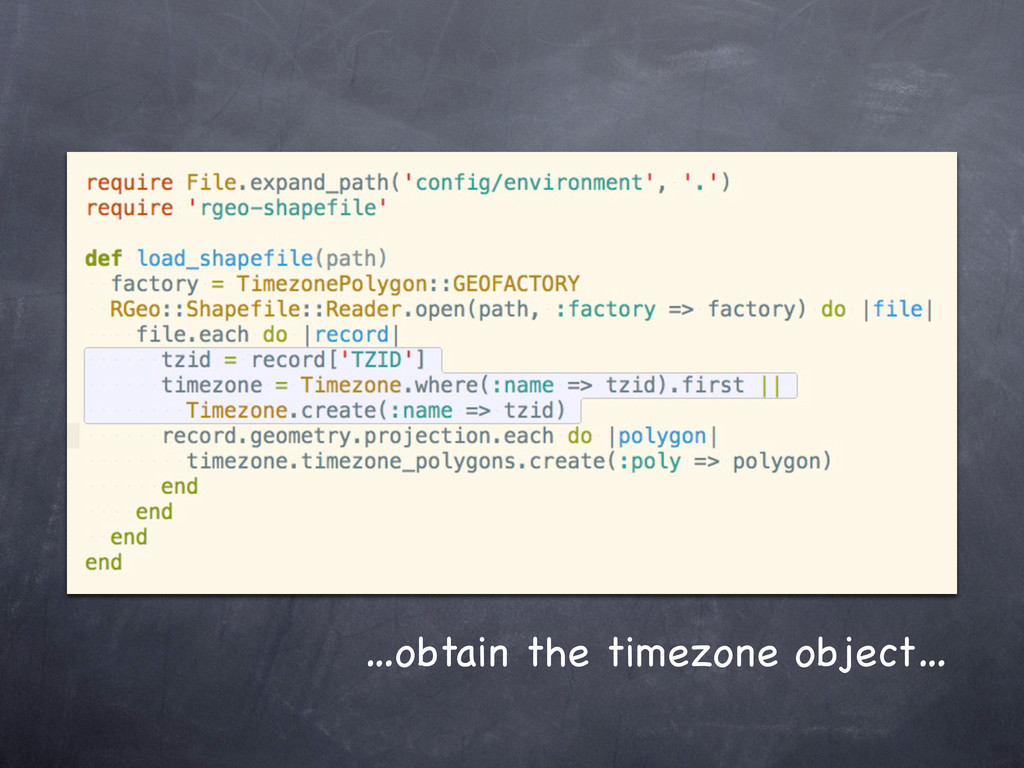
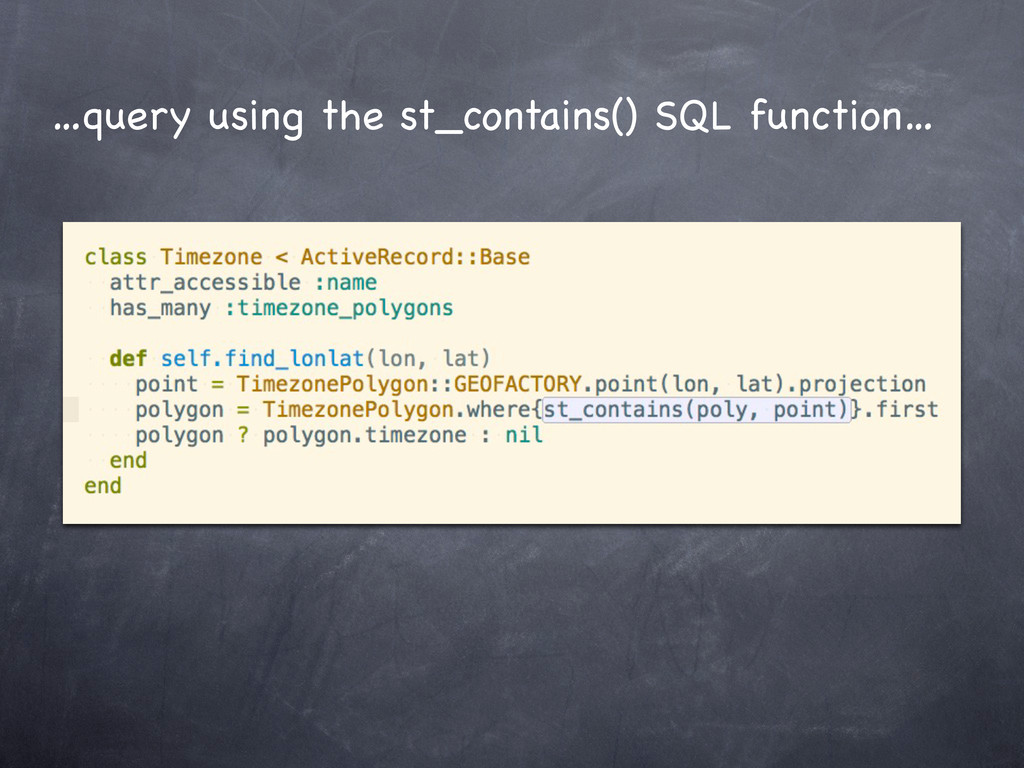
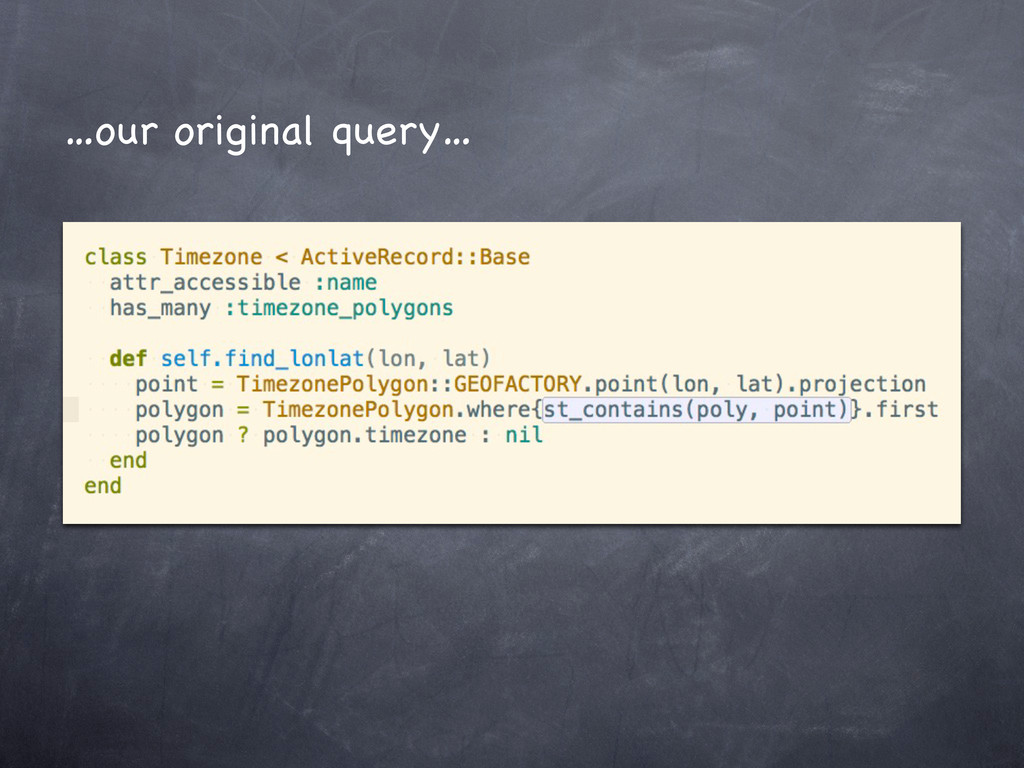
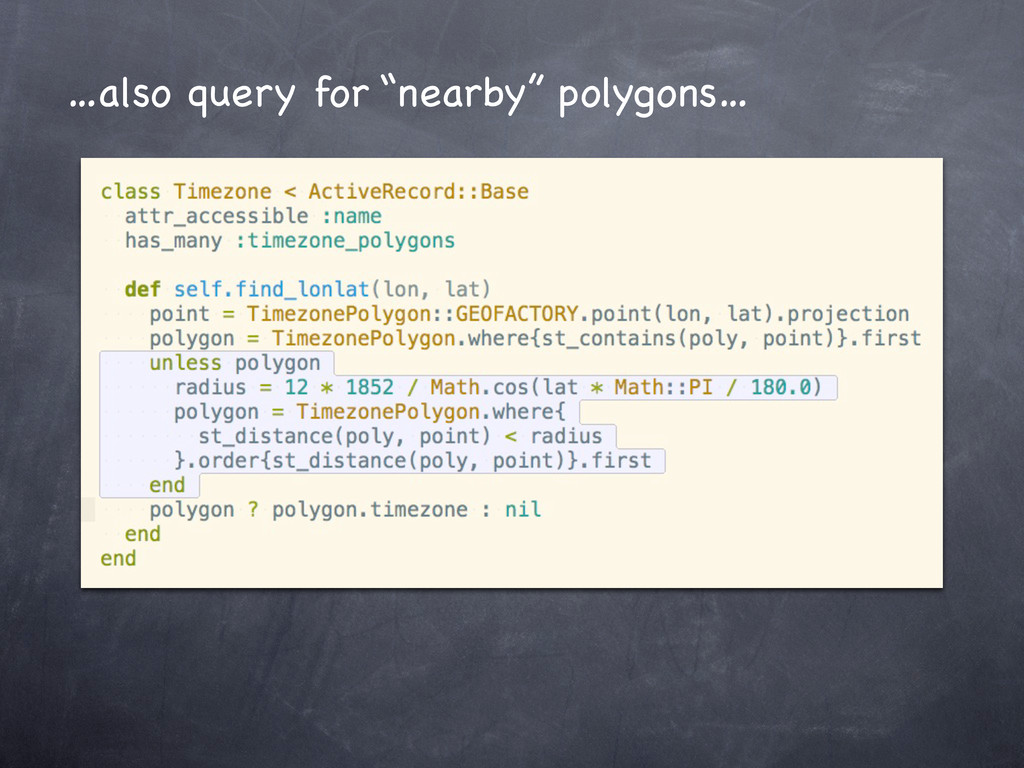
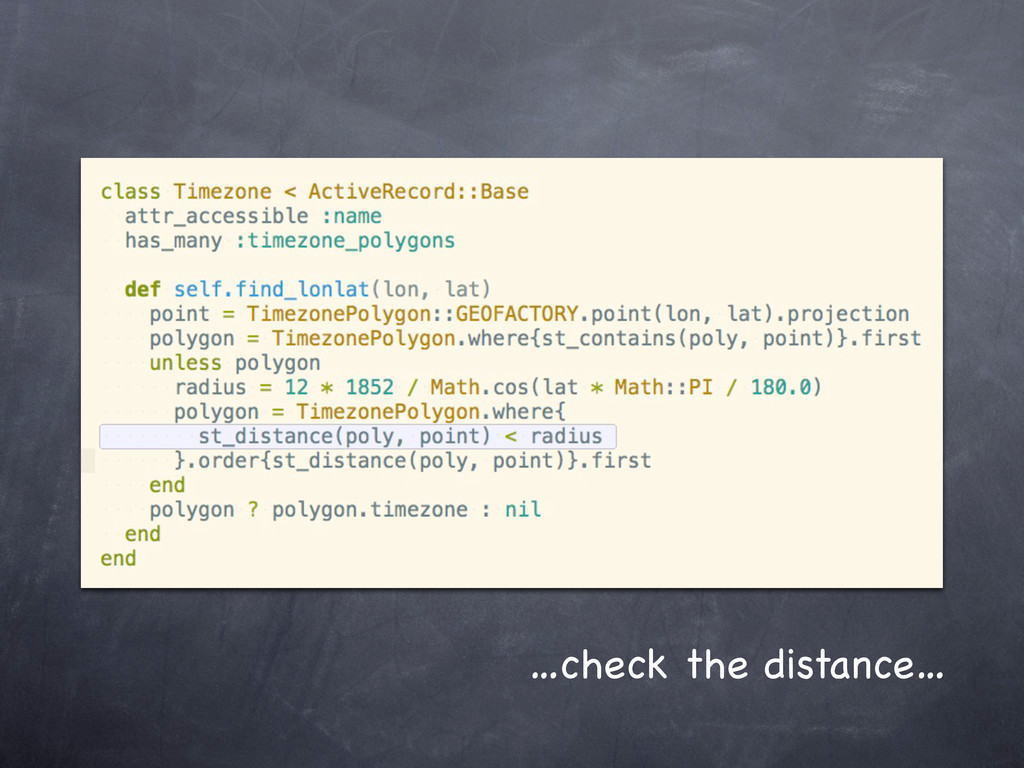
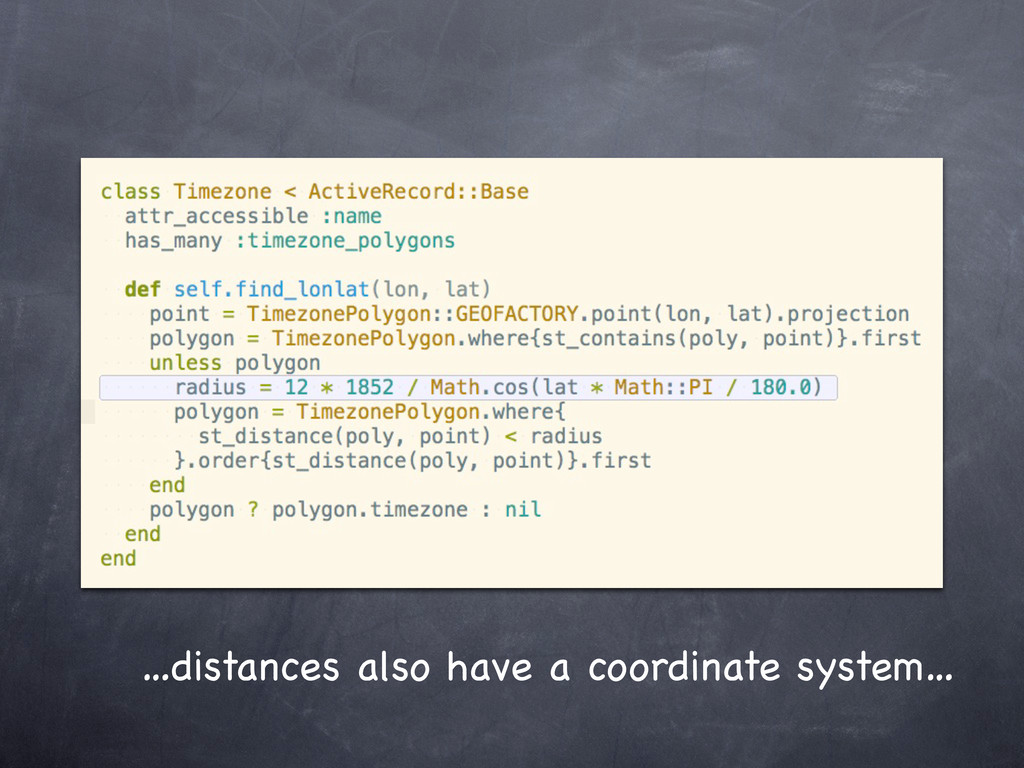
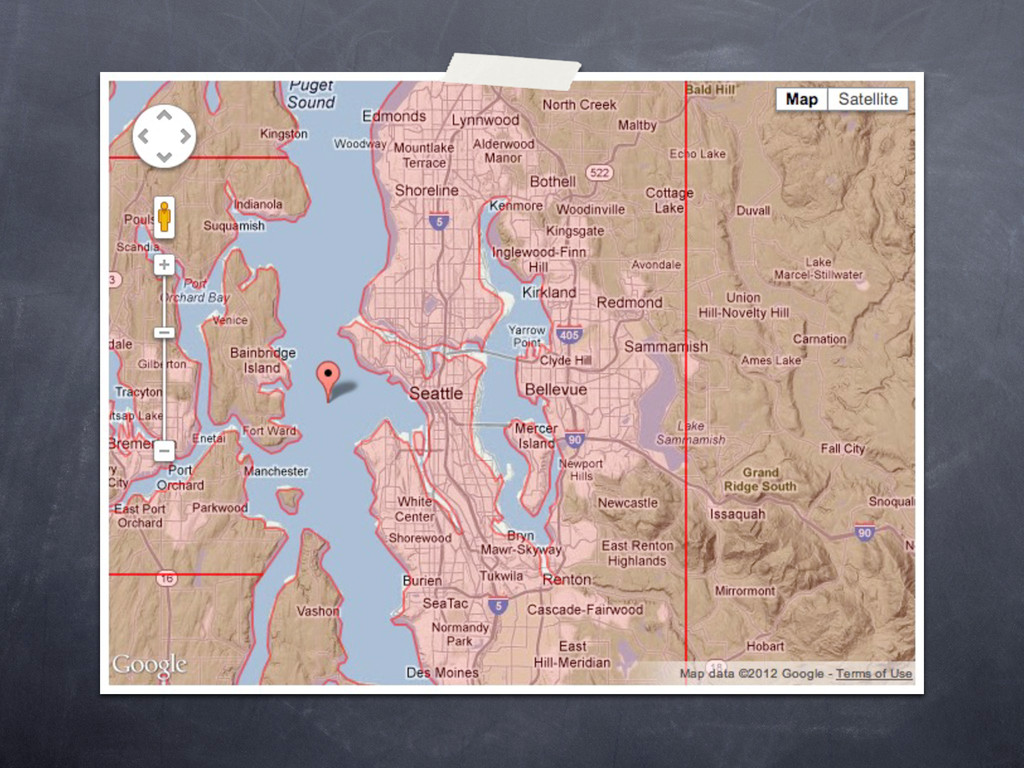
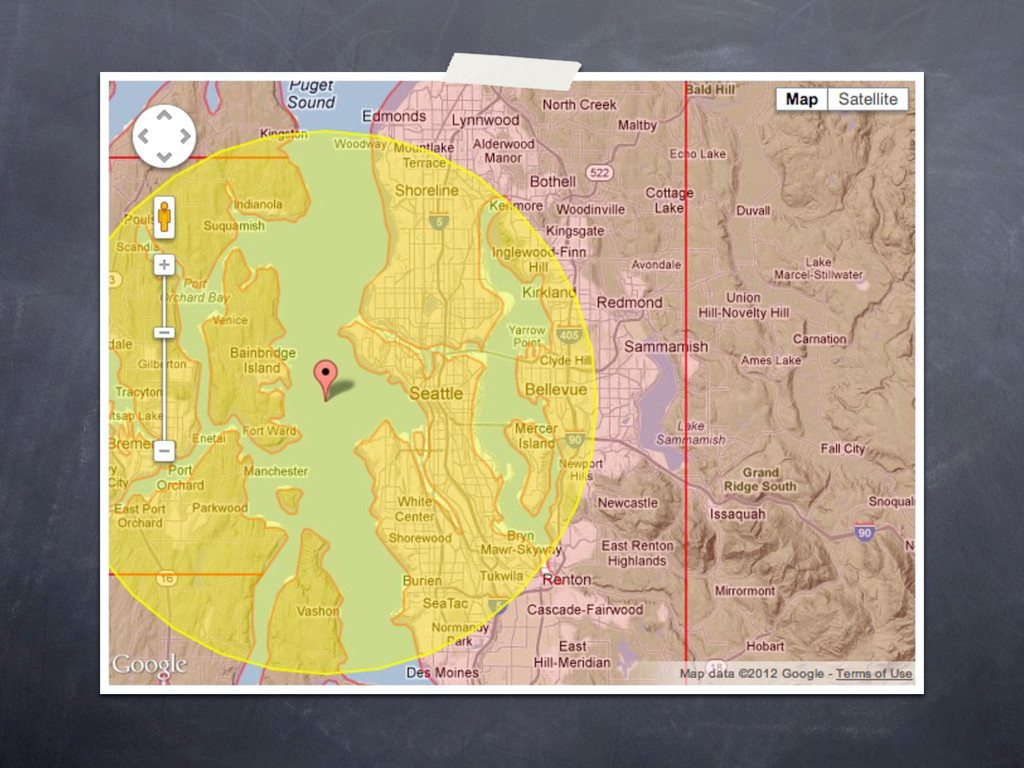
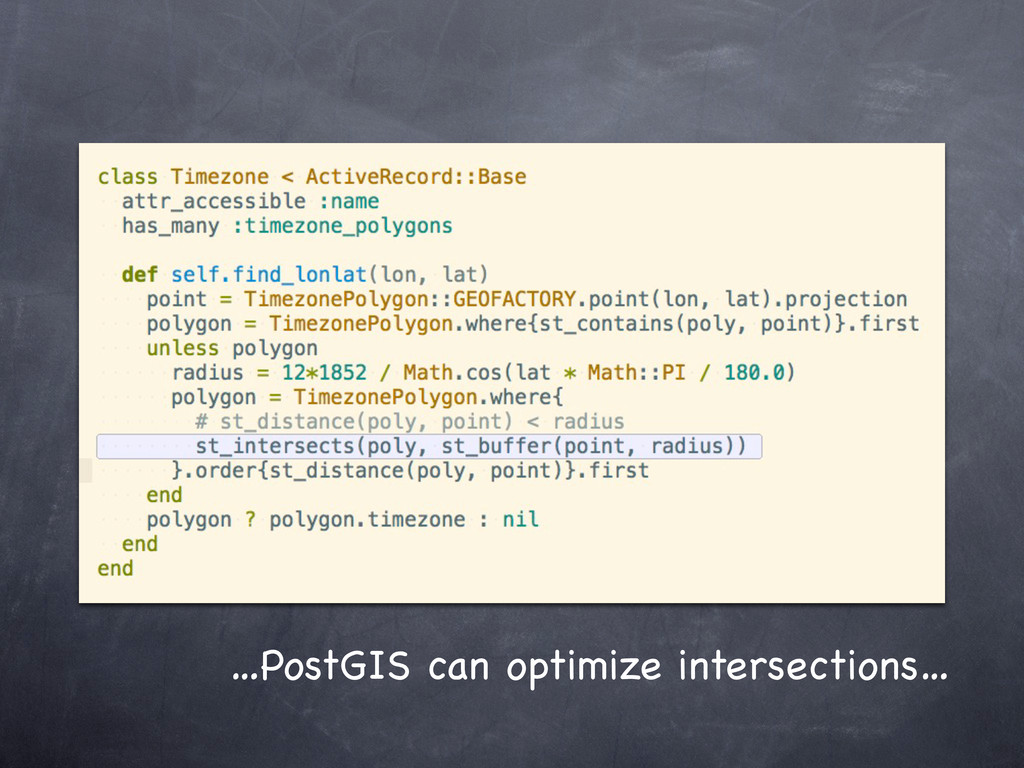
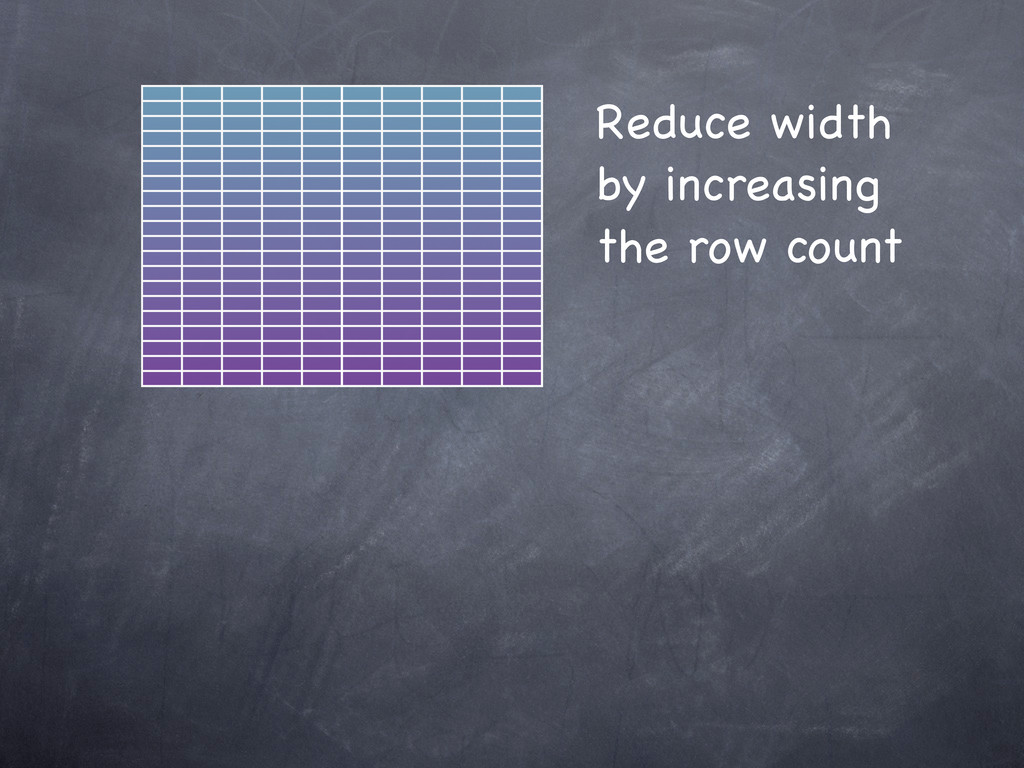
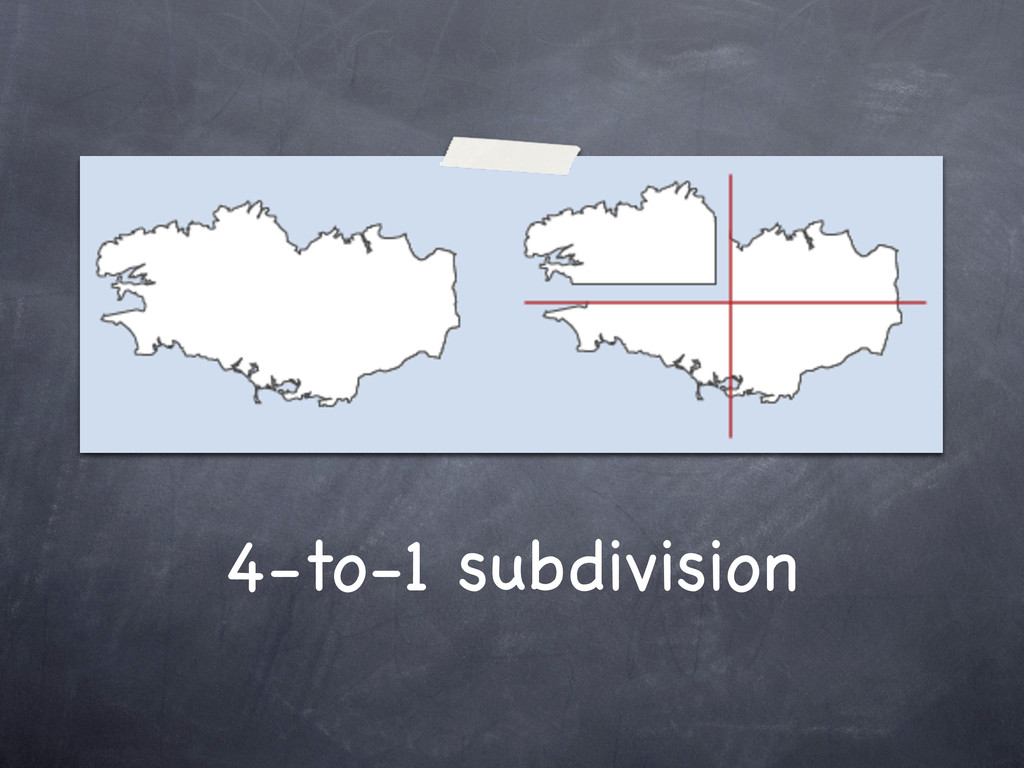
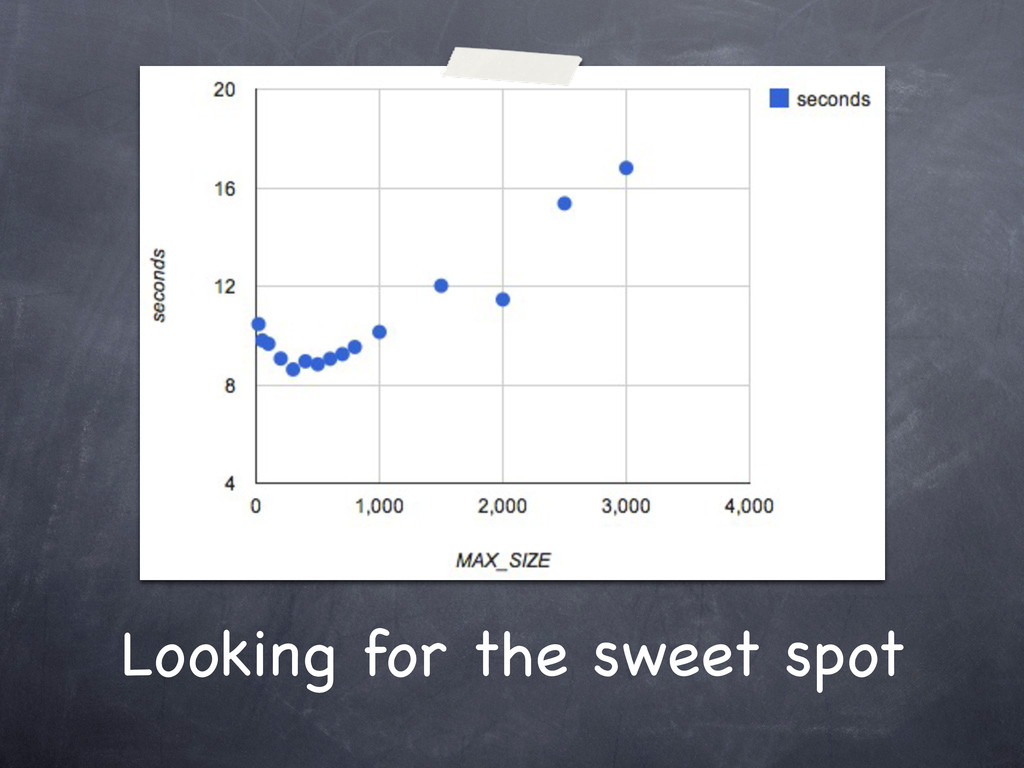
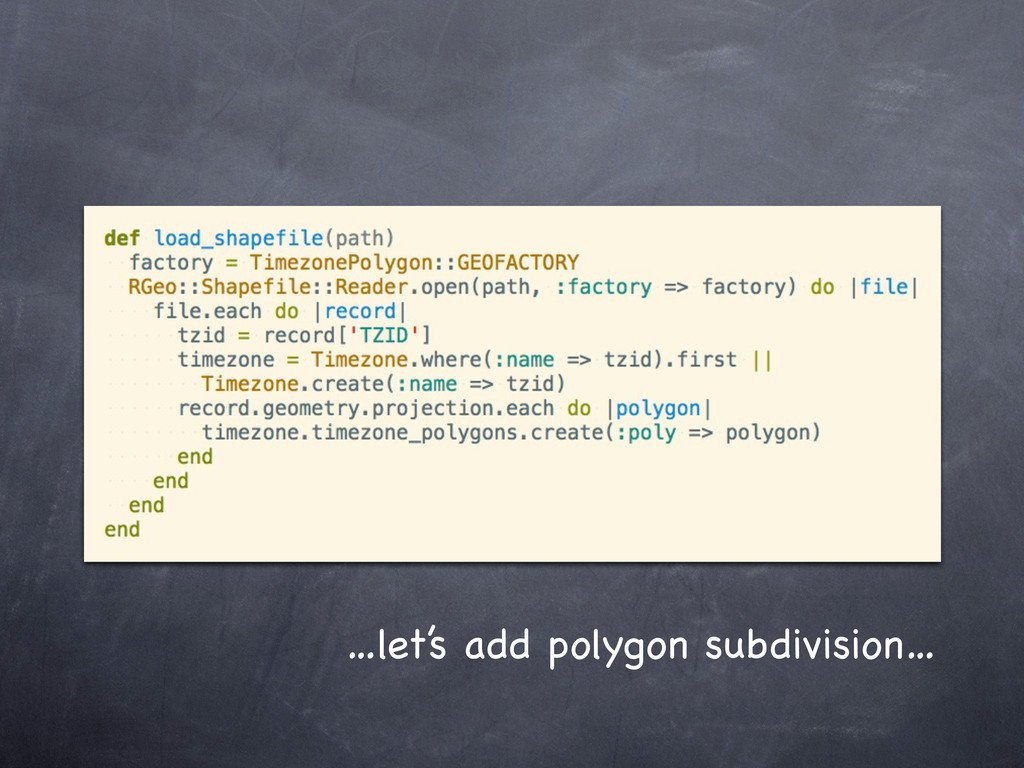
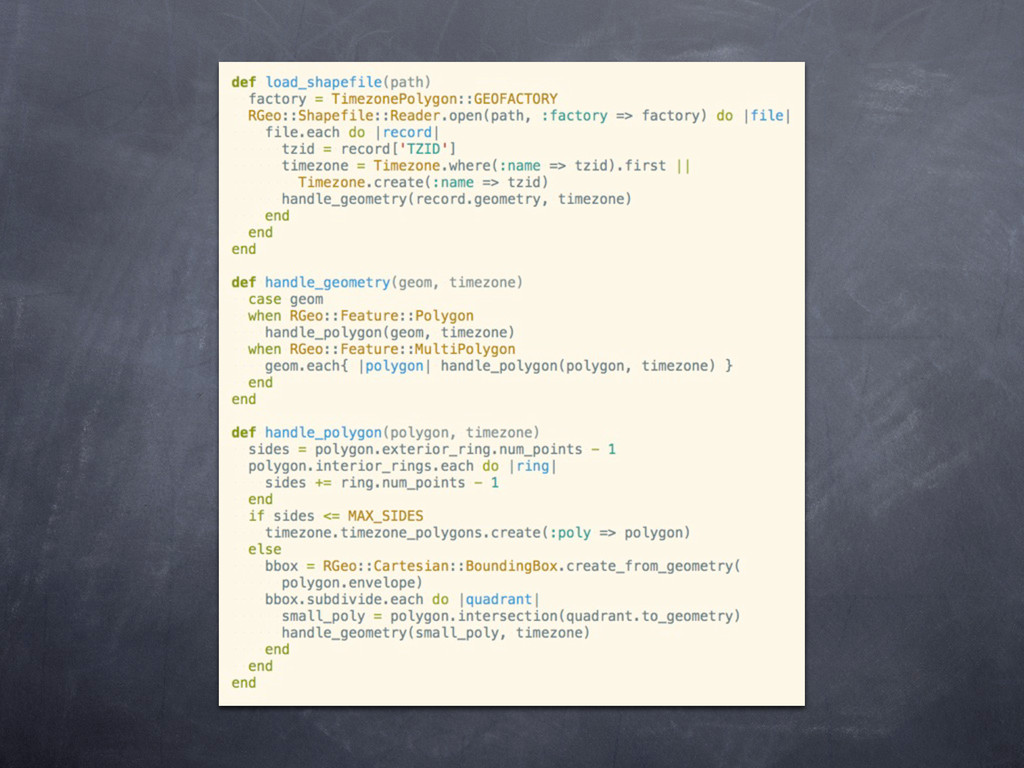
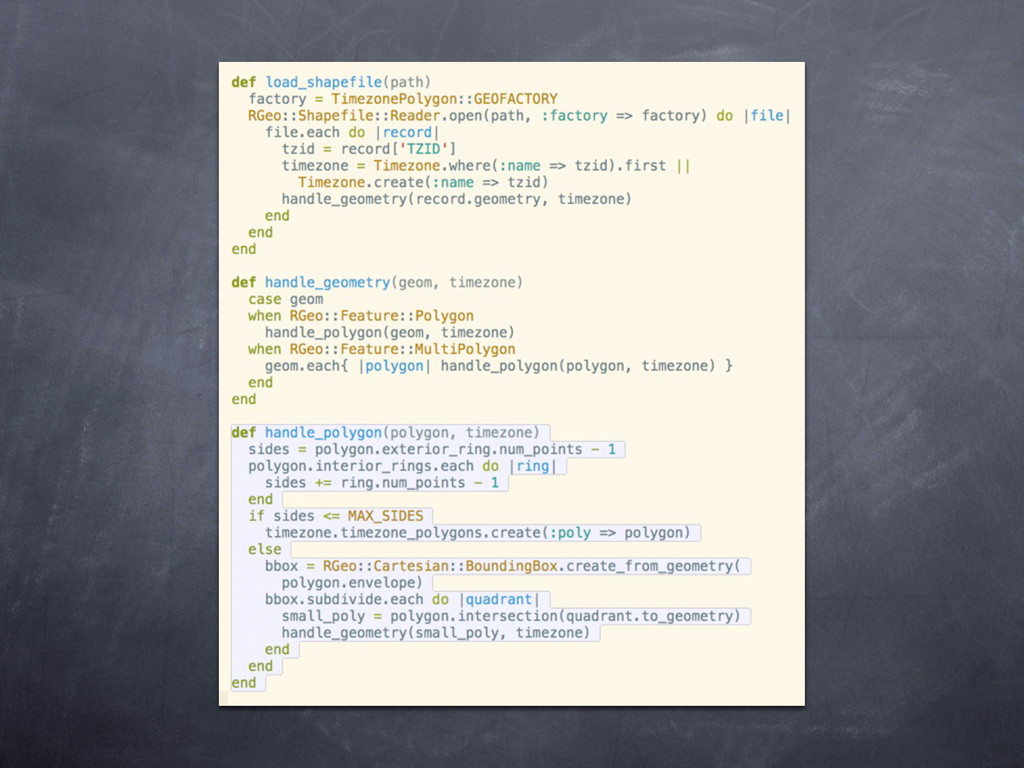
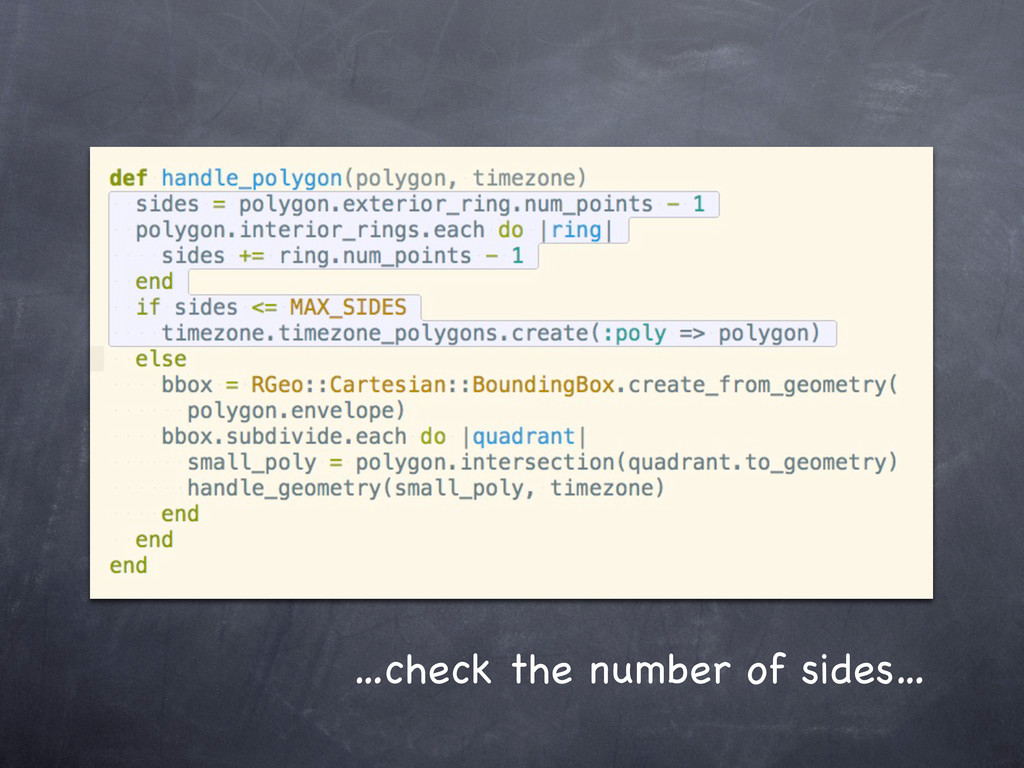
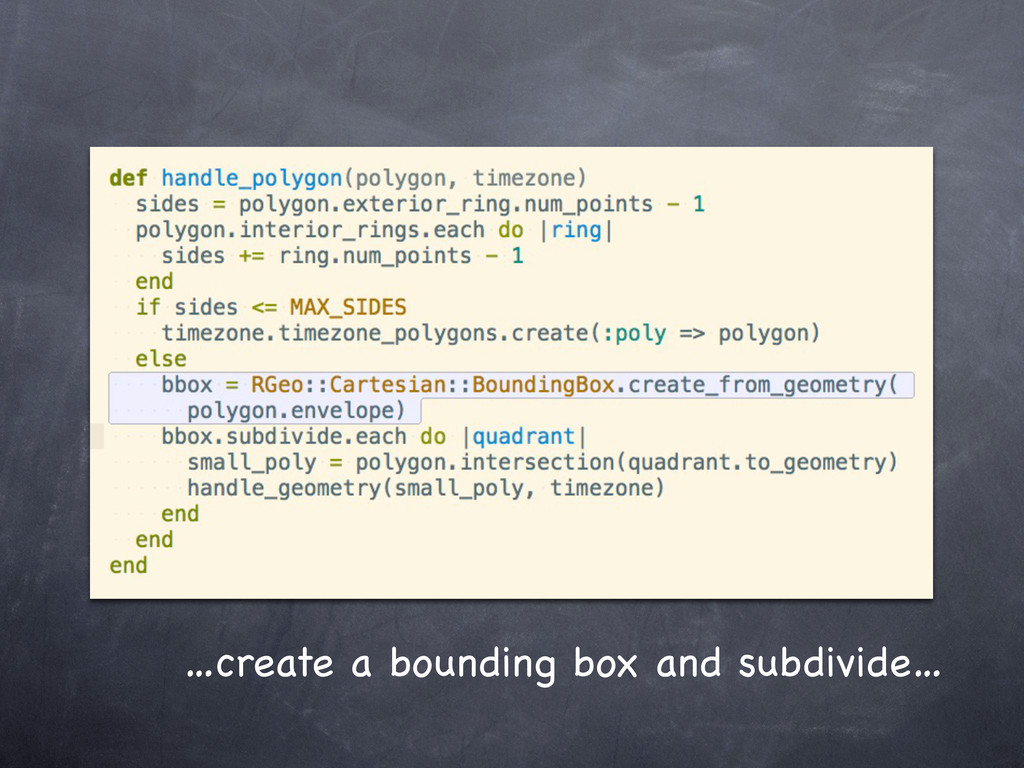
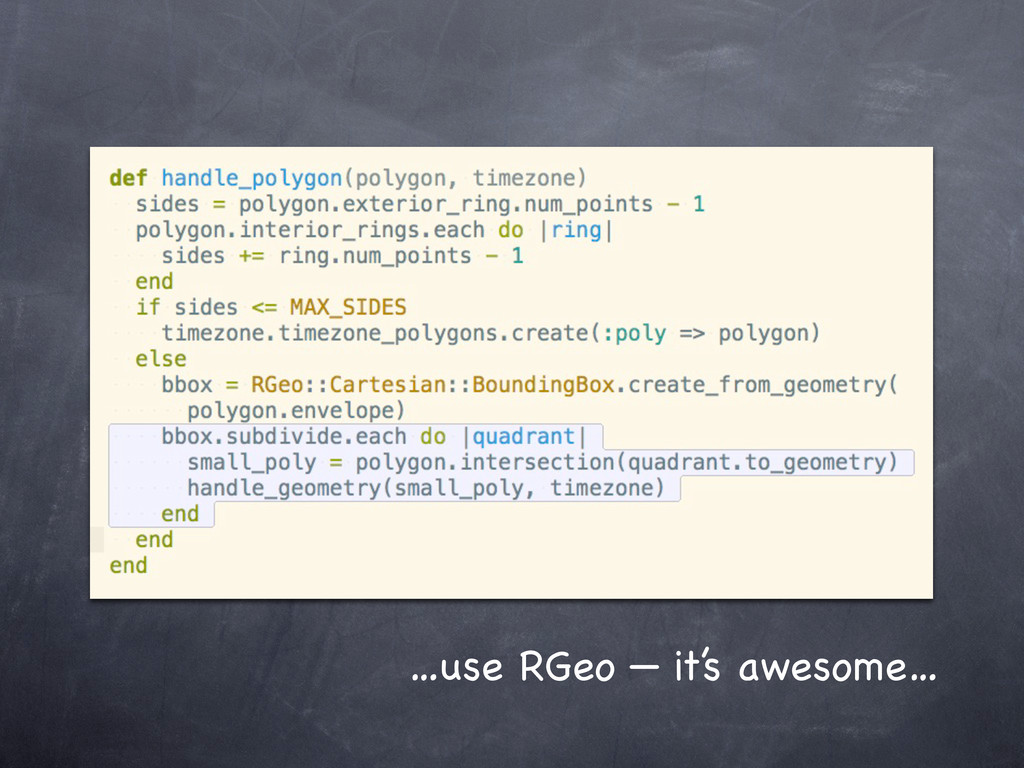
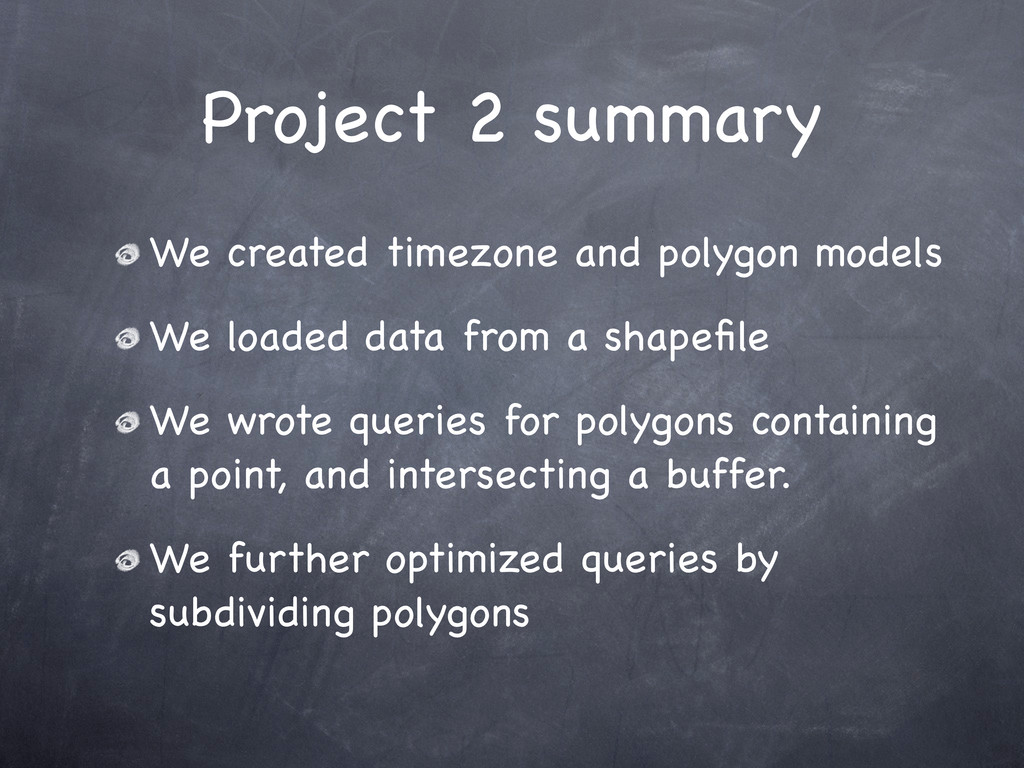
loaded data from a shapefile
    We wrote queries for polygons containing
    a point, and intersecting a buffer.
    We further optimized queries by
    subdividing polygons

    View Slide

  81. For further reading...
    http:/
    /daniel-azuma.com/railsconf2012
    …and look for the GeoRails Summit BOF

    View Slide