Upgrade to Pro
— share decks privately, control downloads, hide ads and more …
Speaker Deck
Features
Speaker Deck
PRO
Sign in
Sign up for free
Search
Search
MongoDB Diagnostics and Performance Tuning
Search
dcrosta
January 23, 2012
Technology
1.7k
3
Share
Embed
Copy iframe code
Copy JS code
Copy link
Start on current slide
MongoDB Diagnostics and Performance Tuning
From MongoDB LA, January 19, 2012.
dcrosta
January 23, 2012
More Decks by dcrosta
See All by dcrosta
Let the computer write the tests
dcrosta
0
100
Good Test, Bad Test
dcrosta
1
780
Exploring Python Code Objects (PyOhio)
dcrosta
4
360
Python Packaging for Humans
dcrosta
13
520
Exploring Python Code Objects
dcrosta
5
310
Keystone: Python Web Development, Simplified
dcrosta
4
360
MongoDB In the Cloud with Amazon EC2
dcrosta
6
470
Evolution without Migration
dcrosta
2
450
Other Decks in Technology
See All in Technology
DMM.com 購入改善推進チーム におけるCodeRabbitを用いた レビューフロー改善の一例
ysknsid25
2
630
Making sense of Google’s agentic dev tools
glaforge
1
200
Control Planeで育てるBtoB SaaSの認証基盤 - SRE NEXT 2026
pokohide
1
2.3k
事業価値を⽣み出すSREへ SREが担うべき意思決定の5層
kenta_hi
2
3.6k
Databricks 生成AIガバナンス実践ワークショップ / LLMOps-workshop
databricksjapan
0
100
人を動かすのは時間ではなく、納得感 〜新任EMが入社3ヶ月、組織を2回変えた話〜
kakehashi
PRO
3
220
SREとQA 二人三脚で進めるSLO運用/sre-qa-slo
sugitak
0
530
インフラと開発の垣根を超えていき!〜元AWSインフラエンジニアがAWS開発で奮闘している話〜
hatahata021
2
180
しぶいSRE: サーバから見えない障害にどう向き合うか。ラストワンマイルのデバッグ実践 / Shibui SRE
kanny
13
6.1k
あなたの『Site』はどこですか? — xREという考え方
miyamu
0
1.2k
ボーイスカウトルールでメモリやスキルを改善しよう
azukiazusa1
3
1k
「早く出す」より「事業に効く」 ── 顧客の業務サイクルから逆算するAI時代の二重ループ開発と「変化の設計者」 / devsumi2026
rakus_dev
1
240
Featured
See All Featured
RailsConf 2023
tenderlove
30
1.5k
Are puppies a ranking factor?
jonoalderson
1
3.7k
Principles of Awesome APIs and How to Build Them.
keavy
128
18k
The SEO identity crisis: Don't let AI make you average
varn
0
510
Documentation Writing (for coders)
carmenintech
77
5.4k
Discover your Explorer Soul
emna__ayadi
2
1.2k
30 Presentation Tips
portentint
PRO
1
350
Effective software design: The role of men in debugging patriarchy in IT @ Voxxed Days AMS
baasie
0
450
Design in an AI World
tapps
1
260
How to Grow Your eCommerce with AI & Automation
katarinadahlin
PRO
1
220
HDC tutorial
michielstock
2
740
Tips & Tricks on How to Get Your First Job In Tech
honzajavorek
1
560
Transcript
Diagnostics and Performance Tuning Dan Crosta, 10gen
[email protected]
@lazlofruvous
Agenda •Tools •Performance Indicators
Speed MongoDB is a high-performance database, but how do I
know that I’m getting the best performance
TOOLS
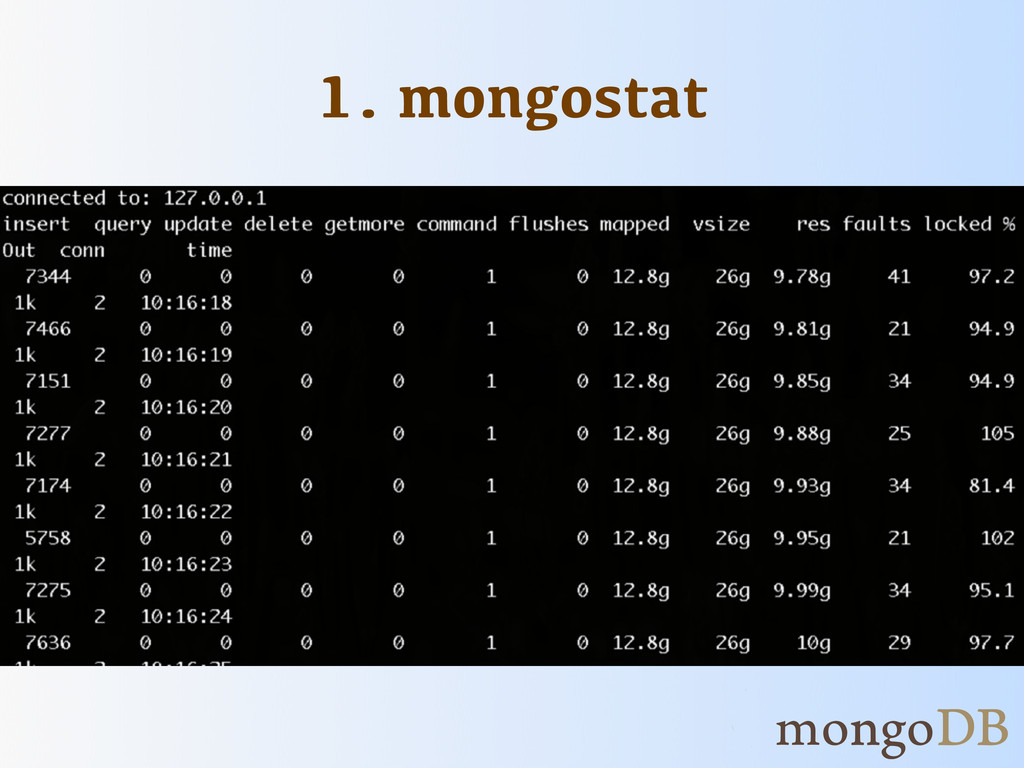
1. mongostat
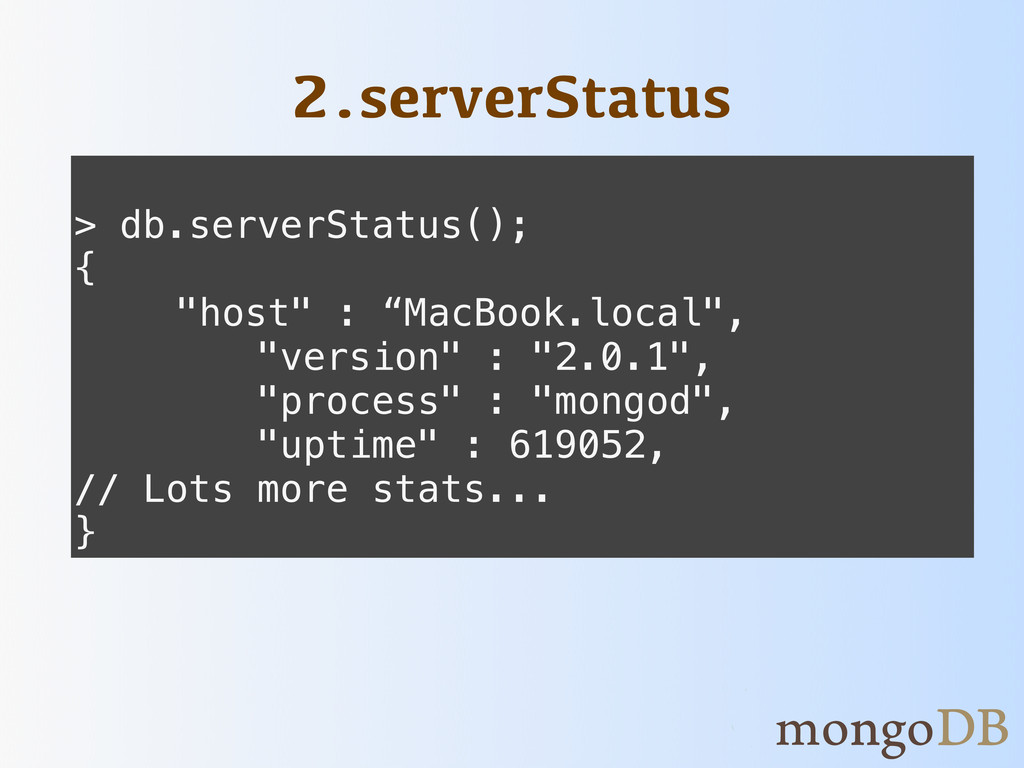
2.serverStatus > db.serverStatus(); { ! ! "host" : “MacBook.local", "version"
: "2.0.1", "process" : "mongod", "uptime" : 619052, // Lots more stats... }
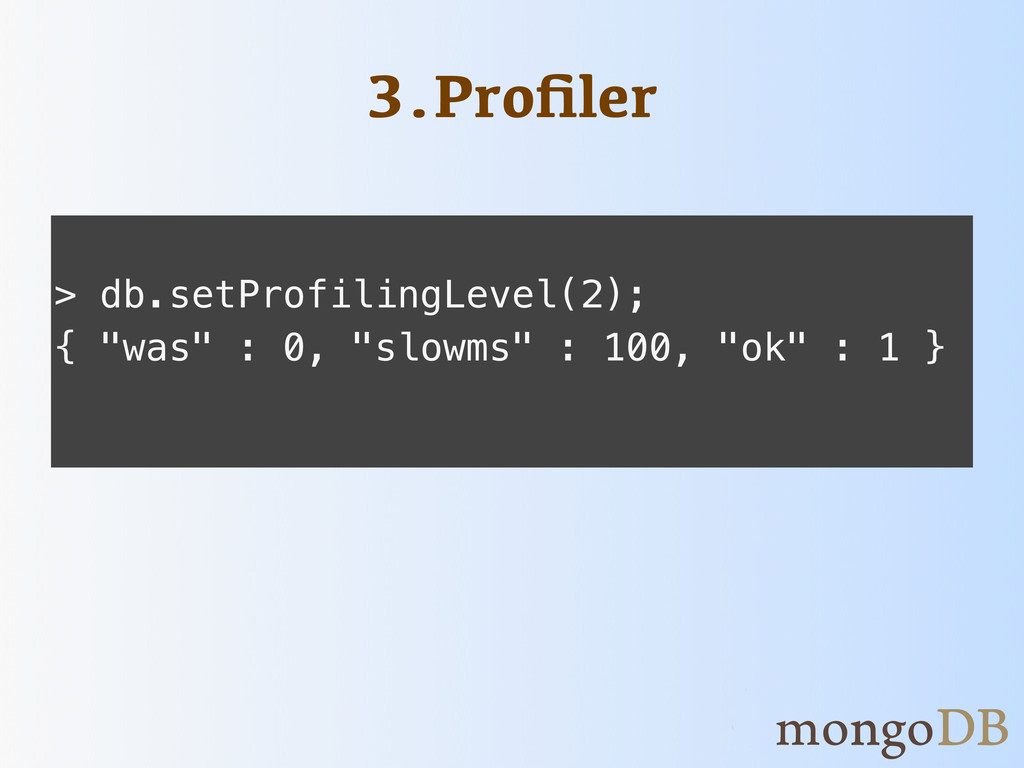
3.Profiler > db.setProfilingLevel(2); { "was" : 0, "slowms" : 100,
"ok" : 1 }
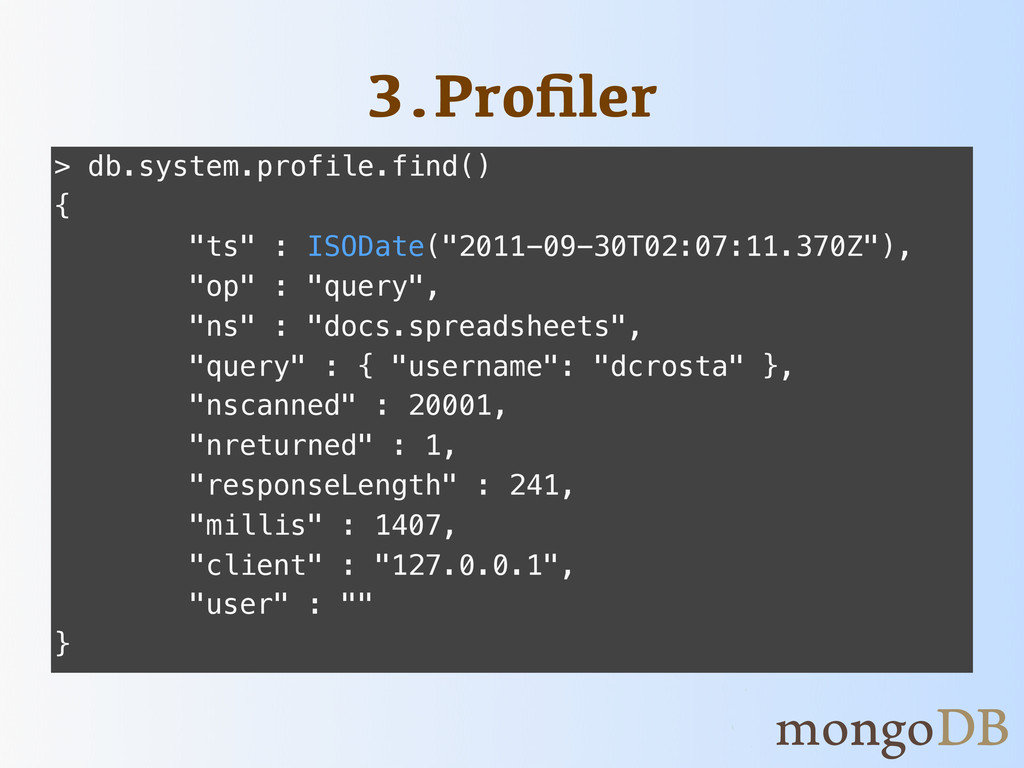
3.Profiler > db.system.profile.find() { "ts" : ISODate("2011-09-30T02:07:11.370Z"), "op" : "query",
"ns" : "docs.spreadsheets", "query" : { "username": "dcrosta" }, "nscanned" : 20001, "nreturned" : 1, "responseLength" : 241, "millis" : 1407, "client" : "127.0.0.1", "user" : "" }
4.Monitoring Service • MMS: 10gen.com/try-mms • Nagios • Munin
INDICATORS
1.Slow Operations Sun May 22 19:01:47 [conn10] query docs.spreadsheets ntoreturn:100
reslen:510436 nscanned:19976 { username: “dcrosta”} nreturned:100 147ms
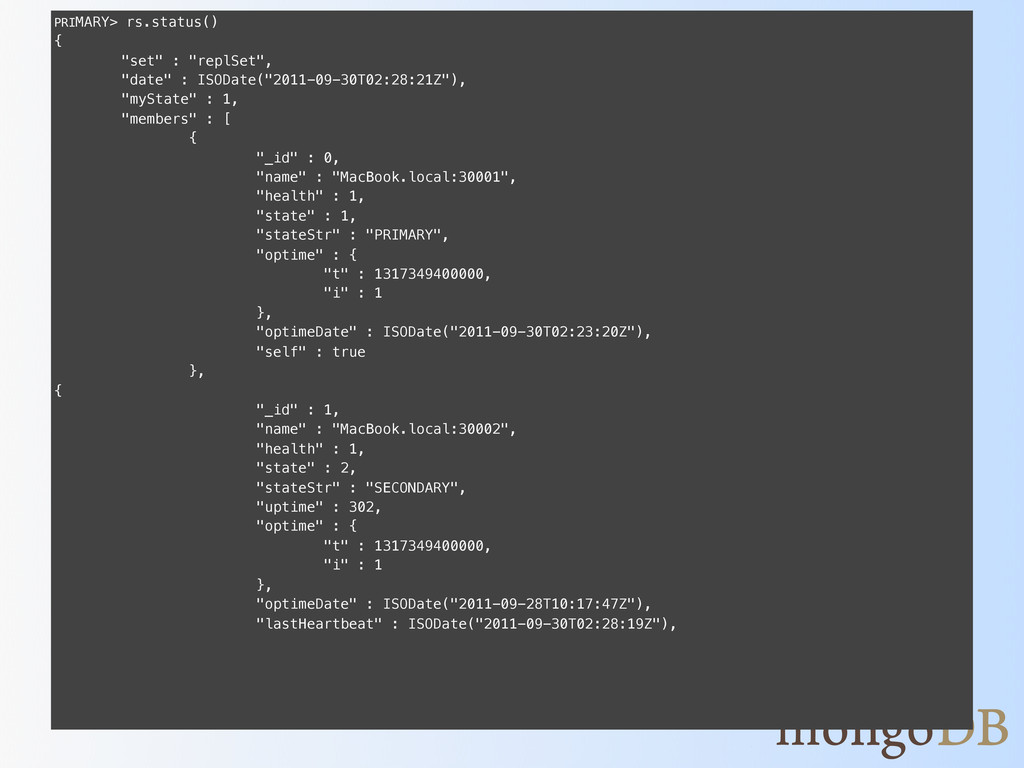
2.Replication Lag PRIMARY> rs.status() { "set" : "replSet", "date" :
ISODate("2011-09-30T02:28:21Z"), "myState" : 1, "members" : [ { "_id" : 0, "name" : "MacBook.local:30001", "health" : 1, "state" : 1, "stateStr" : "PRIMARY", "optime" : { "t" : 1317349400000, "i" : 1 }, "optimeDate" : ISODate("2011-09-30T02:23:20Z"), "self" : true }, { "_id" : 1, "name" : "MacBook.local:30002", "health" : 1, "state" : 2, "stateStr" : "SECONDARY", "uptime" : 302, "optime" : { "t" : 1317349400000, "i" : 1 }, "optimeDate" : ISODate("2011-09-28T10:17:47Z"), "lastHeartbeat" : ISODate("2011-09-30T02:28:19Z"),
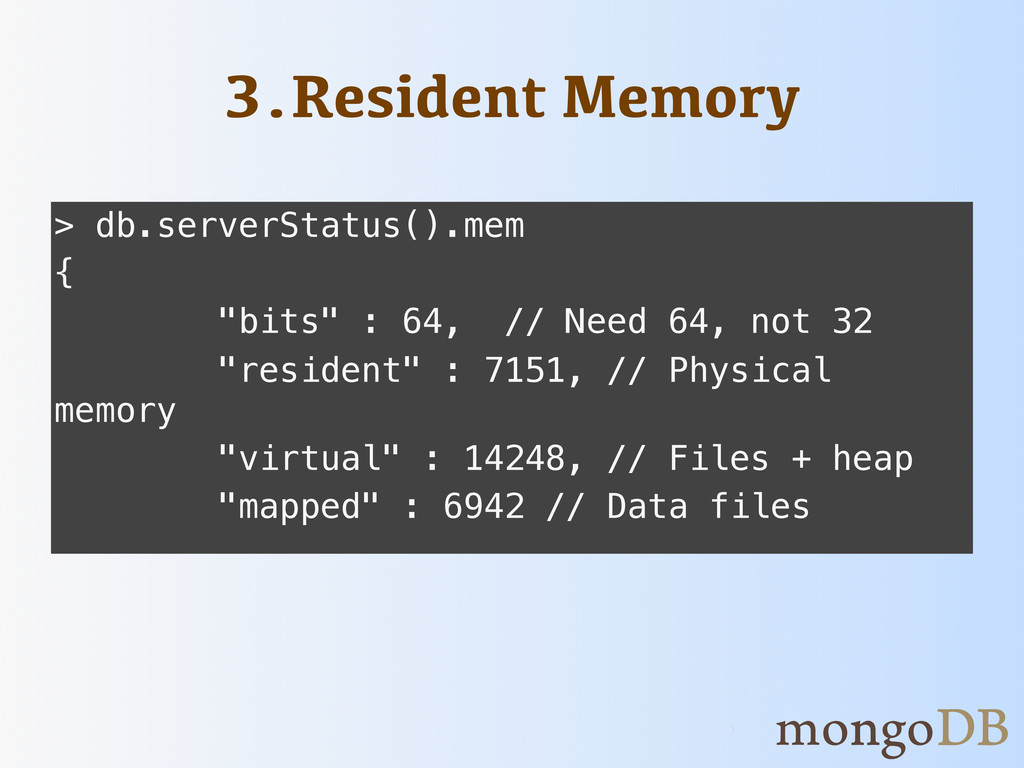
3.Resident Memory > db.serverStatus().mem { "bits" : 64, // Need
64, not 32 "resident" : 7151, // Physical memory "virtual" : 14248, // Files + heap "mapped" : 6942 // Data files
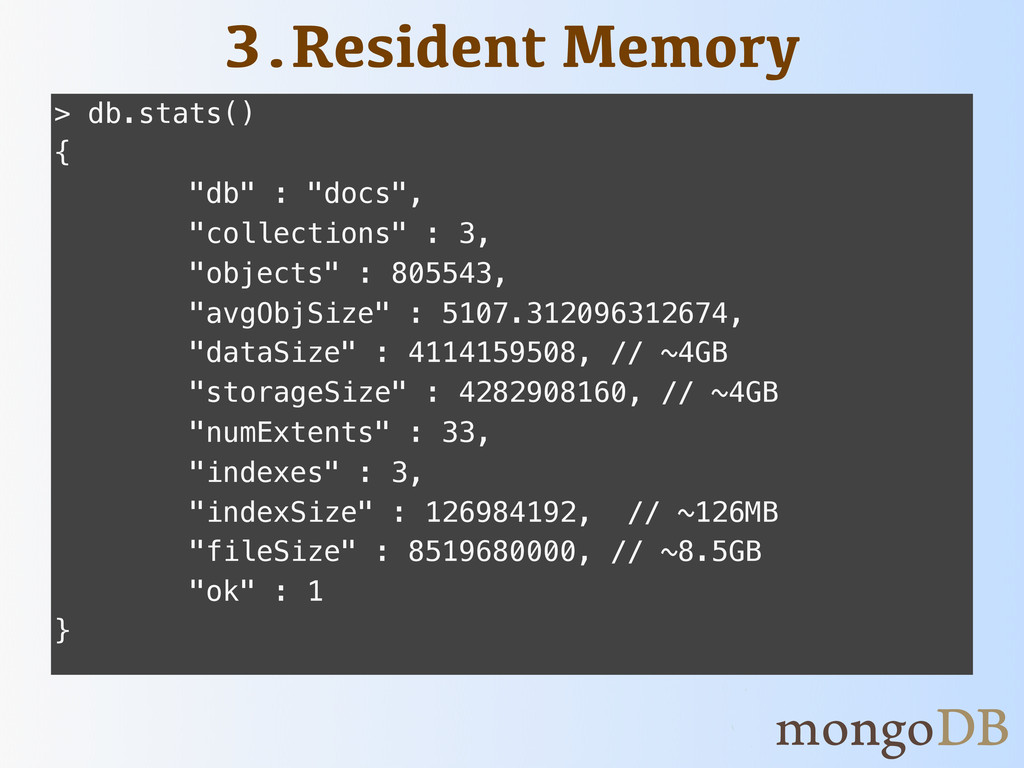
3.Resident Memory > db.stats() { "db" : "docs", "collections" :
3, "objects" : 805543, "avgObjSize" : 5107.312096312674, "dataSize" : 4114159508, // ~4GB "storageSize" : 4282908160, // ~4GB "numExtents" : 33, "indexes" : 3, "indexSize" : 126984192, // ~126MB "fileSize" : 8519680000, // ~8.5GB "ok" : 1 }
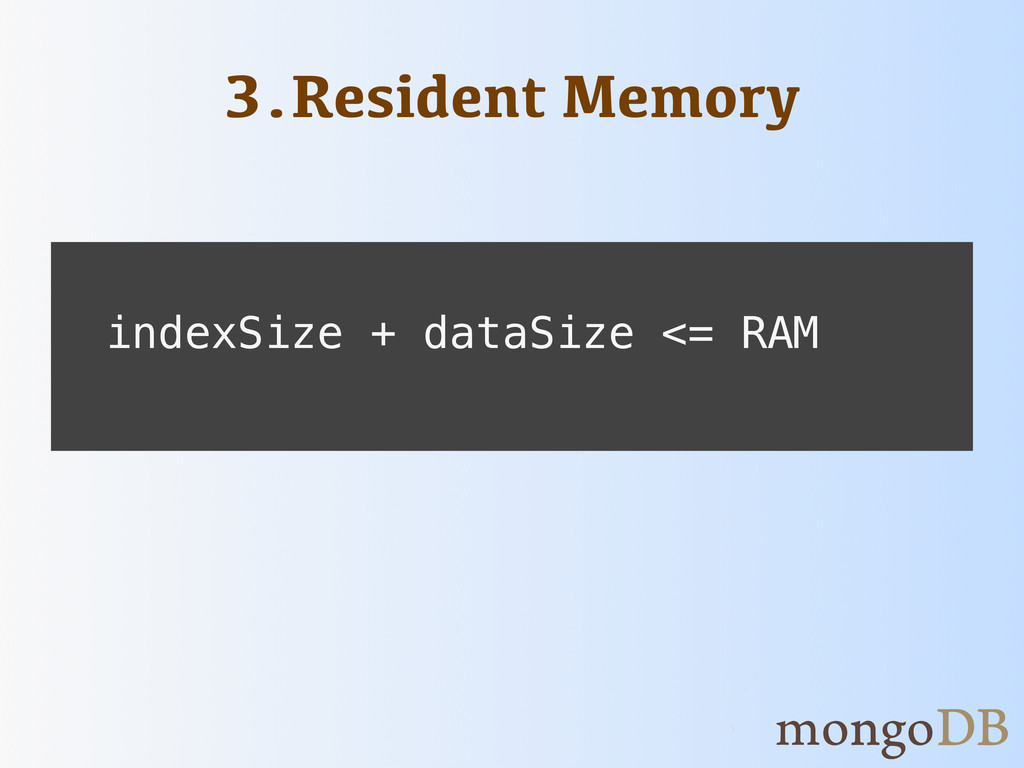
3.Resident Memory ! ! indexSize + dataSize <= RAM
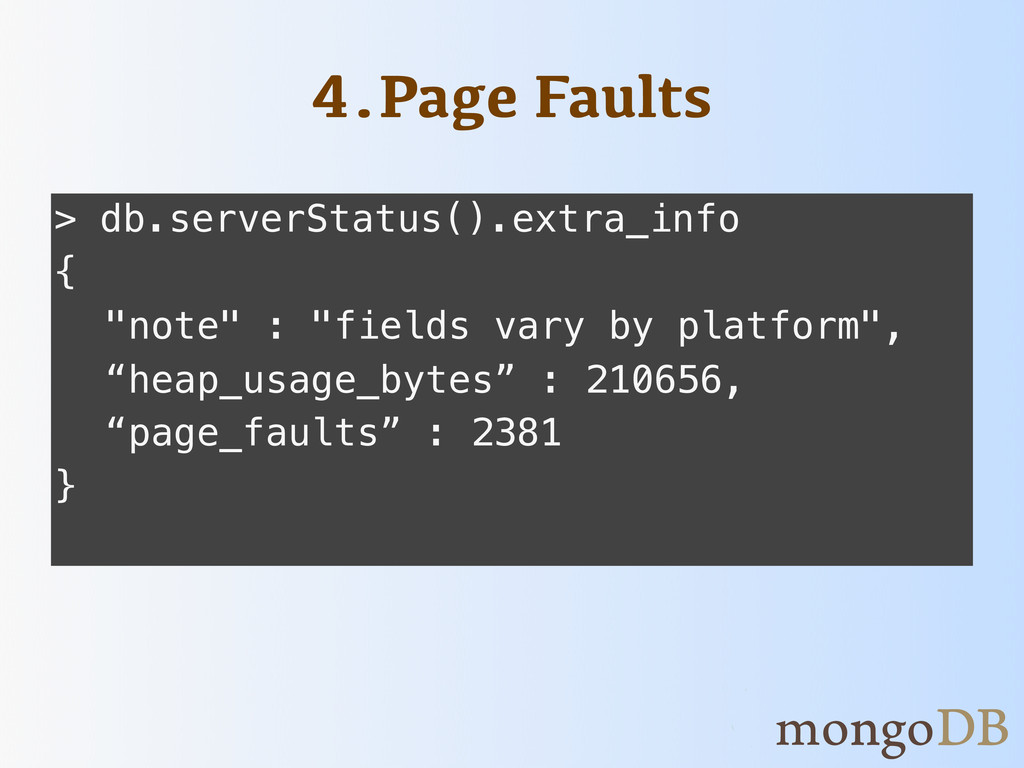
4.Page Faults > db.serverStatus().extra_info { ! "note" : "fields vary
by platform", ! “heap_usage_bytes” : 210656, ! “page_faults” : 2381 }
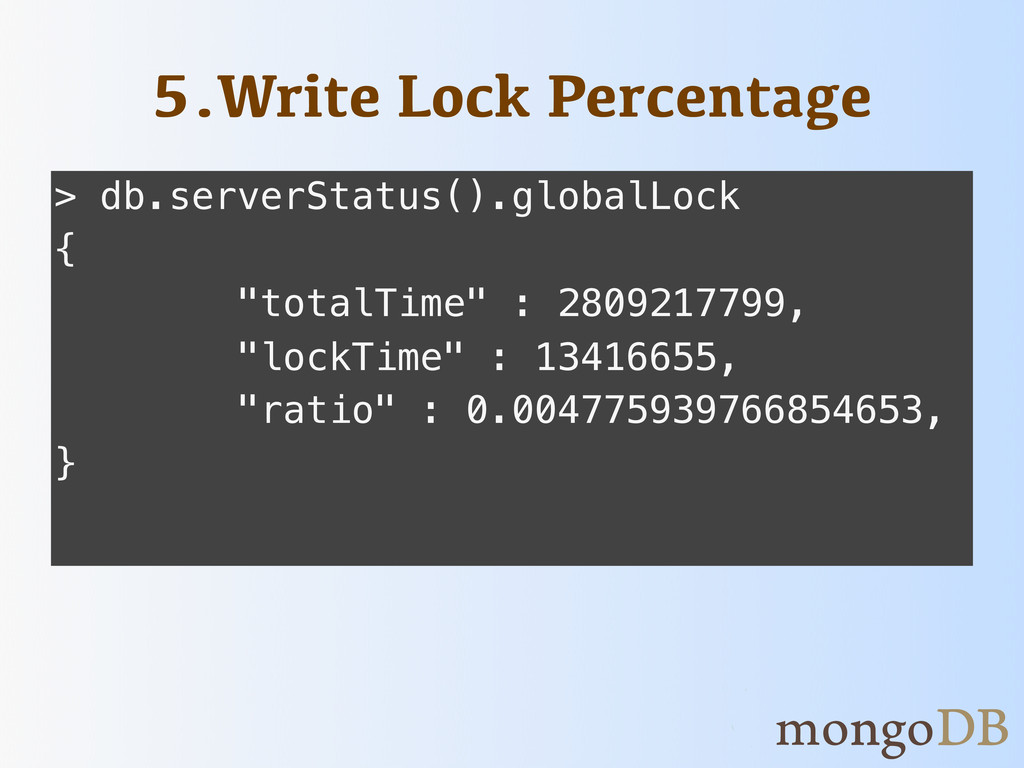
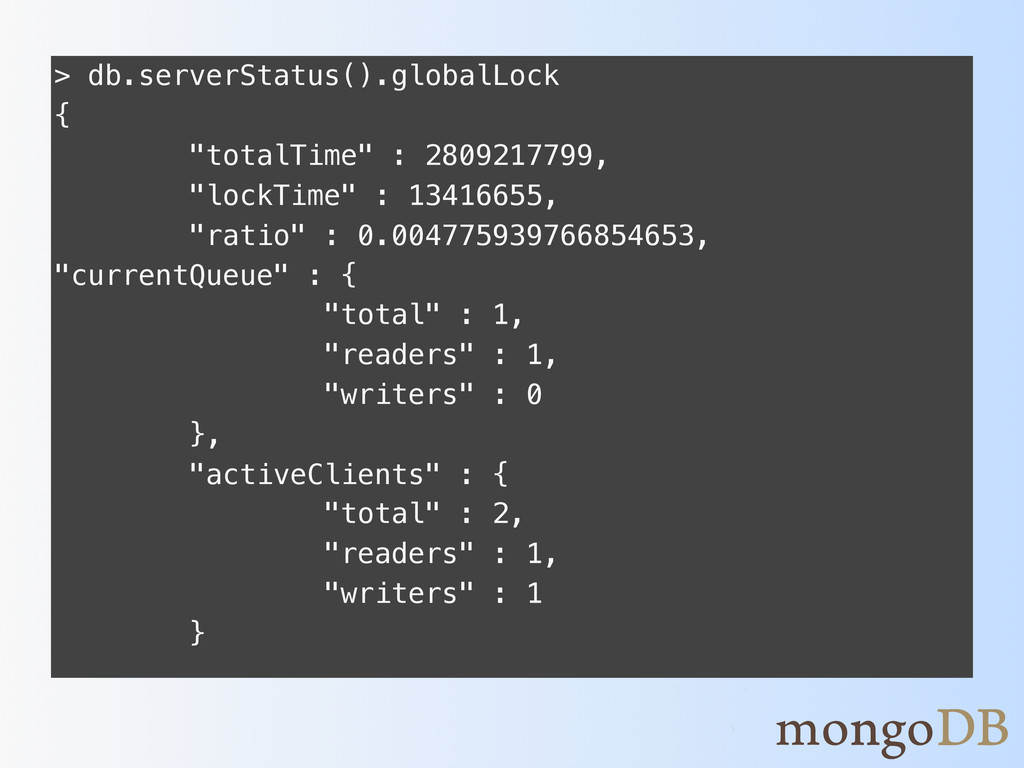
5.Write Lock Percentage > db.serverStatus().globalLock { "totalTime" : 2809217799, "lockTime"
: 13416655, "ratio" : 0.004775939766854653, }
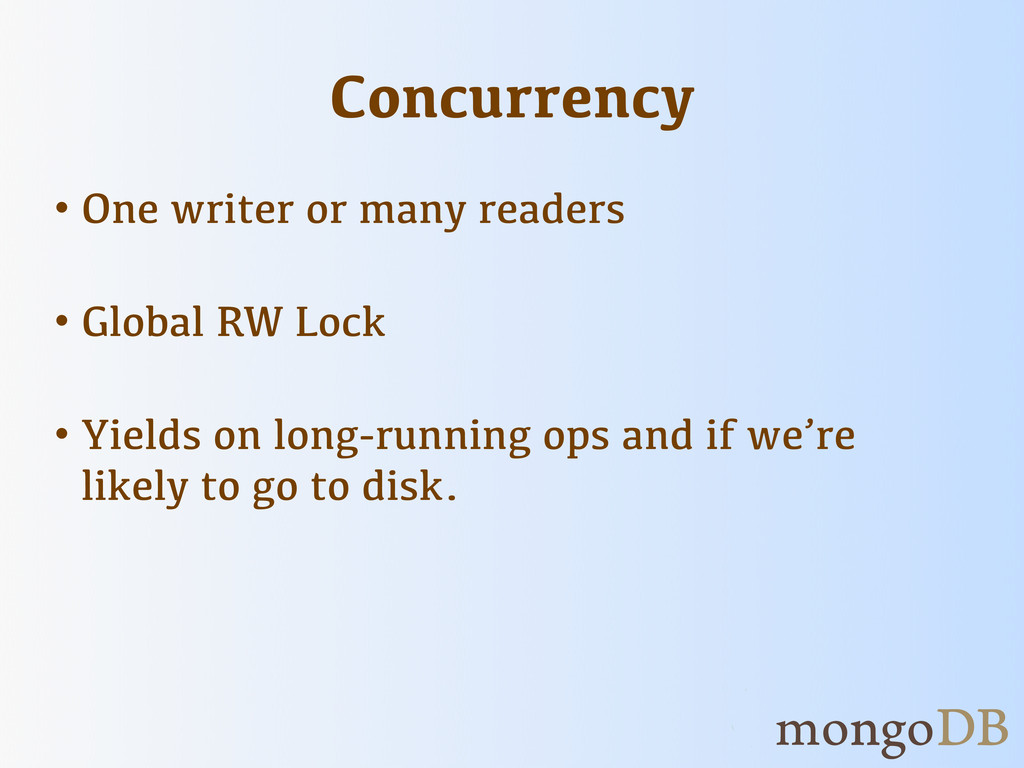
Concurrency • One writer or many readers • Global RW
Lock • Yields on long-running ops and if we’re likely to go to disk.
High Lock Percentage? You’re Probably Paging!
6.Reader and Writer Queues > db.serverStatus().globalLock { "totalTime" : 2809217799,
"lockTime" : 13416655, "ratio" : 0.004775939766854653, "currentQueue" : { "total" : 1, "readers" : 1, "writers" : 0 }, "activeClients" : { "total" : 2, "readers" : 1, "writers" : 1 }
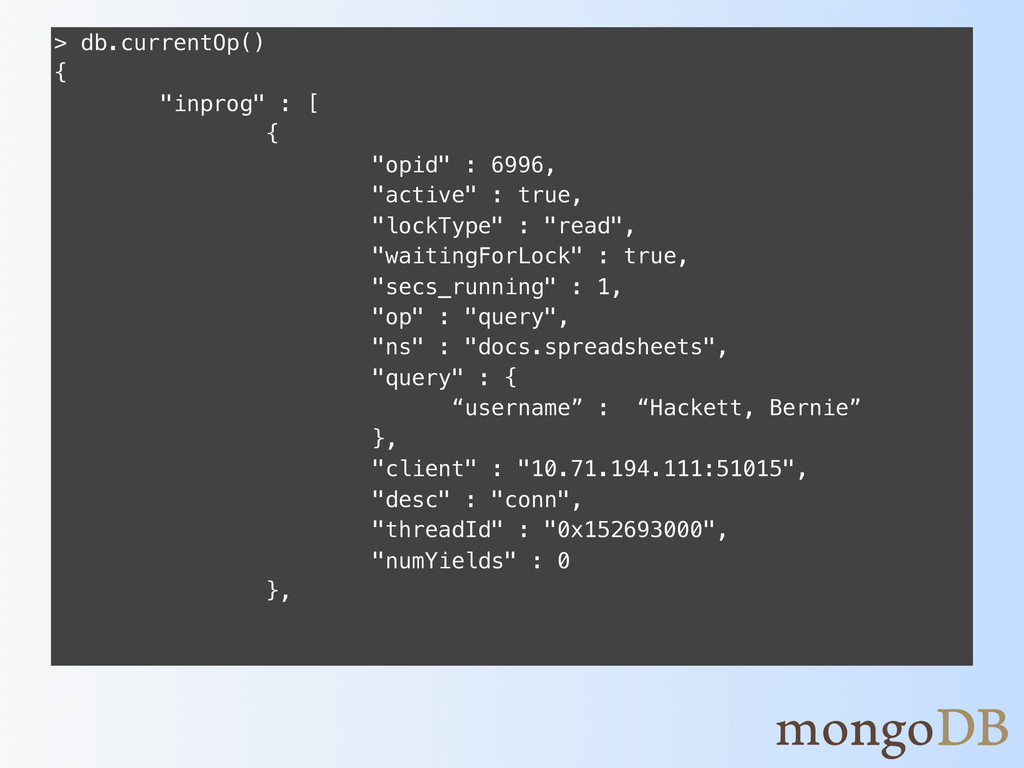
6.Reader and Writer Queues > db.currentOp() { "inprog" : [
{ "opid" : 6996, "active" : true, "lockType" : "read", "waitingForLock" : true, "secs_running" : 1, "op" : "query", "ns" : "docs.spreadsheets", "query" : { “username” : “Hackett, Bernie” }, "client" : "10.71.194.111:51015", "desc" : "conn", "threadId" : "0x152693000", "numYields" : 0 },
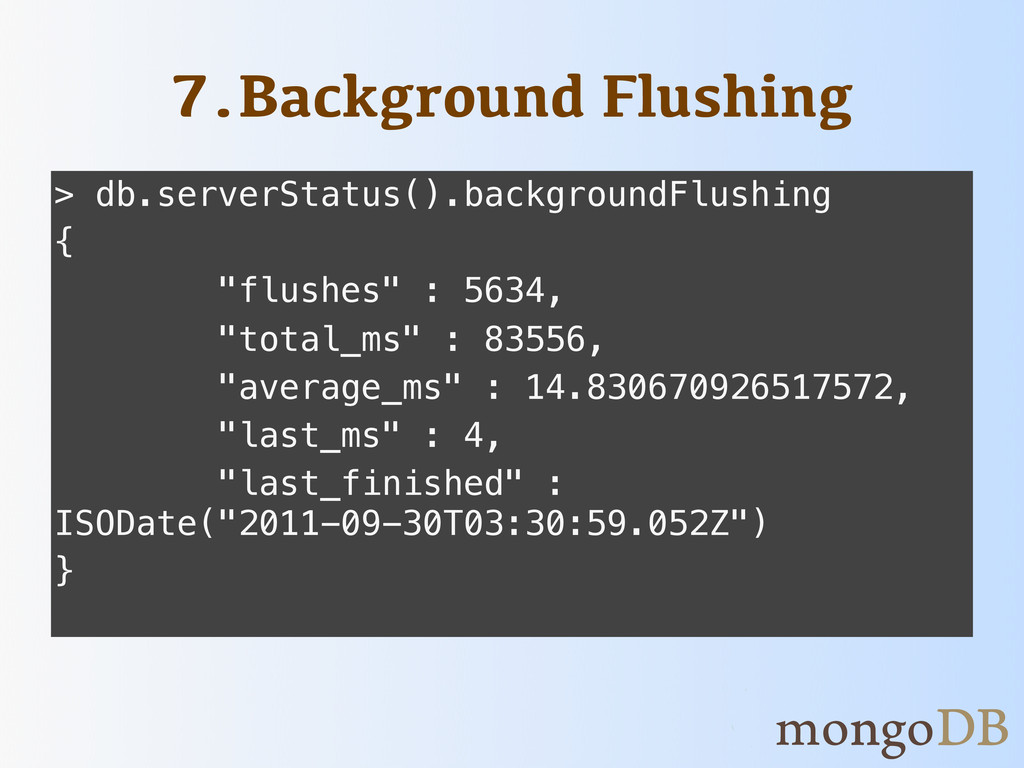
7.Background Flushing > db.serverStatus().backgroundFlushing { "flushes" : 5634, "total_ms" :
83556, "average_ms" : 14.830670926517572, "last_ms" : 4, "last_finished" : ISODate("2011-09-30T03:30:59.052Z") }
Disk Considerations • Raid • SSD • SAN?
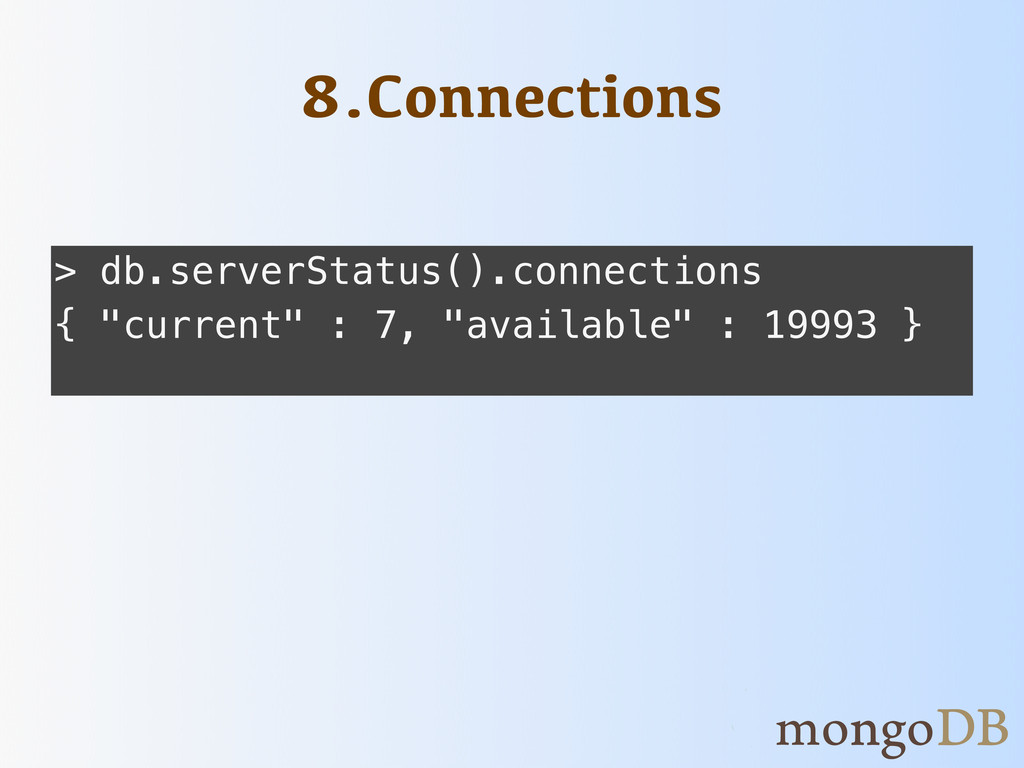
8.Connections > db.serverStatus().connections { "current" : 7, "available" : 19993
}
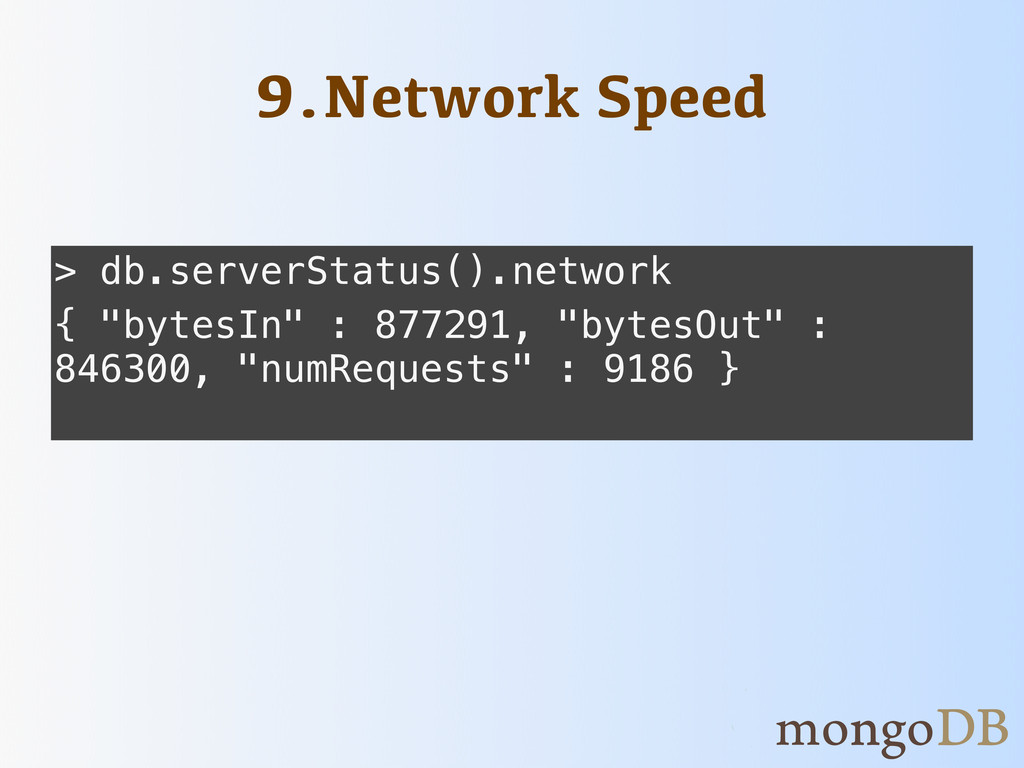
9.Network Speed > db.serverStatus().network { "bytesIn" : 877291, "bytesOut" :
846300, "numRequests" : 9186 }
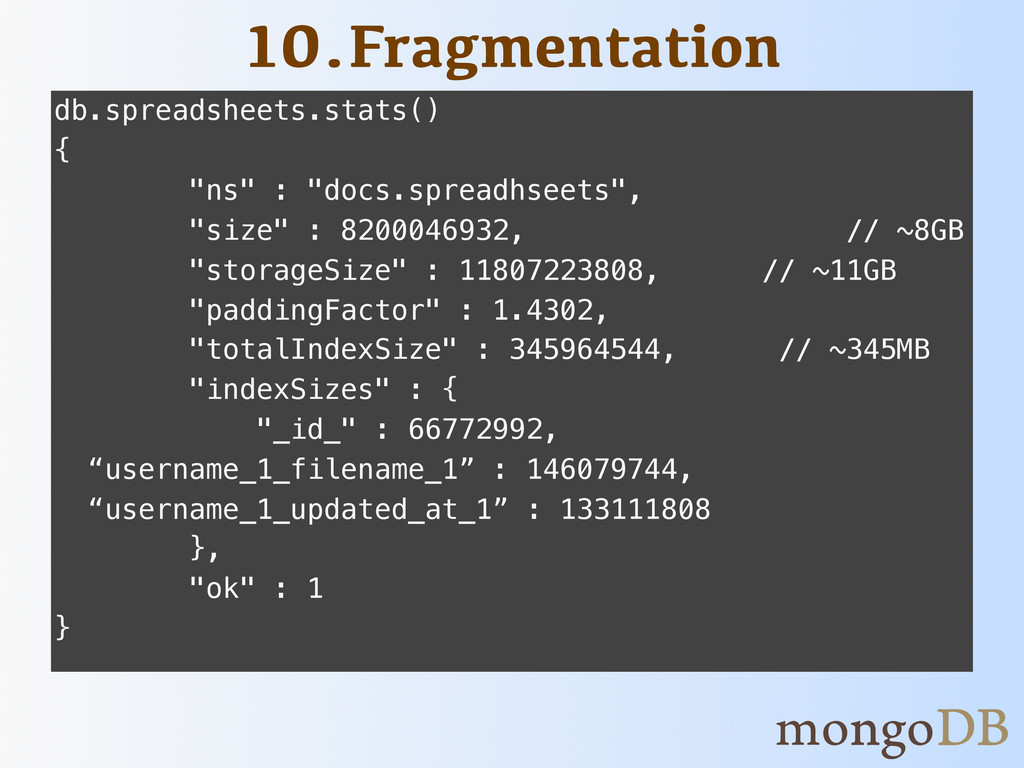
10.Fragmentation db.spreadsheets.stats() { "ns" : "docs.spreadhseets", "size" : 8200046932, //
~8GB "storageSize" : 11807223808, // ~11GB "paddingFactor" : 1.4302, "totalIndexSize" : 345964544, // ~345MB "indexSizes" : { "_id_" : 66772992, “username_1_filename_1” : 146079744, “username_1_updated_at_1” : 133111808 }, "ok" : 1 }
10.Fragmentation 2 is the Magic Number
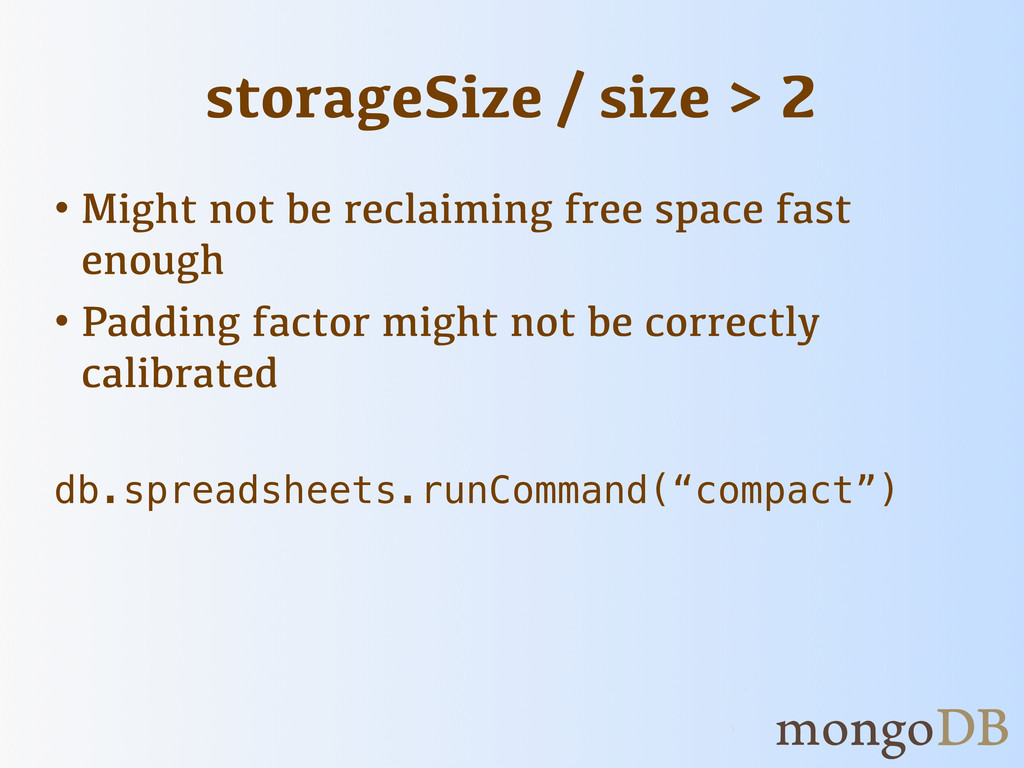
storageSize / size > 2 • Might not be reclaiming
free space fast enough • Padding factor might not be correctly calibrated db.spreadsheets.runCommand(“compact”)
paddingFactor > 2 • You might have the wrong data
model • You might be growing documents too much • Should review Schema Design
download at mongoDB.org
We’re Hiring Engineers, Sales, Evangelist, Marketing, Support, Developers @mongodb_jobs http://linkd.in/joinmongo
We’re Always Around For Conferences, Appearances and Meetups 10gen.com/events @mongodb
h2p://bit.ly/mongo8
![Diagnostics and Performance Tuning Dan Crosta, 10gen [email protected] @lazlofruvous](https://files.speakerdeck.com/presentations/4f1dcdceded19c001f00df09/slide_0.jpg)
![1.Slow Operations Sun May 22 19:01:47 [conn10] query docs.spreadsheets ntoreturn:100](https://files.speakerdeck.com/presentations/4f1dcdceded19c001f00df09/slide_10.jpg)