Upgrade to Pro — share decks privately, control downloads, hide ads and more …

polar2018.pdf

Denis Sergeev
June 22, 2018
58

 polar2018.pdf

Denis Sergeev

June 22, 2018
Tweet

Transcript

  1. Modification of Polar Low Development by Sea Ice and Svalbard

    Orography Denis Sergeev, Ian Renfrew, Thomas Spengler POLAR2018 | Davos, Switzerland | 22 June 2018
  2. Credit: met.no Credit: U. Tokyo Japan Sea Credit: NEOSDAAS Norwegian

    Sea Credit: NEOSDAAS Barents Sea Credit: NRK.no Credit: A. Carleton Southern Ocean What are polar lows?
  3. Where are they observed? Stoll et al. (2018) Verezemskaya et

    al. (2017) Bracegirdle and Gray (2008) Michel et al. (2018)
  4. ? Svalbard ➔ Large non-dimensional height ➔ Major obstacle for

    CAOs ➔ Upstream blocking, flow splitting and lee vorticity stretching
  5. Svalbard ➔ Large non-dimensional height ➔ Major obstacle for CAOs

    ➔ Upstream blocking, flow splitting and lee vorticity stretching ? Sea ice ➔ Concave shape ➔ Convergence of CAOs ➔ Surface heat fluxes ➔ Is polar low activity correlated with sea ice extent in the North Atlantic? ?
  6. “Yes, it is*” - Sergeev et al. (2017), QJRMS *As

    compared to aircraft, dropsonde & satellite observations
  7. Sea ice edge SLP contours (every 2 hPa) Cyclonic vorticity

    ζ (10-4 s-1) at 950 hPa PV at 500 hPa (every 2 PVU)
  8. CASE A CASE B Intensification Mature stage L Polar low

    L Polar low L Polar low L Polar low
  9. CASE A CASE B Mature stage L Polar low L

    Polar low L Polar low L Polar low Polar low
  10. CASE A CASE B L Polar low L Polar low

    L Polar low L Polar low Polar low Polar low
  11. Similarities ➔ Western periphery of a synoptic-scale cyclone ➔ Both

    originate near Svalbard and join vorticity clusters downstream ➔ Develop due to a mix of baroclinic and barotropic instability How CASE A is different to CASE B? ➔ Upper-level PV anomaly >4 PVU ➔ Rossby penetration depth ~4.8 km ➔ Resembles type B cyclogenesis of Petterssen and Smebye (1971)
  12. CTRL What we actually did: ➔ Set elevation to 0

    ➔ Set land-sea mask to “sea” ➔ Replace with sea ice
  13. NOSVA What we actually did: ➔ Set elevation to 0

    ➔ Set land-sea mask to “sea” ➔ Replace with sea ice
  14. CTRL CTRL NOSVA NOSVA CASE A CASE B Sea ice

    edge SLP contours (every 2 hPa) Cyclonic vorticity ζ (10-4 s-1) at 950 hPa Only 1 time step (mature stage)
  15. NOSVA NOSVA CTRL CTRL CASE A CASE B When Svalbard

    is removed… ➔ PLs appear still appear ➔ They grow on the Barents Sea vorticity filaments
  16. NOSVA NOSVA CTRL CTRL CASE A CASE B When Svalbard

    is removed… ➔ PLs appear still appear ➔ They grow on the Barents Sea vorticity filaments The vorticity “tail” is detached = no reinforcement from Svalbard CASE A PL is “steered” by the PV anomaly
  17. CTRL ICE76N experiment ➔ Extend sea ice to the south

    (76°N) ➔ Make the edge zonally straight ➔ (Svalbard is intact)
  18. CTRL ICE76N experiment ➔ Extend sea ice to the south

    (76°N) ➔ Make the edge zonally straight ➔ (Svalbard is intact) ICE76N
  19. ICE76N ICE76N CTRL CTRL CASE A CASE B With changed

    sea ice… ➔ PLs are weaker ➔ Due to lack of surface heat flux Small-scale waves without a dominant centre
  20. ICE76N ICE76N CTRL CTRL CASE A CASE B New layers

    shown: ➔ Sensible heat flux (positive upward)
  21. CTRL CTRL CASE A CASE B Average within a radius

    for every point along the track
  22. CTRL CTRL CASE A CASE B Landfall Landfall Formation Formation

    Average within a radius for every point along the track Sensible heat flux
  23. CASE A CASE B Sensible heat flux Relative vorticity ➔

    The lack of SHF at the start hinders the PL growth ➔ When PL moves to the ice-free surface, there is a big spike in heat flux ICE76N CTRL ICE76N CTRL ICE76N CTRL ICE76N CTRL Ice edge Ice edge
  24. CASE A CASE B Sensible heat flux Relative vorticity ➔

    The lack of SHF at the start hinders the PL growth ➔ When PL moves to the ice-free surface, there is a big spike in heat flux ➔ However this “boost” of heat fluxes is not enough for the PL to reach CTRL instensity* *Can be an artefact of tracking method (choosing what vorticity cluster to track) ICE76N CTRL CTRL ICE76N CTRL ICE76N ICE76N Ice edge Ice edge CTRL
  25. Summary* ➔ Many polar lows develop due to merging of

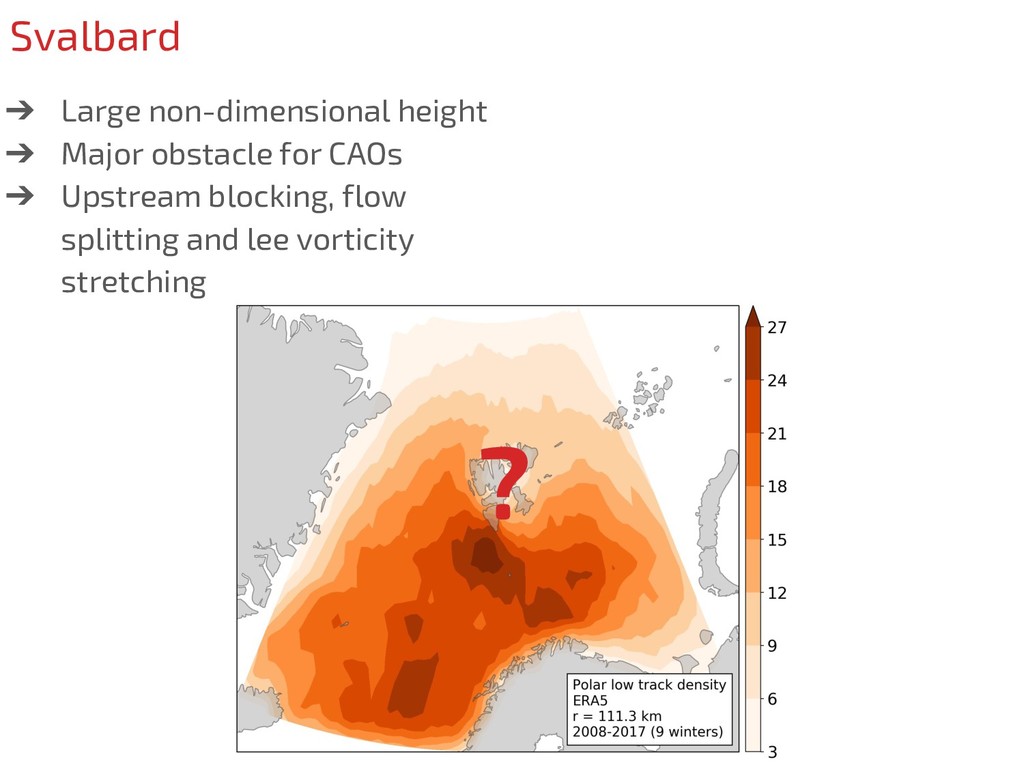
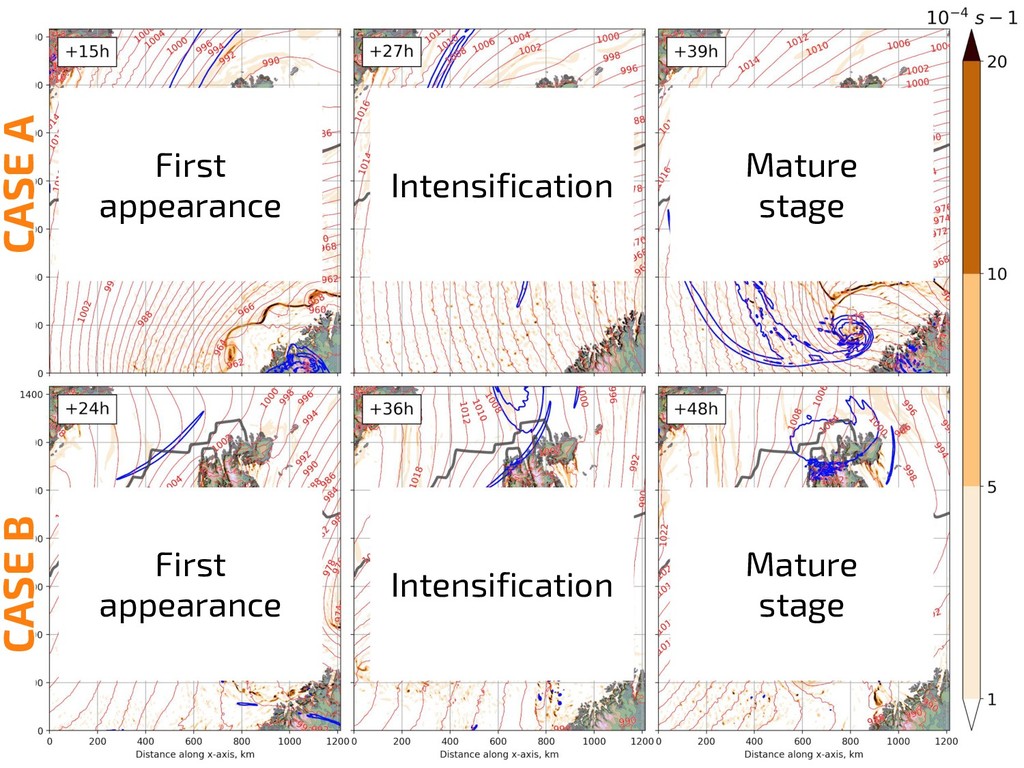
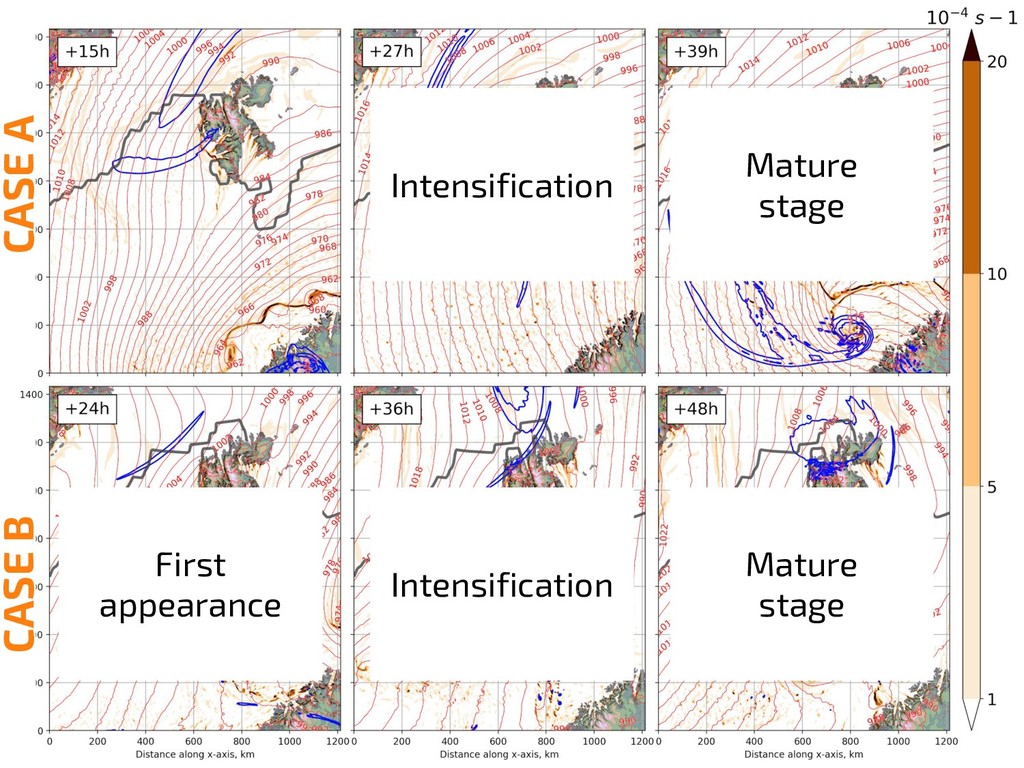
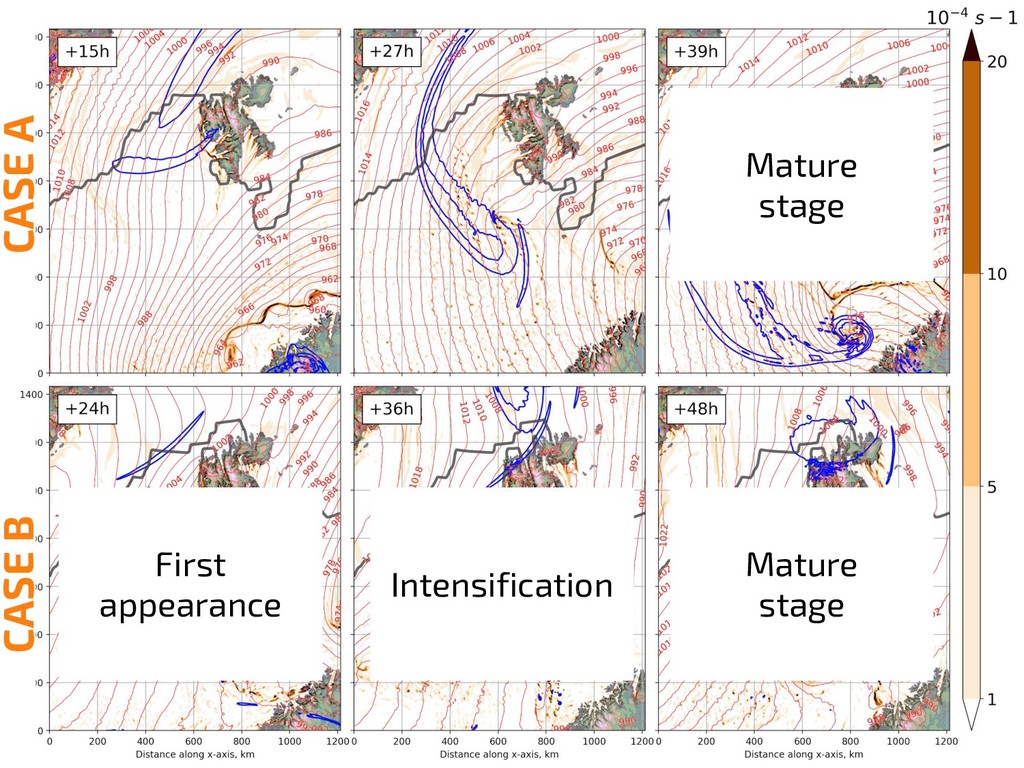
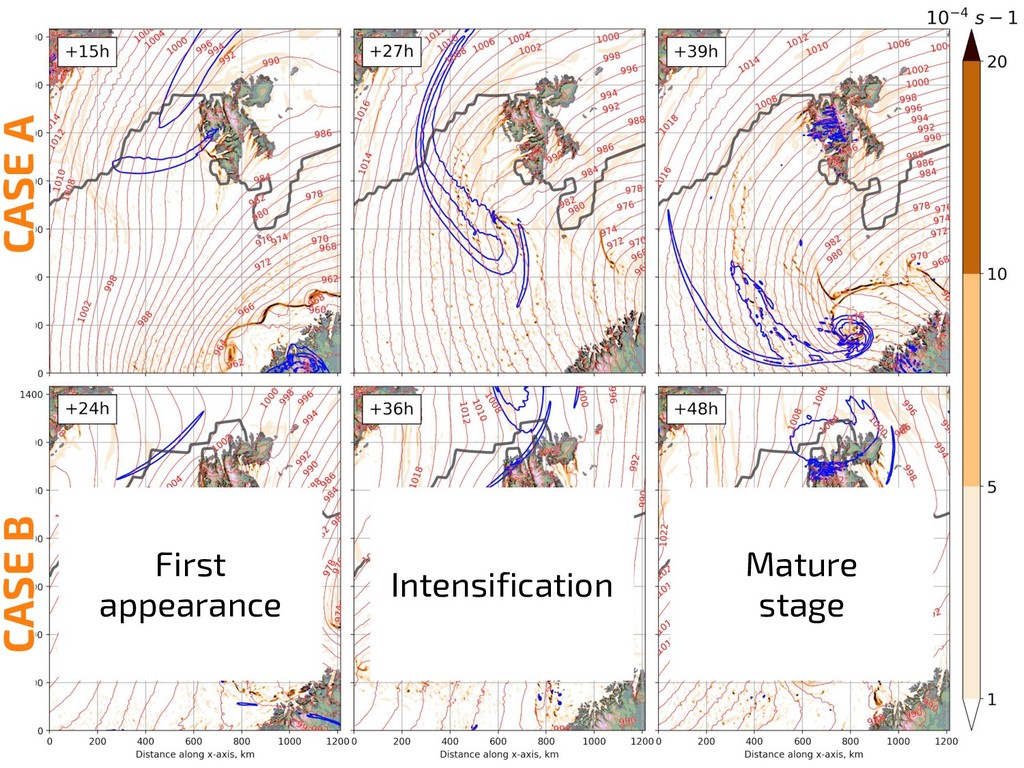
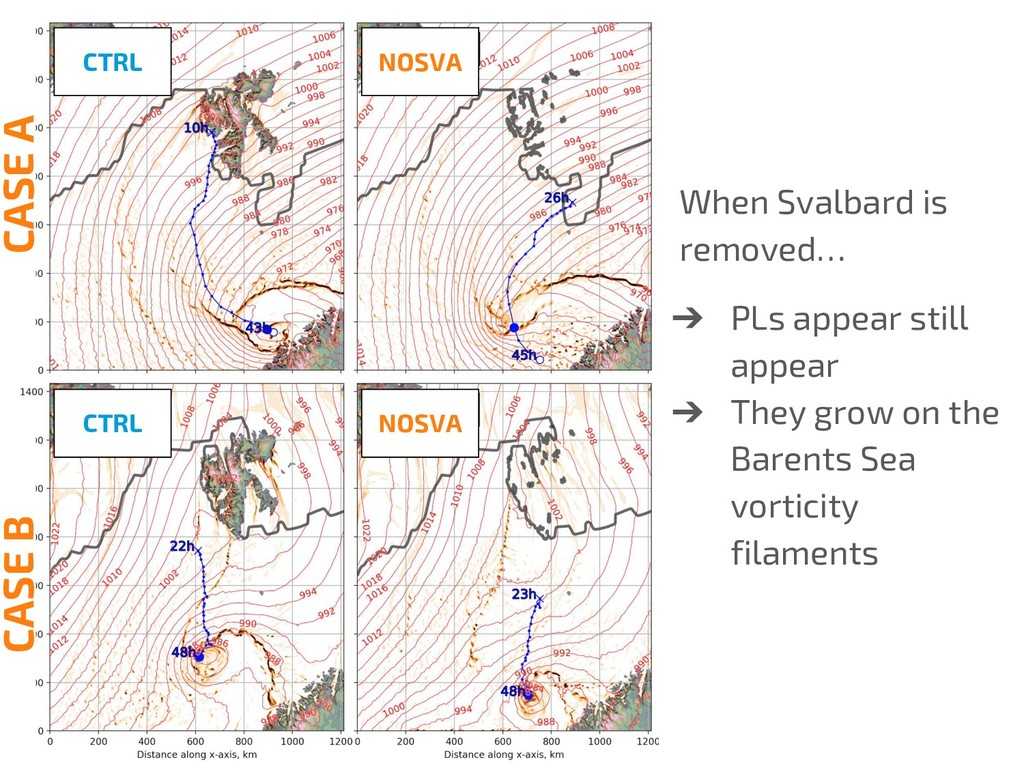
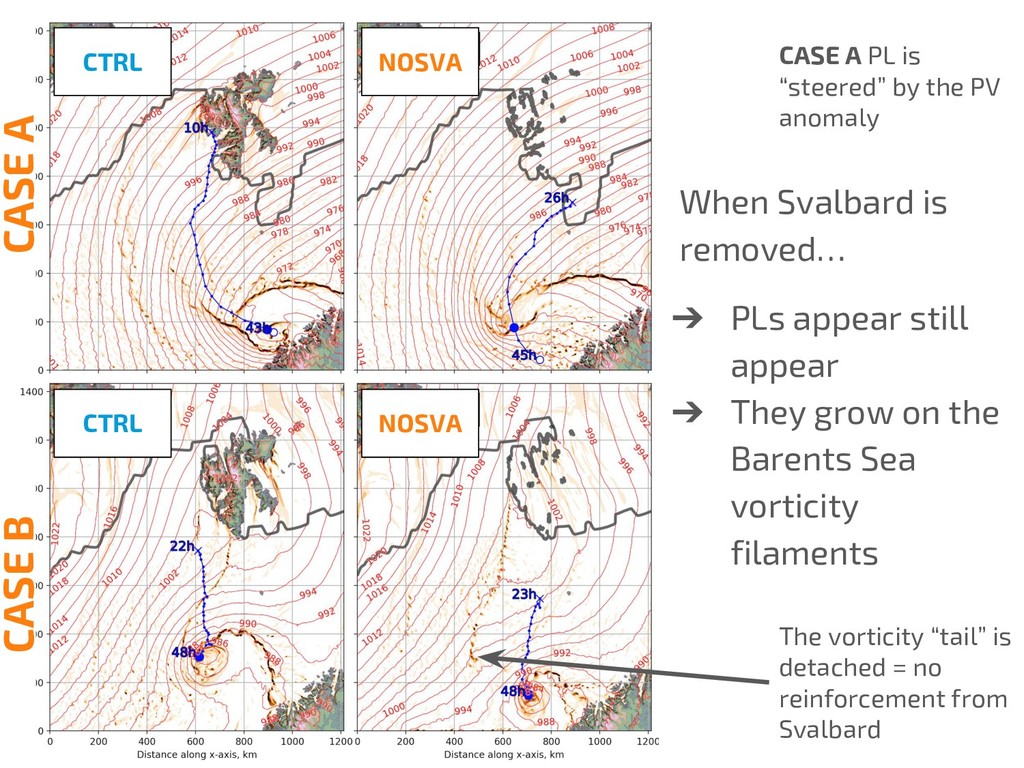
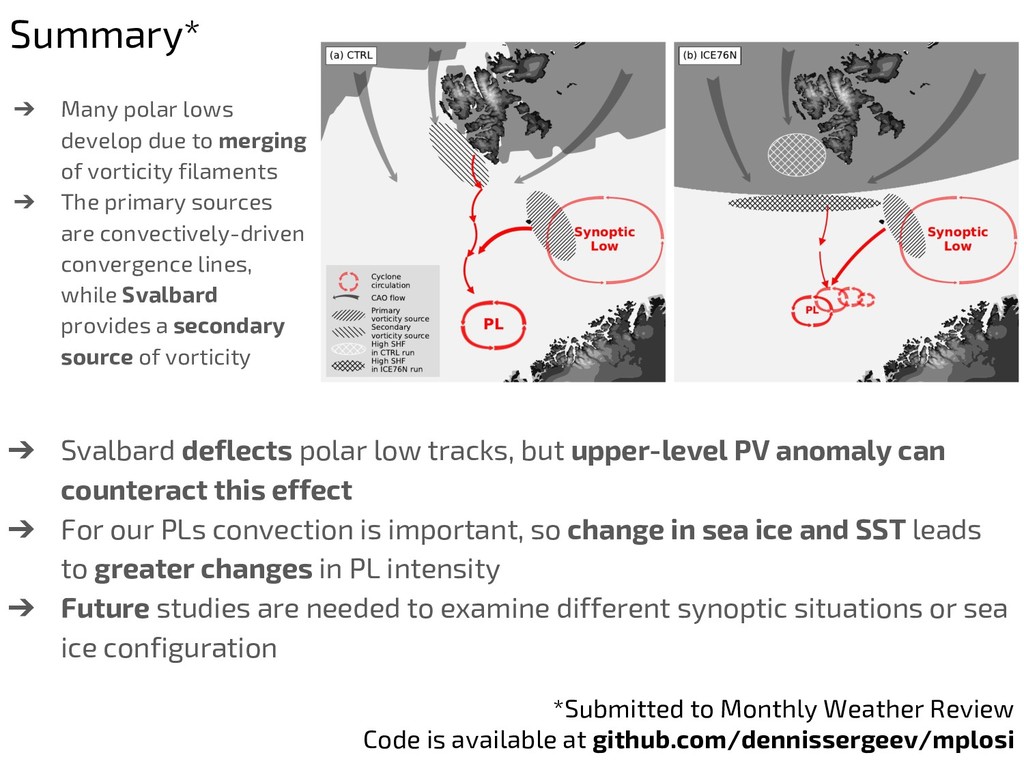
    vorticity filaments ➔ The primary sources are convectively-driven convergence lines, while Svalbard provides a secondary source of vorticity ➔ Svalbard deflects polar low tracks, but upper-level PV anomaly can counteract this effect ➔ For our PLs convection is important, so change in sea ice and SST leads to greater changes in PL intensity ➔ Future studies are needed to examine different synoptic situations or sea ice configuration *Submitted to Monthly Weather Review Code is available at github.com/dennissergeev/mplosi