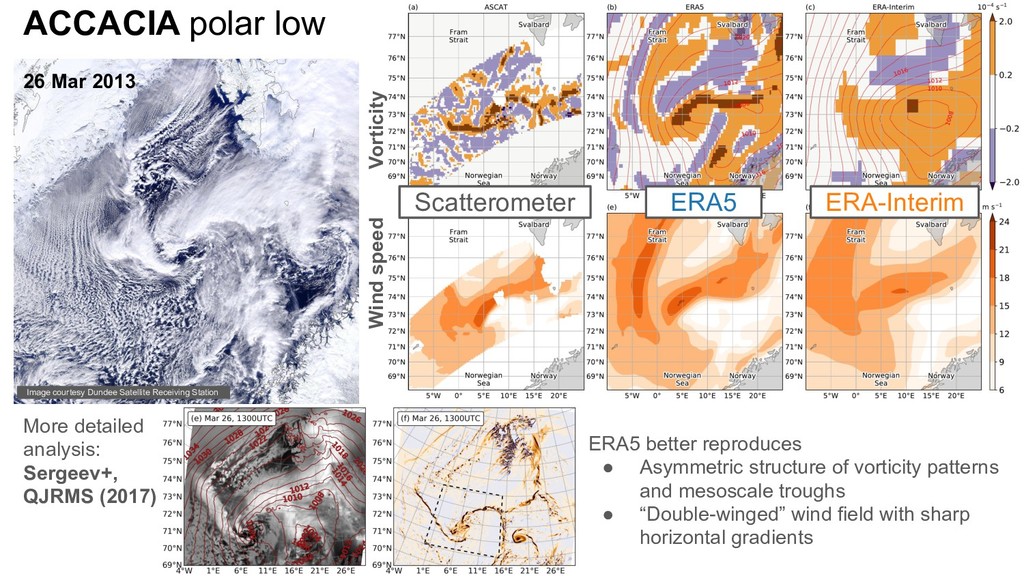
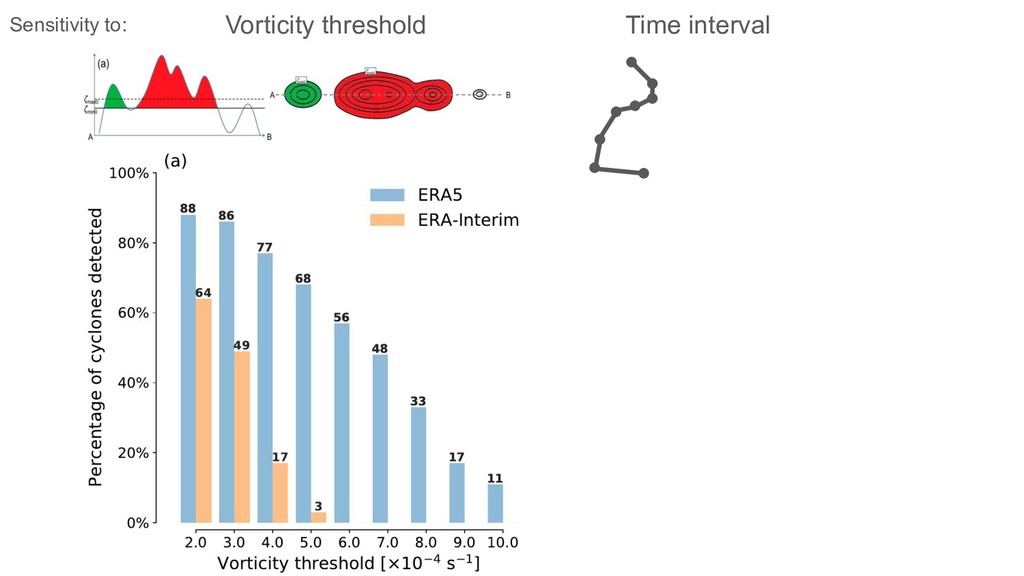
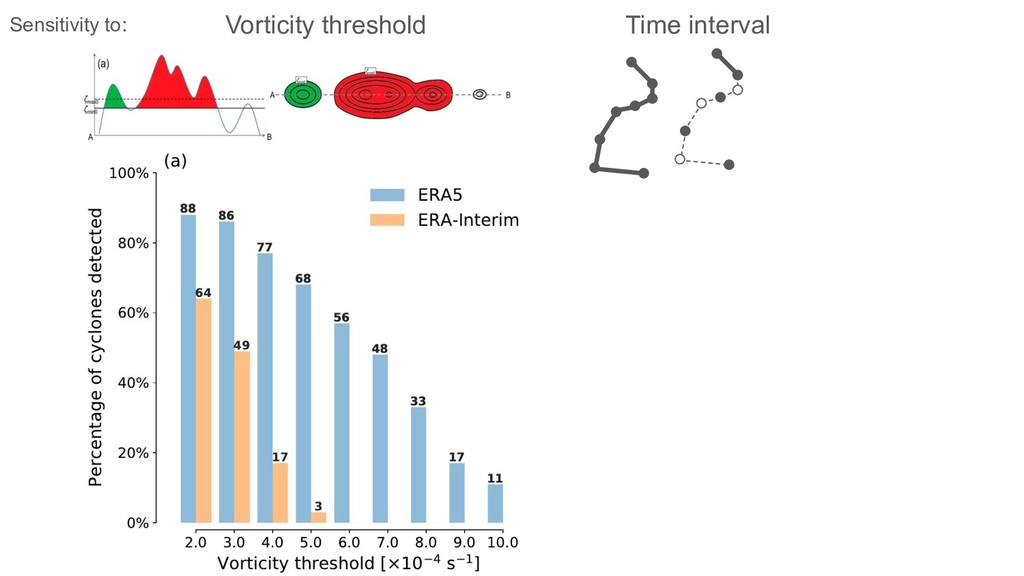
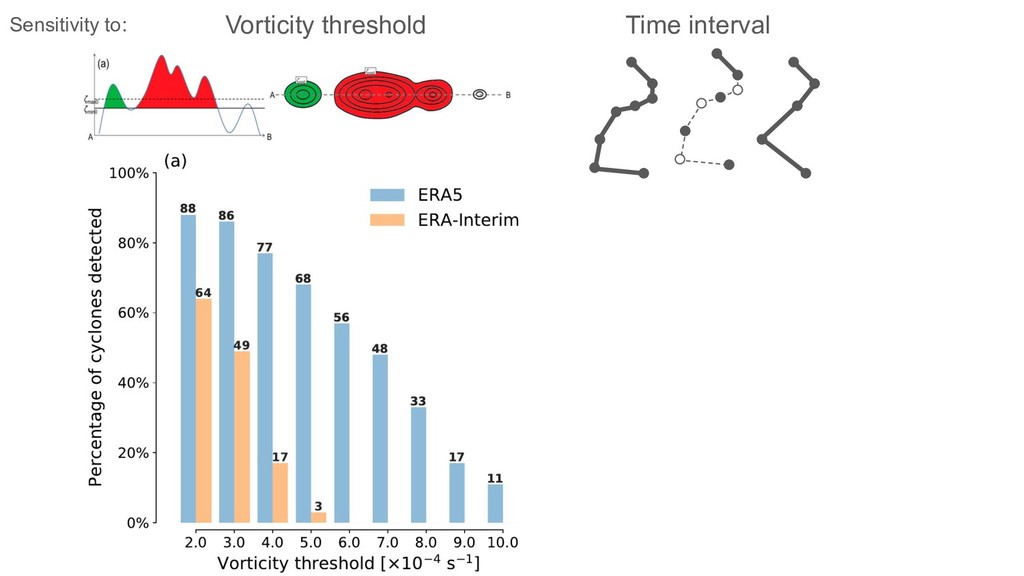
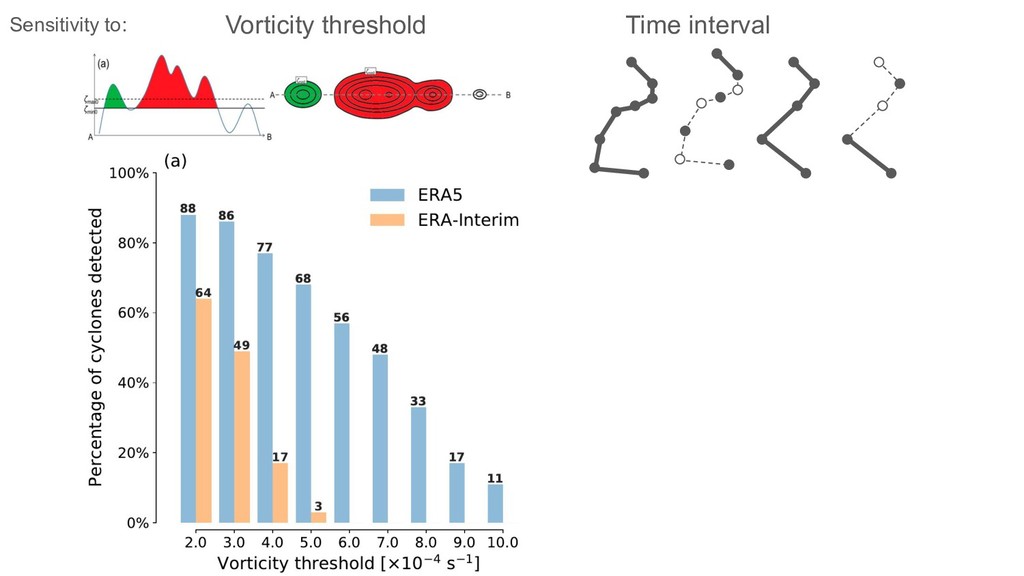
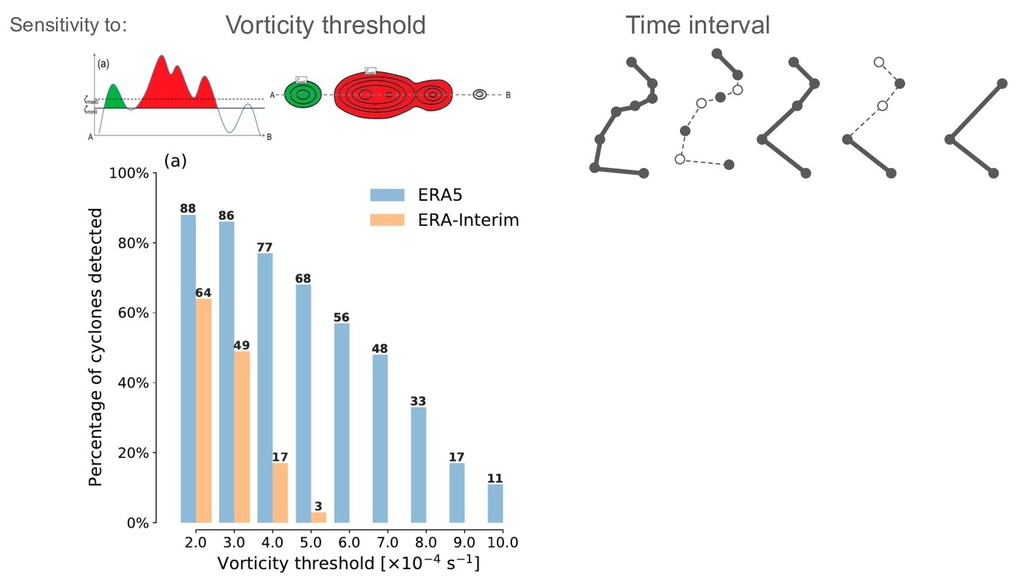
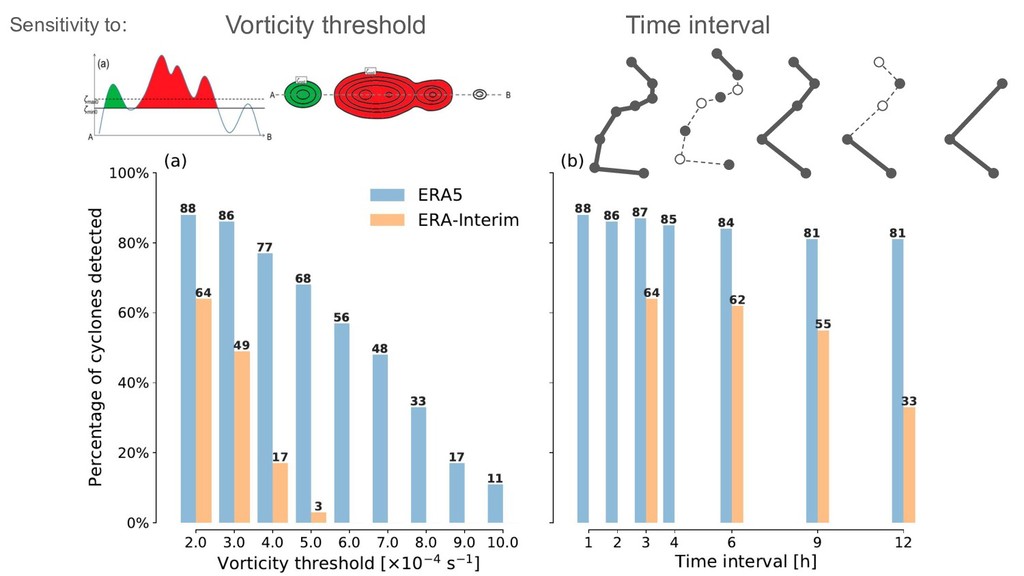
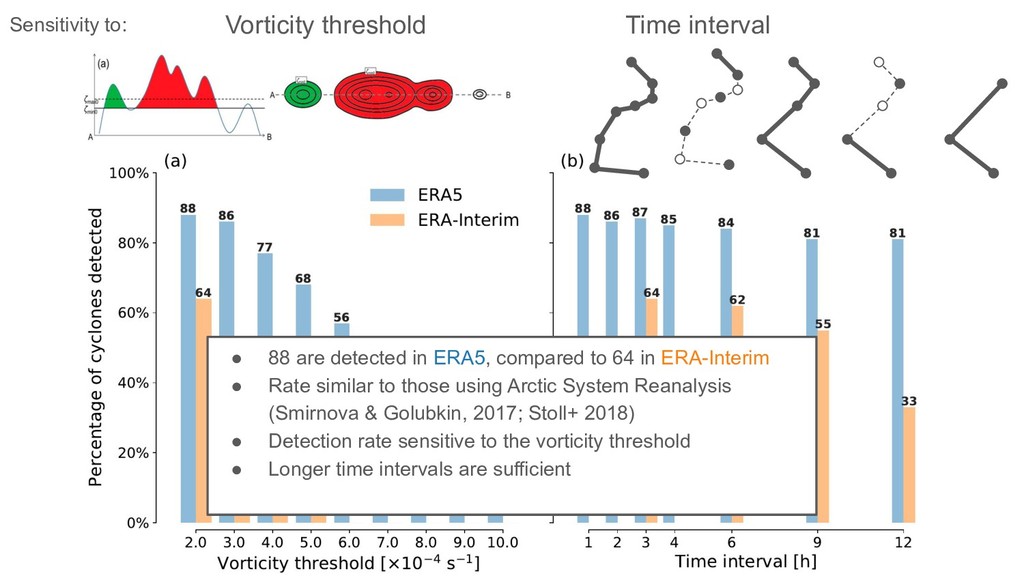
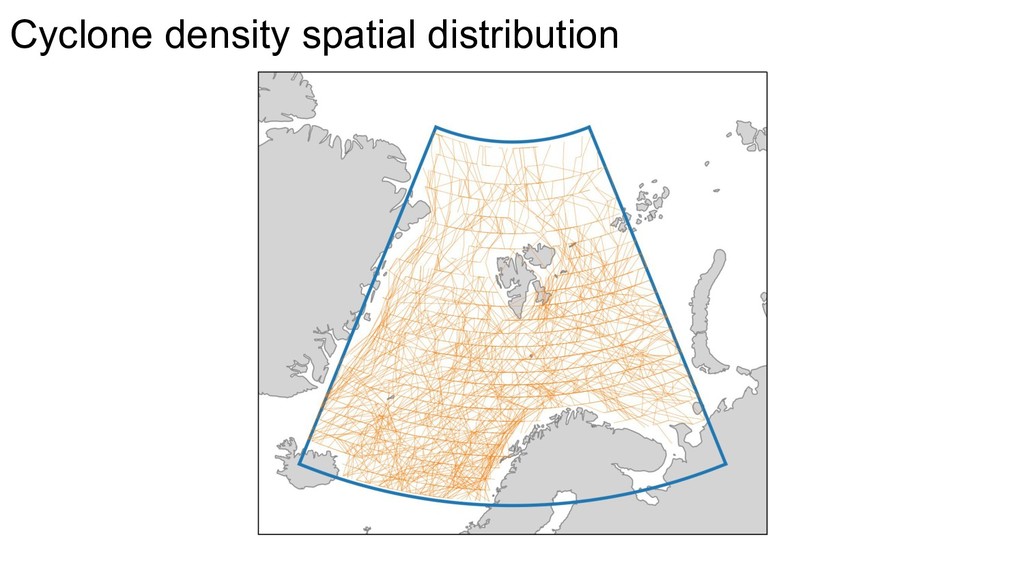
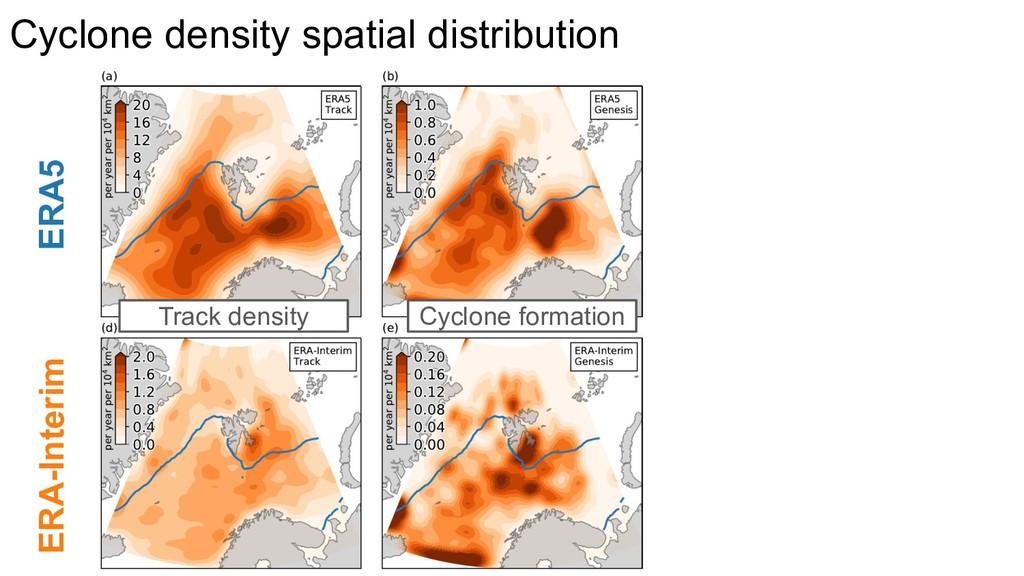
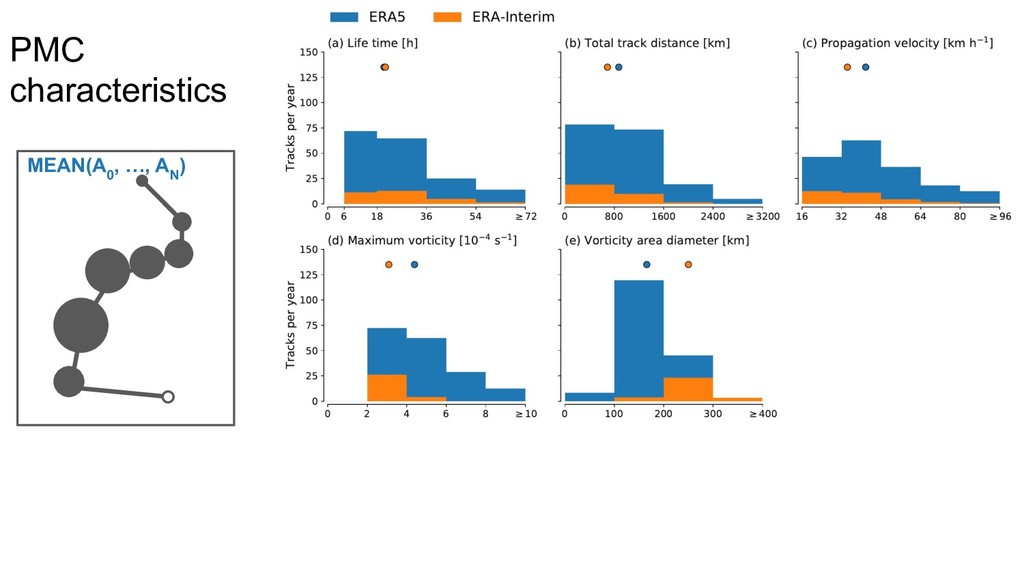
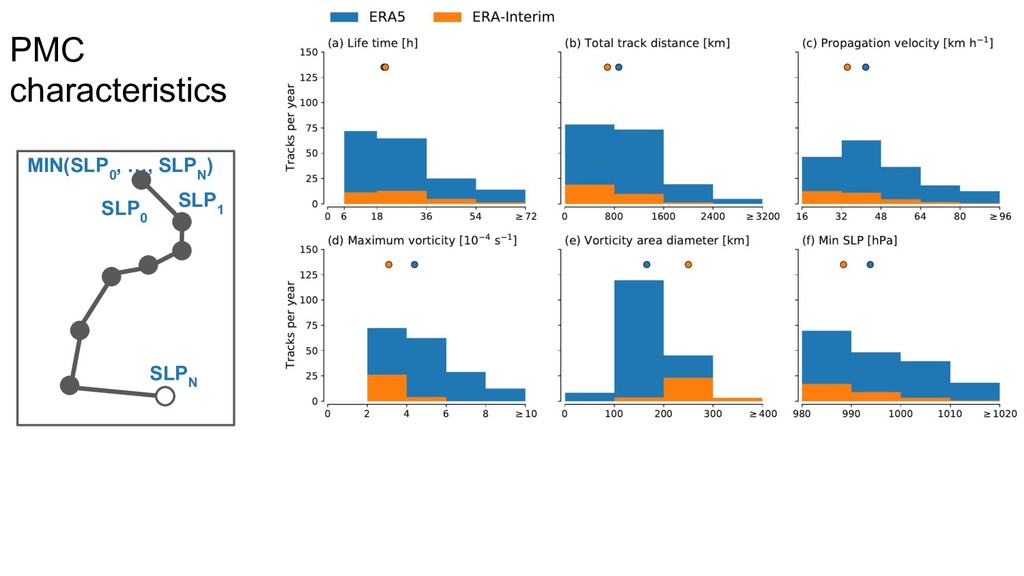
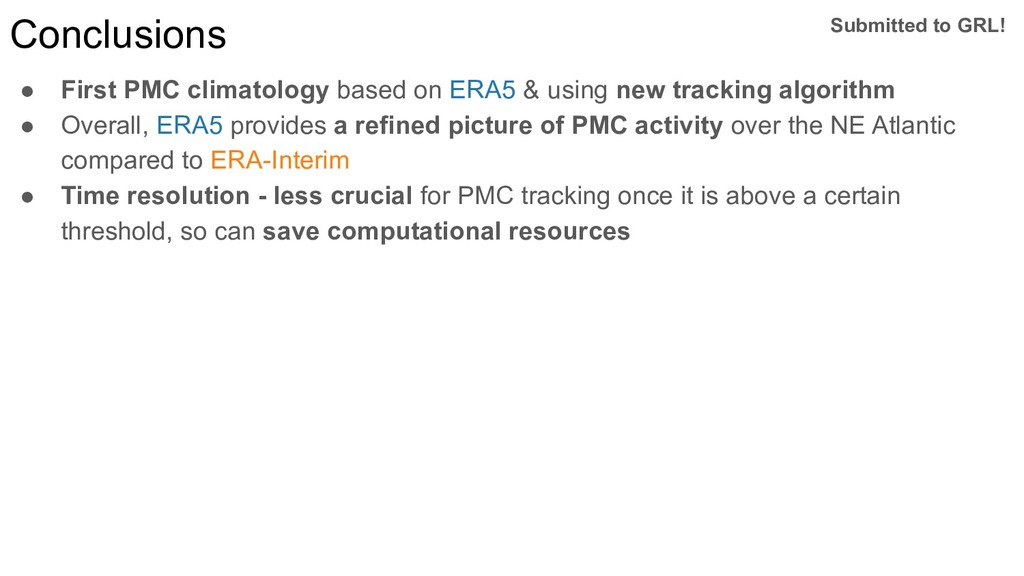
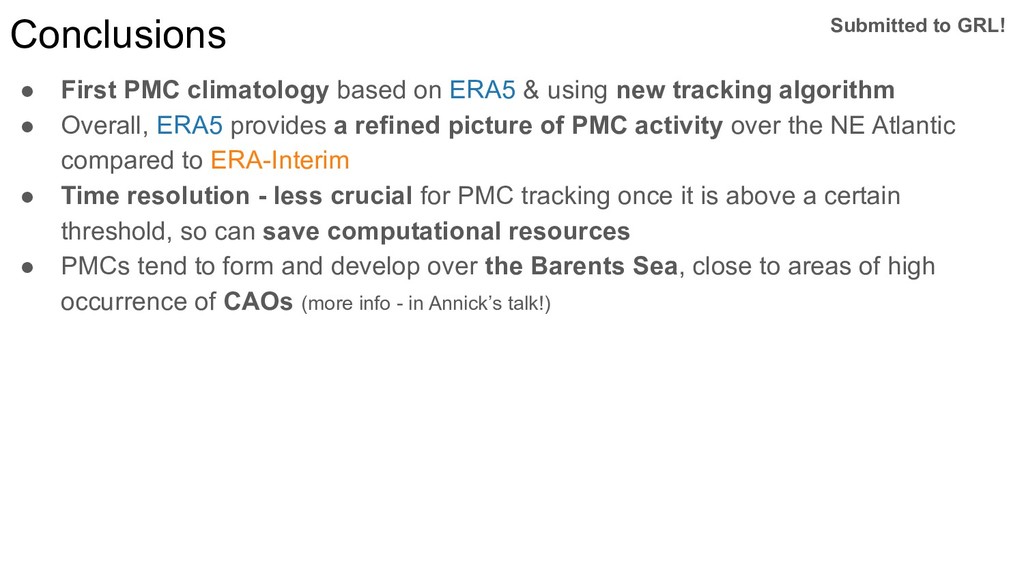
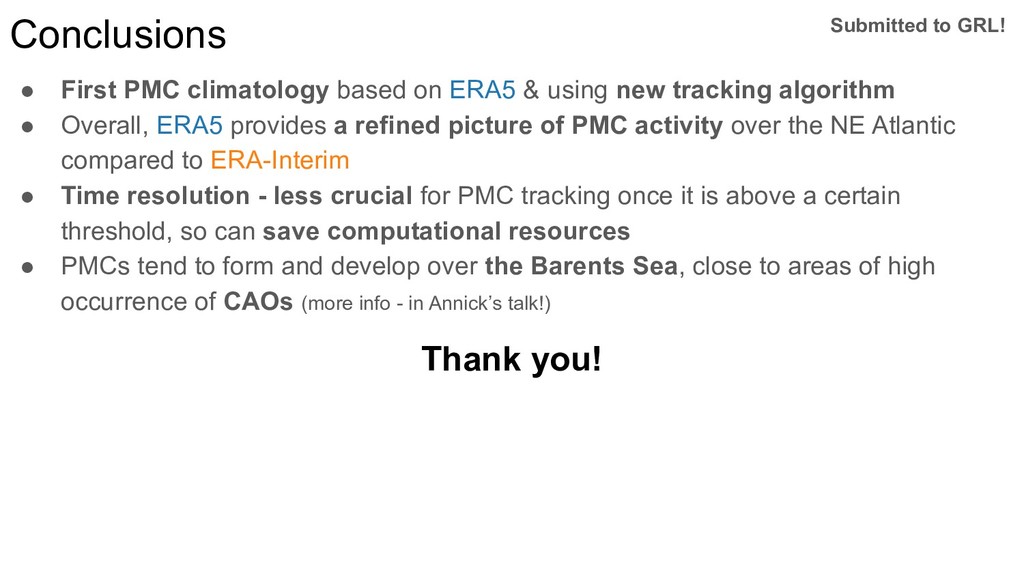
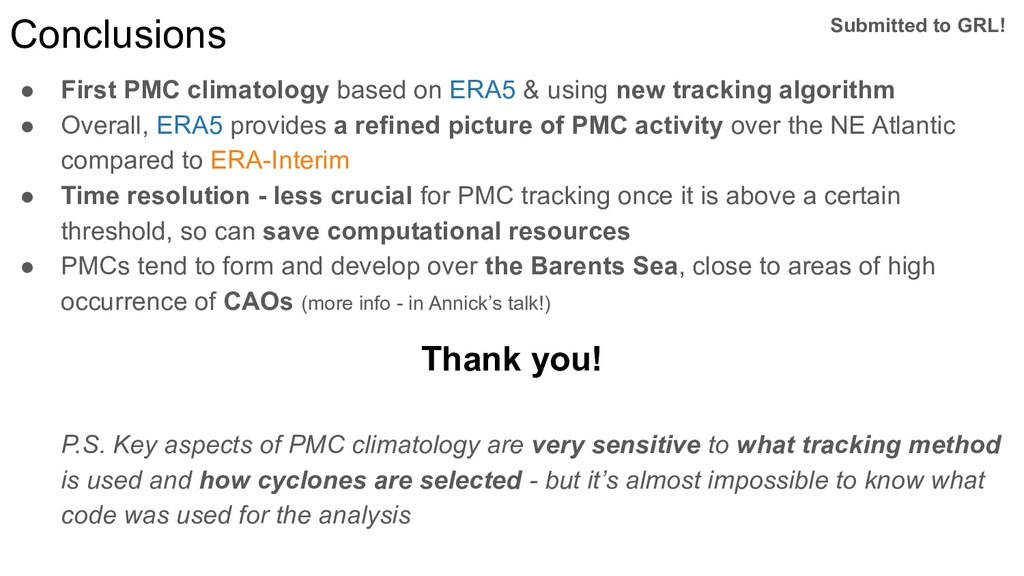
new tracking algorithm • Overall, ERA5 provides a refined picture of PMC activity over the NE Atlantic compared to ERA-Interim • Time resolution - less crucial for PMC tracking once it is above a certain threshold, so can save computational resources • PMCs tend to form and develop over the Barents Sea, close to areas of high occurrence of CAOs (more info - in Annick’s talk!) Submitted to GRL! P.S. Key aspects of PMC climatology are very sensitive to what tracking method is used and how cyclones are selected - but it’s almost impossible to know what code was used for the analysis Thank you!
![A typical wintertime PMC ERA5 ERA-Interim Frequency [PMC per week]](https://files.speakerdeck.com/presentations/5b9d5472c0c34d40a718dc63b3254fa3/slide_86.jpg)