Upgrade to Pro — share decks privately, control downloads, hide ads and more …

ObservabilityTalk.pdf

 ObservabilityTalk.pdf

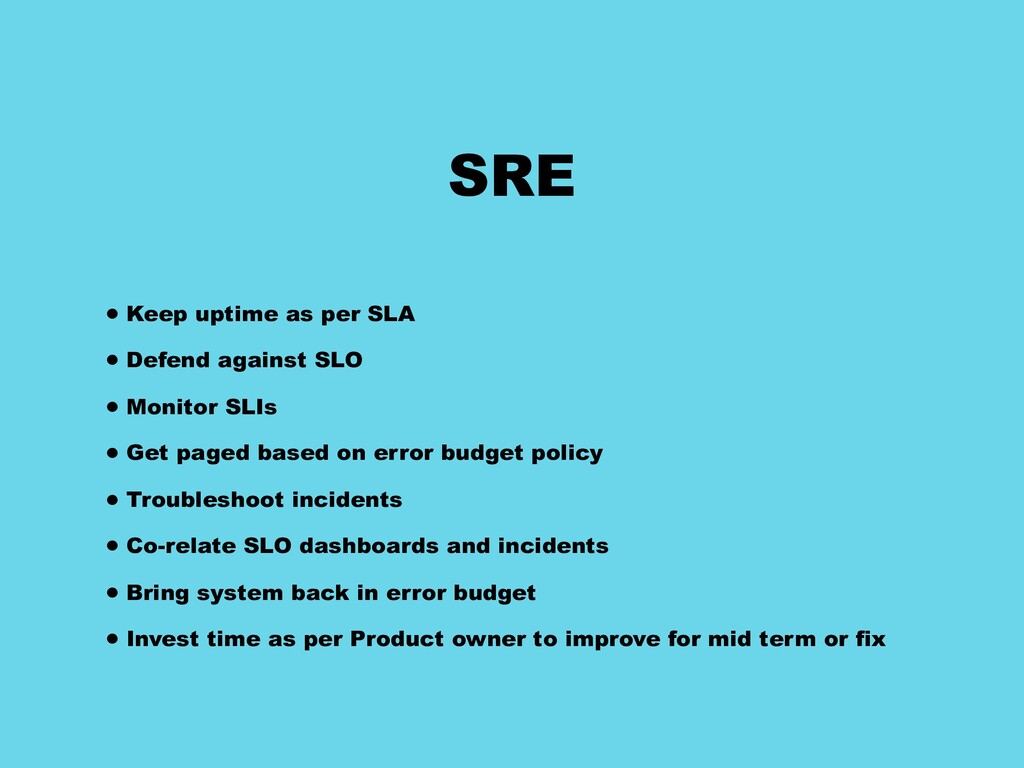
The Devops philosophy has revolutionised software engineering. What inspires me most is the SRE paradigm in Devops. What was popularised by Google in their SRE handbook has gone on to inspire several devops teams to follow patterns like Observability which is built in the public cloud revolution of the last 5 years. Multiple inspirations drawn from the SRE workbook written by Google and AWS whitepapers on operational excellence.

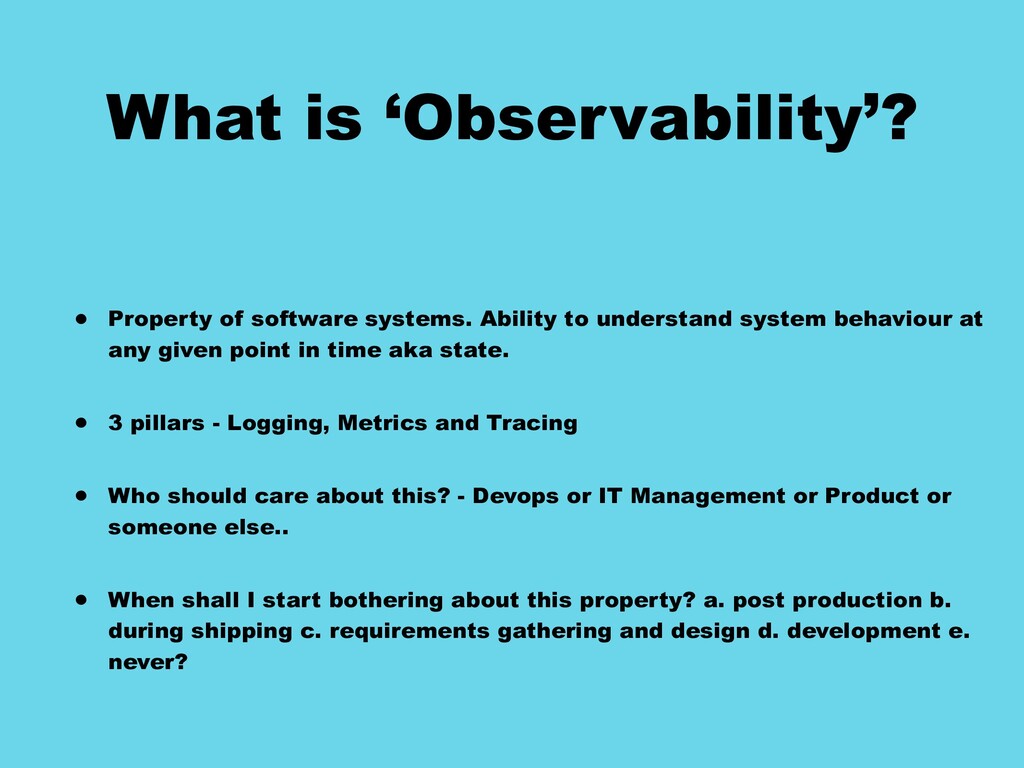
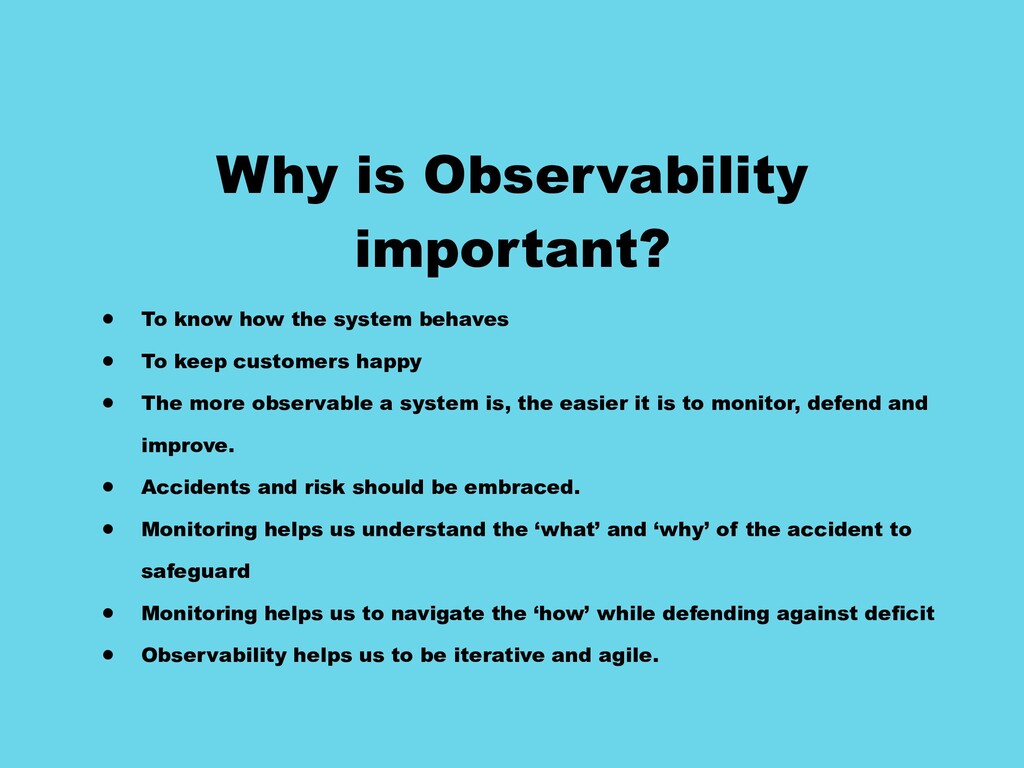
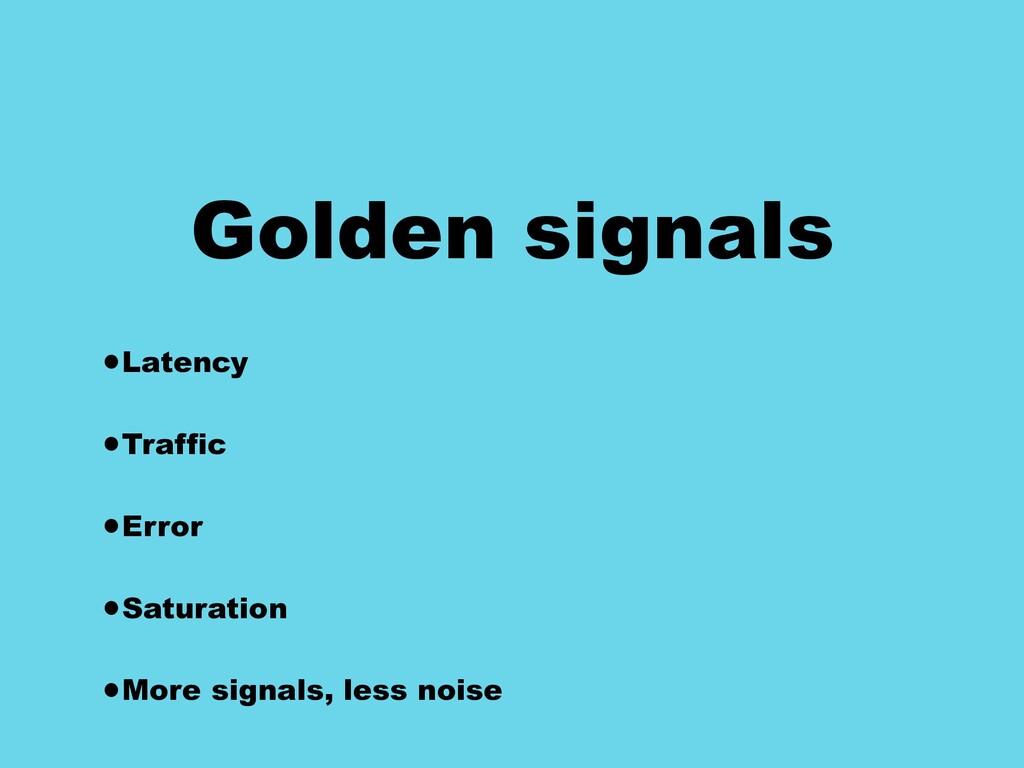
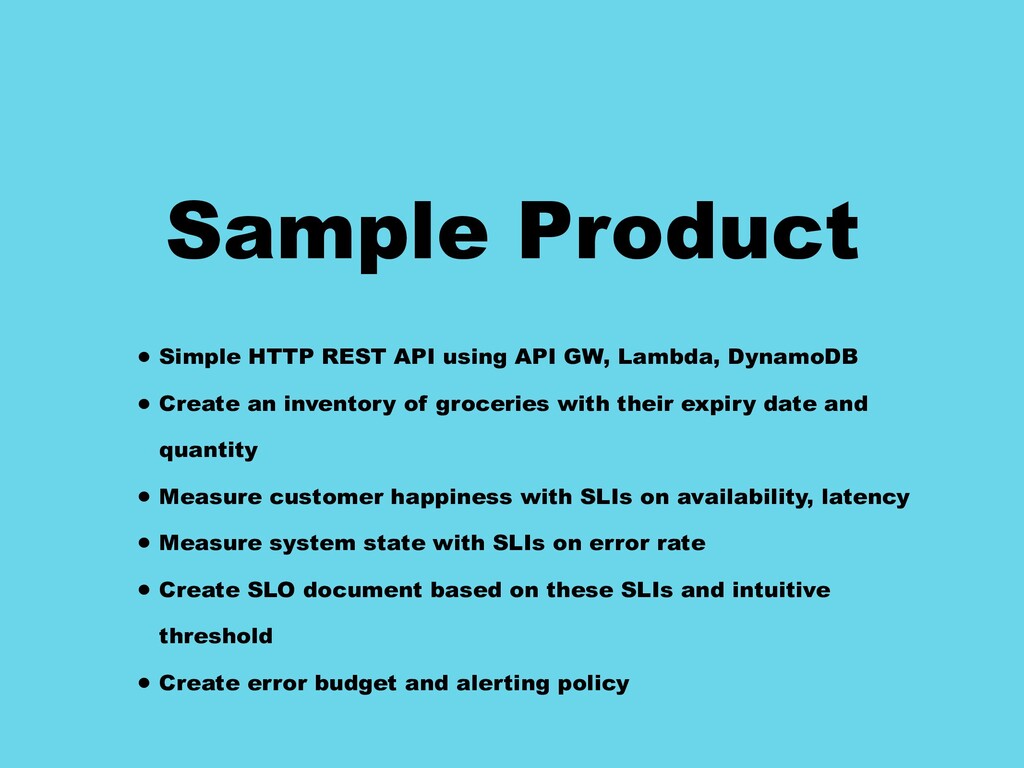
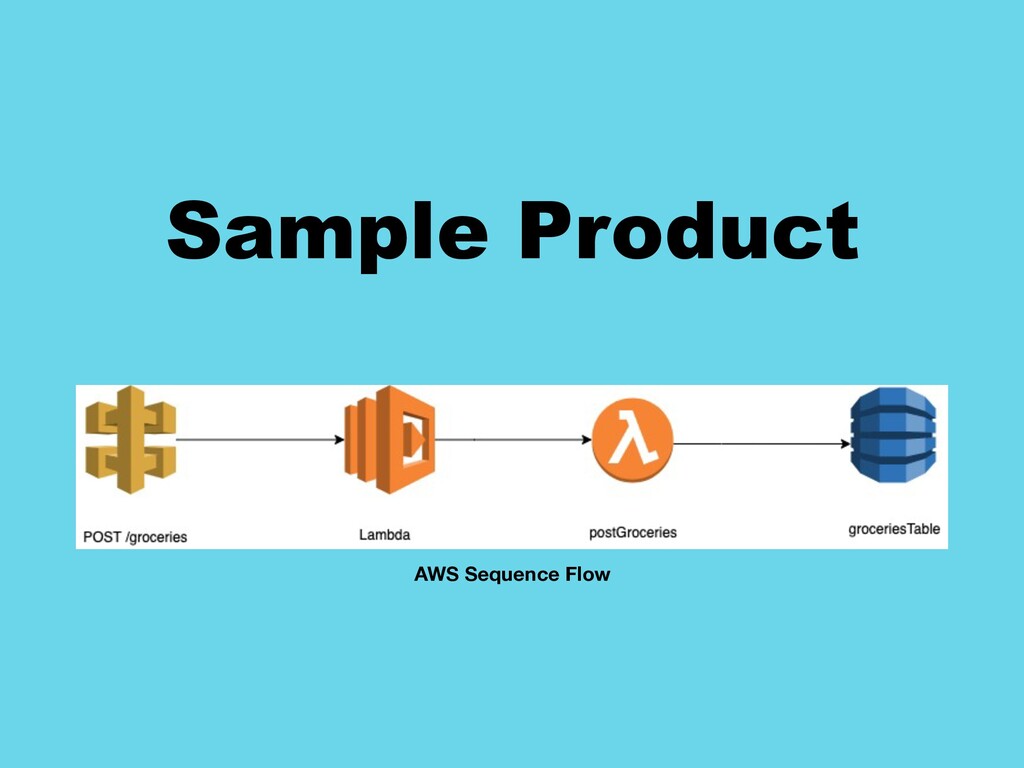
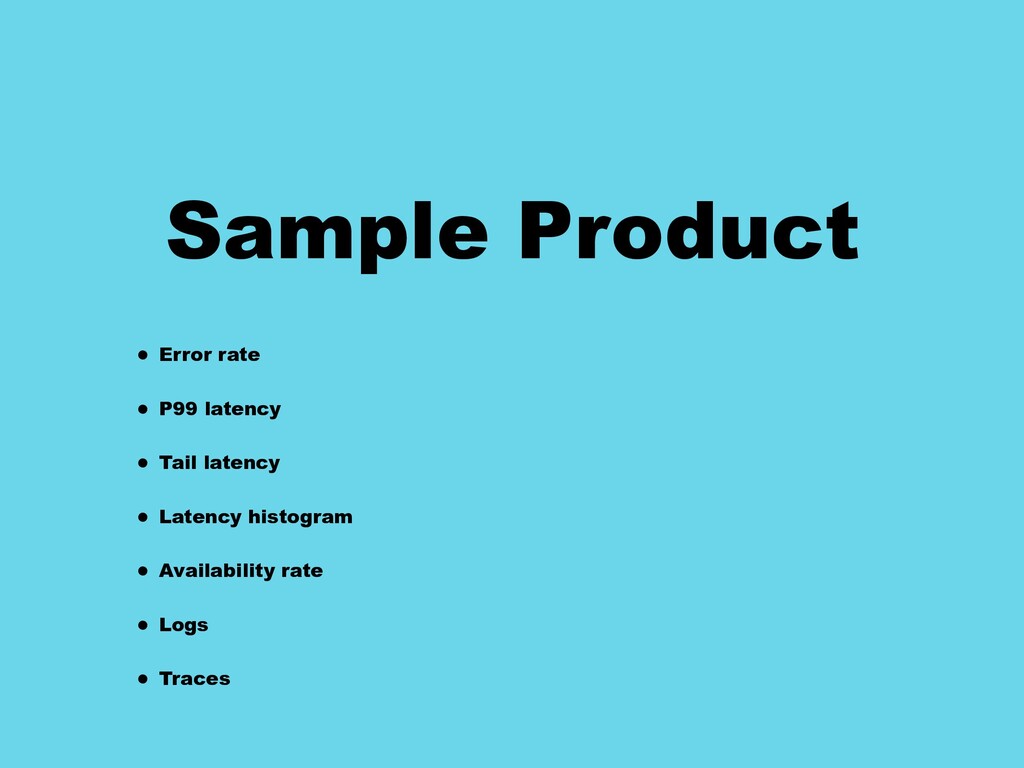
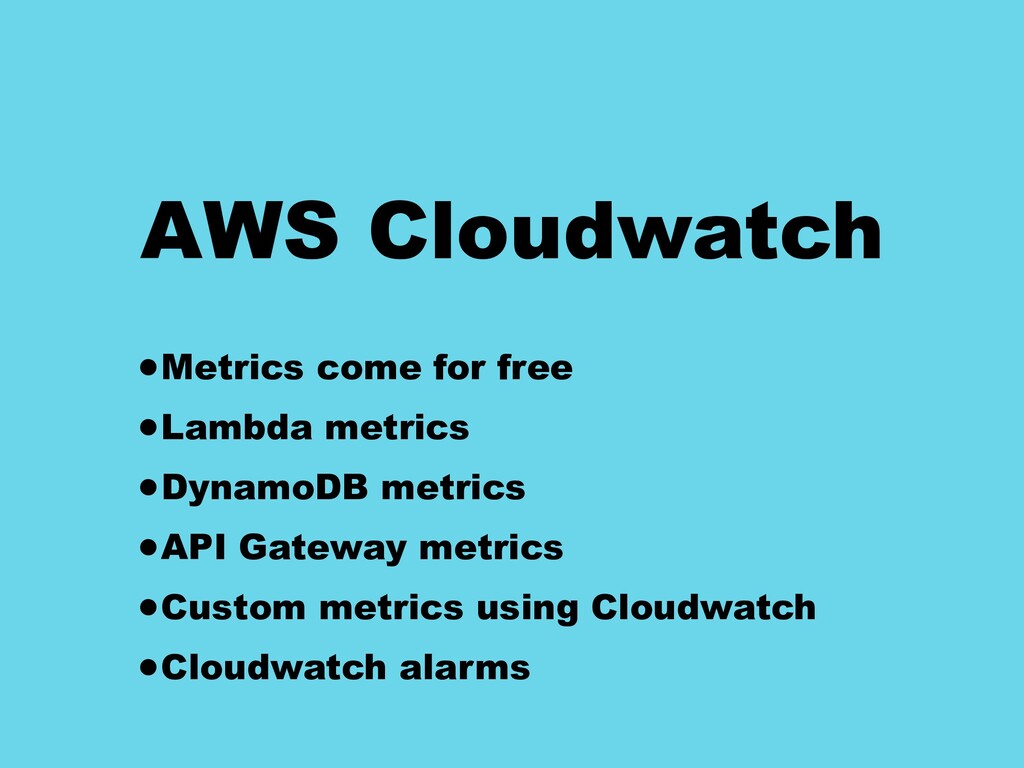
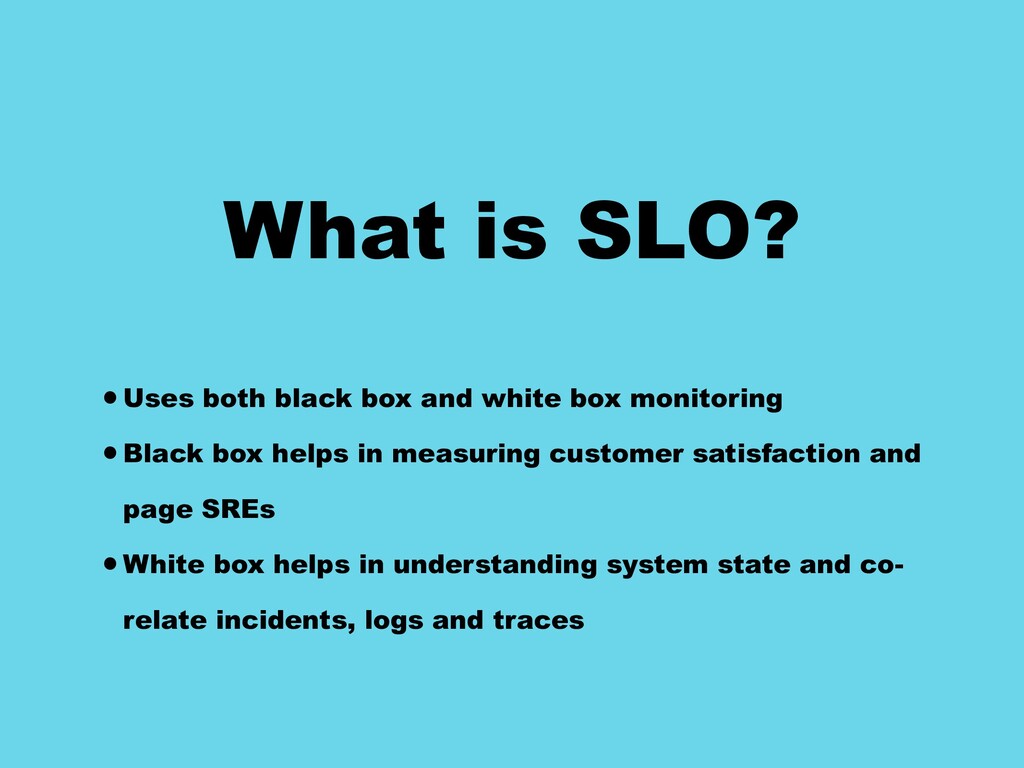
This talk introduces the audience to the role of Observability in Devops and SRE teams. It focuses most on metrics reporting. With the help of a sample serverless project hosted on AWS and examples of AWS Cloudwatch and AWS X-Ray, this talk will present both black box and white box monitoring and tracing. The demo will highlight the role of metrics and logs in the later phases of Observability - tracing, alerting and incident management.

Dipro Chatterjee

April 02, 2020
Tweet

Other Decks in Technology

Transcript

  1. Who, why and what (s)? • Who am I? •

    Why am I doing this talk? • Who may listen to this talk? • Why would you listen to this talk?
  2. Devops • One team responsible for both development and operational

    excellence • Planning operational responsibilities start with planning development design • Iterate over operational specifications and implementations just like development designs are improved upon in an agile
  3. SRE • Keep uptime as per SLA • Defend against

    SLO • Monitor SLIs • Get paged based on error budget policy • Troubleshoot incidents • Co-relate SLO dashboards and incidents • Bring system back in error budget • Invest time as per Product owner to improve for mid term or fix
  4. What is ‘Observability’? • Property of software systems. Ability to

    understand system behaviour at any given point in time aka state. • 3 pillars - Logging, Metrics and Tracing • Who should care about this? - Devops or IT Management or Product or someone else.. • When shall I start bothering about this property? a. post production b. during shipping c. requirements gathering and design d. development e. never?
  5. Why is Observability important? • To know how the system

    behaves • To keep customers happy • The more observable a system is, the easier it is to monitor, defend and improve. • Accidents and risk should be embraced. • Monitoring helps us understand the ‘what’ and ‘why’ of the accident to safeguard • Monitoring helps us to navigate the ‘how’ while defending against deficit • Observability helps us to be iterative and agile.
  6. References • The SRE book from Google - https://landing.google.com/sre/sre-book/toc/ index.html

    • The SRE workbook from Google - https://landing.google.com/sre/workbook/toc/ • The Operational excellence white paper from AWS - https:// wa.aws.amazon.com/wat.pillar.operationalExcellence.en.html
  7. Sample Product • Simple HTTP REST API using API GW,

    Lambda, DynamoDB • Create an inventory of groceries with their expiry date and quantity • Measure customer happiness with SLIs on availability, latency • Measure system state with SLIs on error rate • Create SLO document based on these SLIs and intuitive threshold • Create error budget and alerting policy
  8. Sample Product • Error rate • P99 latency • Tail

    latency • Latency histogram • Availability rate • Logs • Traces
  9. What is SLI? •Some SLIs •Availability - ratio of successful

    requests to total requests •Latency - latency graph or histogram •Latency - ratio of requests within threshold to total requests •Latency - p99 - latency of 99% of requests •Error rate - ratio of errors to total requests •Saturation - CPU utilisation or Memory management graphs
  10. Measuring SLIs •Mean, Sum, histogram, ratio, percentiles •Mean or average

    latency could suppress latency of tail requests •Success Ratio or availability does not say much about the error requests •Ratio of errors does not point to why those errors happened •Granularity of time matters in histograms. For e.g. latency over 100-300 ms, 300-900ms, 900ms and beyond •Granularity of time matters in time series graphs. For e.g. CPU utilisation over 30s vs 1min •Hierarchical metrics for distributed systems
  11. AWS Cloudwatch •Metrics come for free •Lambda metrics •DynamoDB metrics

    •API Gateway metrics •Custom metrics using Cloudwatch •Cloudwatch alarms
  12. What is SLO? •Uses both black box and white box

    monitoring •Black box helps in measuring customer satisfaction and page SREs •White box helps in understanding system state and co- relate incidents, logs and traces
  13. What is Error budget policy? •This error budget is decided

    by the Devops team with both SRE and development hats on and the Product owner •The stakeholders must agree on these alerts and frequency of alerts •Reasonable actions needed to defend error budget •Tradeoffs must be considered and error budget policy, revisited after every incident
  14. What is SLA? • Availability agreement with Customer • Financial

    compensation, if broken • Not the same as SLO • https://uptime.is/
  15. SRE Takeaways Protect your health Prevent SPAM Alerts Re-evaluate SLO

    document periodically Negotiate on-call agreement
  16. Product Owner Takeaways Think of opaque metrics to measure both

    internal and external customer satisfaction Decision matrix for incidents Protect devops team and product health Re-evaluate error budget periodically