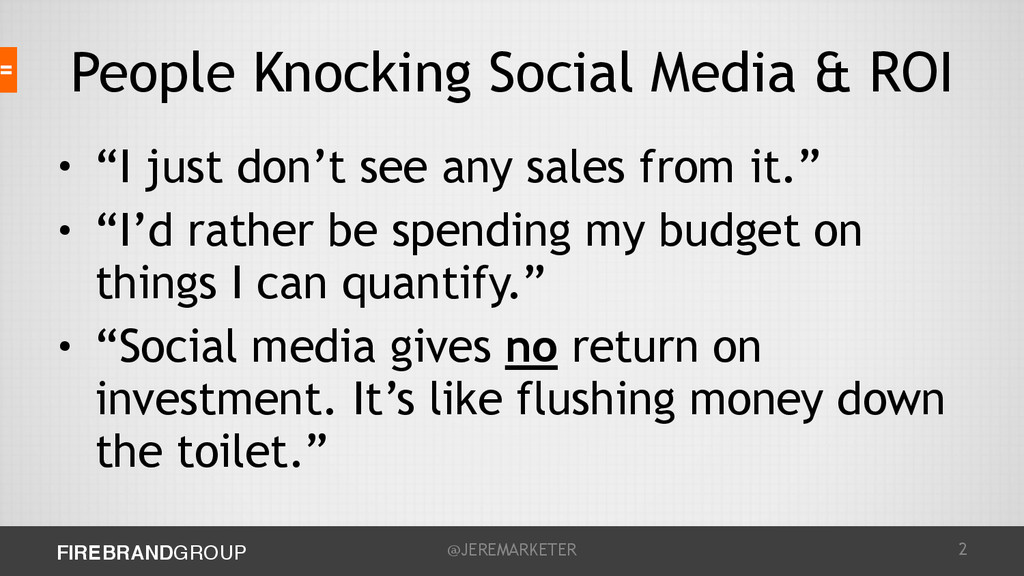
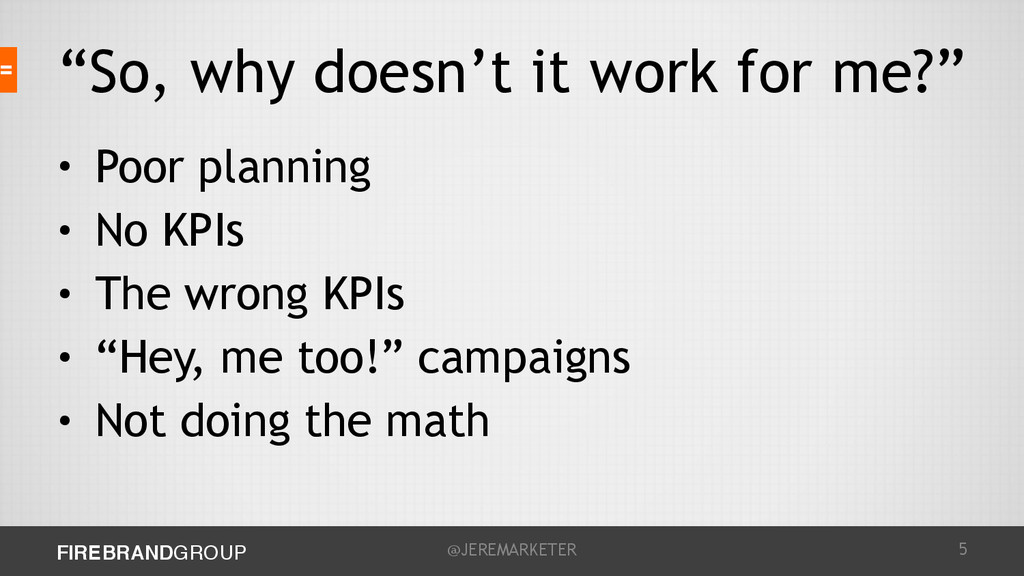
just don’t see any sales from it.” • “I’d rather be spending my budget on things I can quantify.” • “Social media gives no return on investment. It’s like flushing money down the toilet.” 2
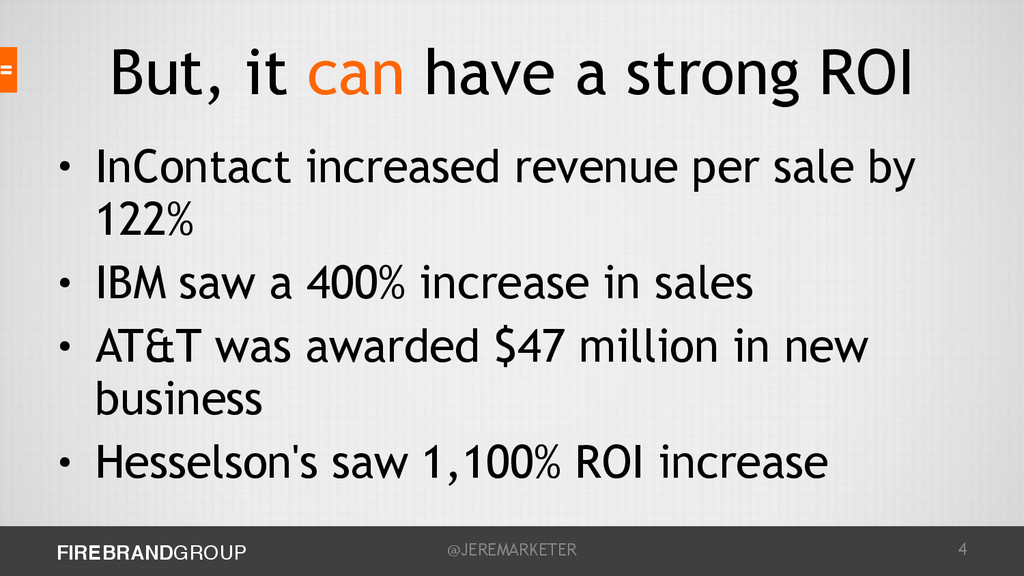
InContact increased revenue per sale by 122% • IBM saw a 400% increase in sales • AT&T was awarded $47 million in new business • Hesselson's saw 1,100% ROI increase 4
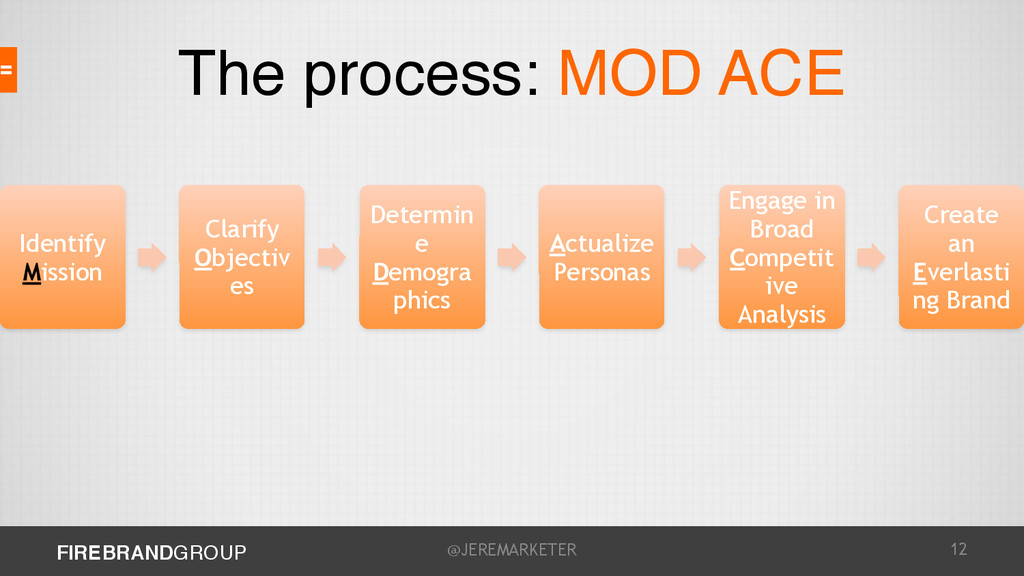
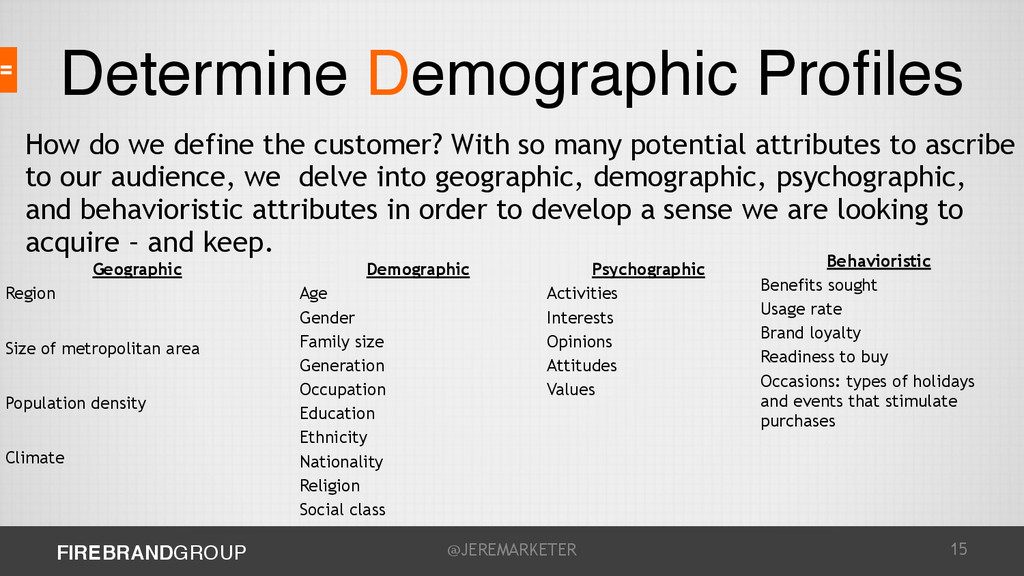
area Population density Climate Demographic Age Gender Family size Generation Occupation Education Ethnicity Nationality Religion Social class Psychographic Activities Interests Opinions Attitudes Values Behavioristic Benefits sought Usage rate Brand loyalty Readiness to buy Occasions: types of holidays and events that stimulate purchases How do we define the customer? With so many potential attributes to ascribe to our audience, we delve into geographic, demographic, psychographic, and behavioristic attributes in order to develop a sense we are looking to acquire – and keep. 15
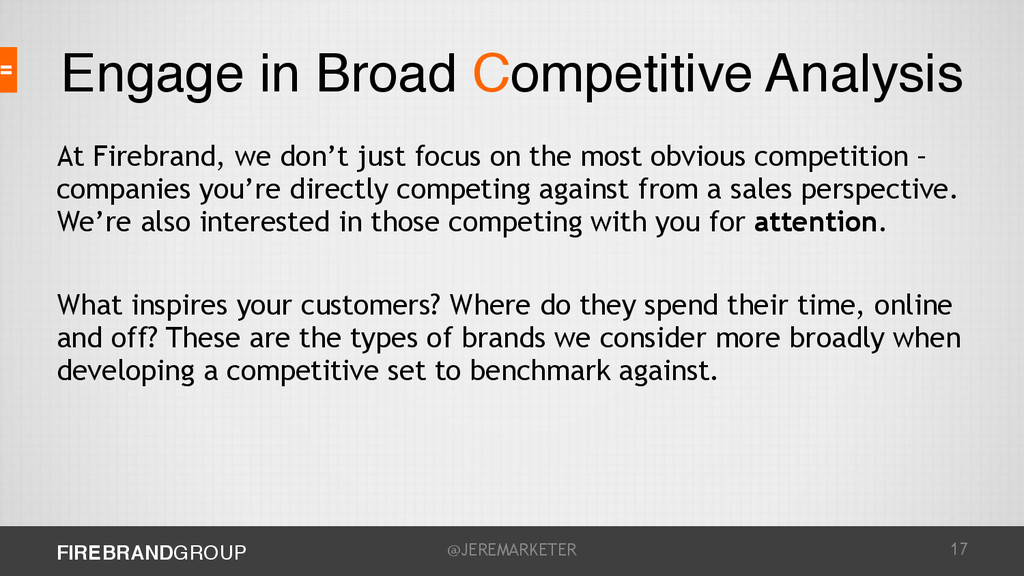
don’t just focus on the most obvious competition – companies you’re directly competing against from a sales perspective. We’re also interested in those competing with you for attention. What inspires your customers? Where do they spend their time, online and off? These are the types of brands we consider more broadly when developing a competitive set to benchmark against. 17
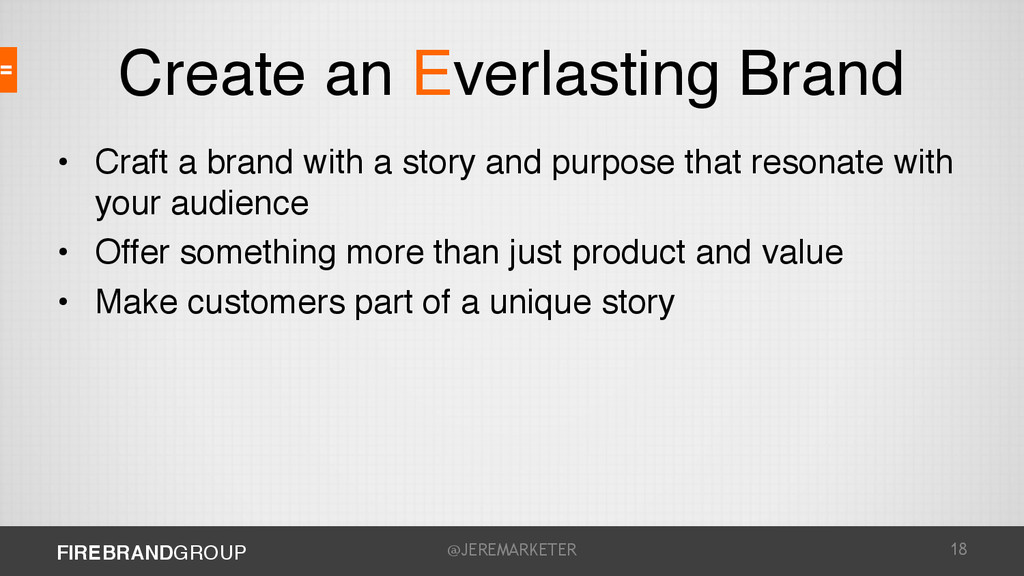
with a story and purpose that resonate with your audience • Offer something more than just product and value • Make customers part of a unique story 18
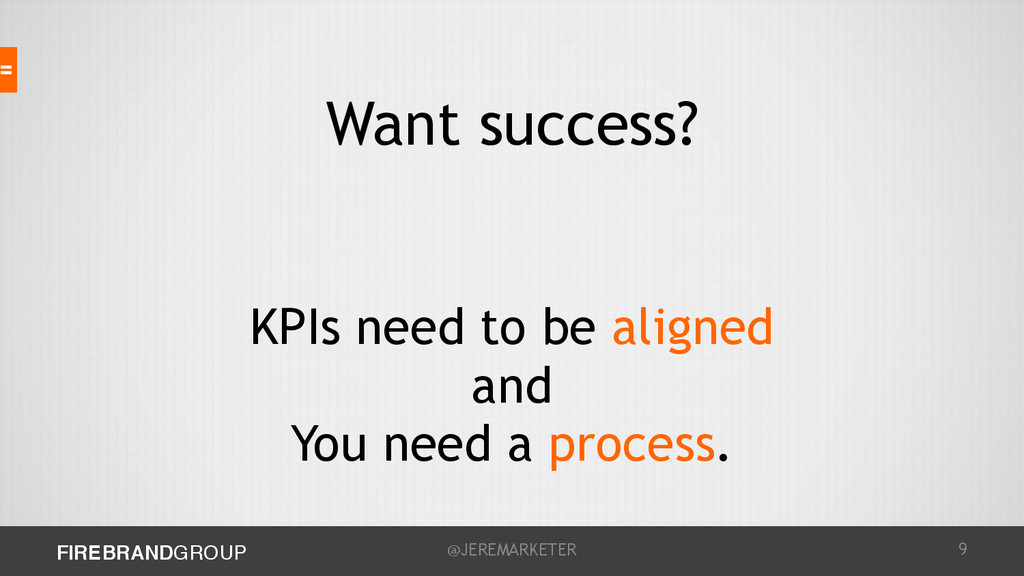
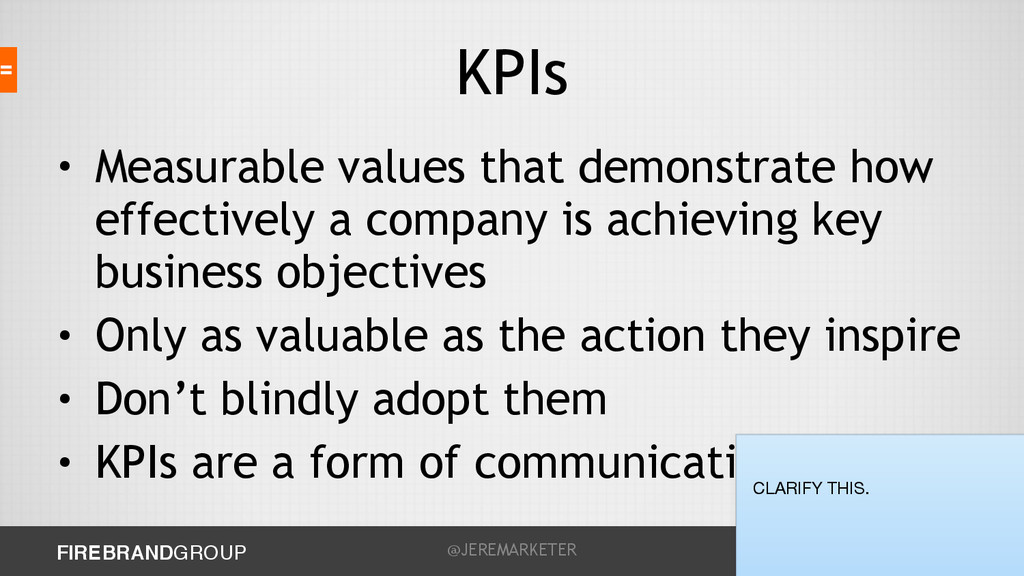
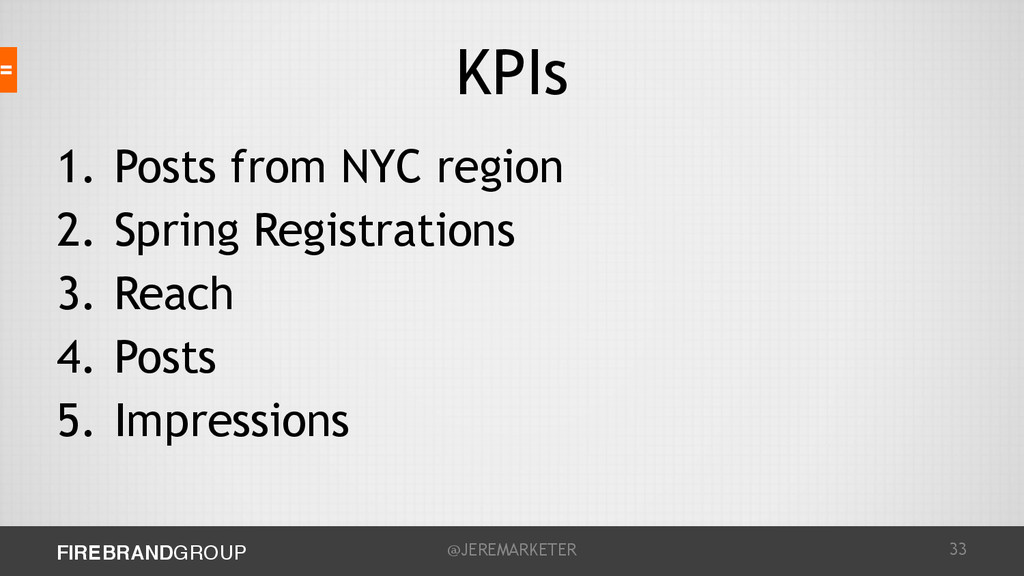
a company is achieving key business objectives • Only as valuable as the action they inspire • Don’t blindly adopt them • KPIs are a form of communication 20 CLARIFY THIS.
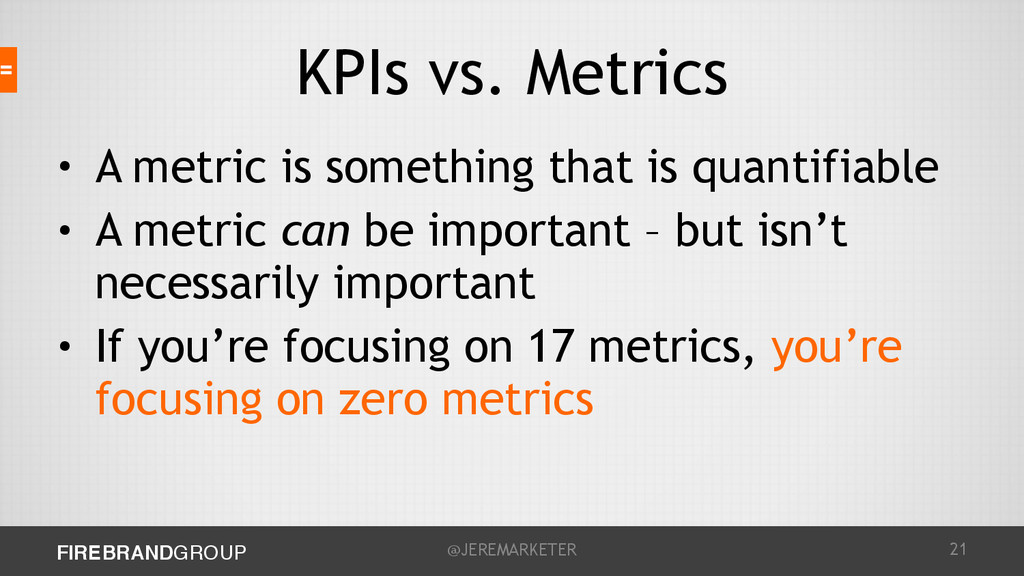
that is quantifiable • A metric can be important – but isn’t necessarily important • If you’re focusing on 17 metrics, you’re focusing on zero metrics 21
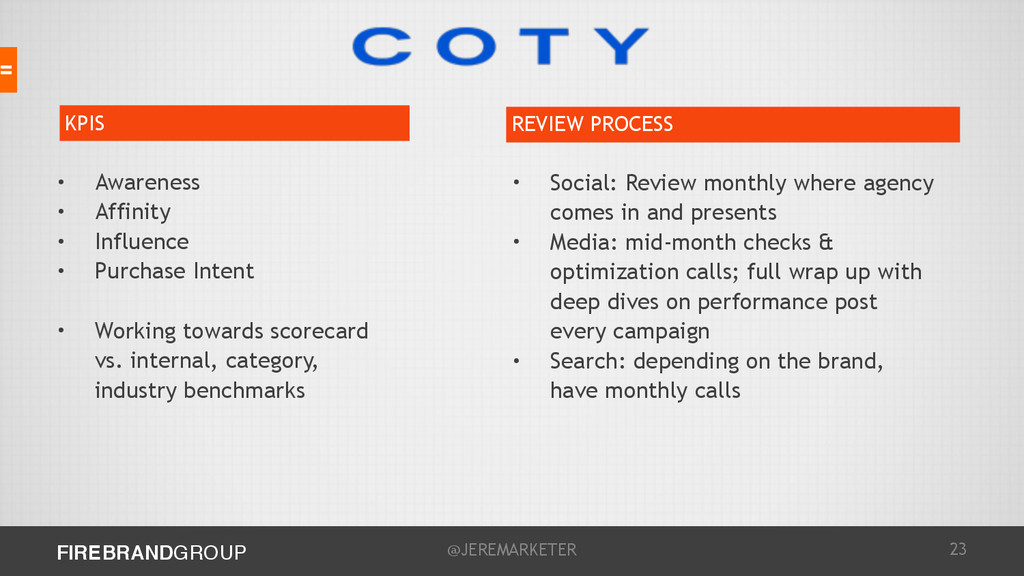
Purchase Intent • Working towards scorecard vs. internal, category, industry benchmarks KPIS REVIEW PROCESS • Social: Review monthly where agency comes in and presents • Media: mid-month checks & optimization calls; full wrap up with deep dives on performance post every campaign • Search: depending on the brand, have monthly calls
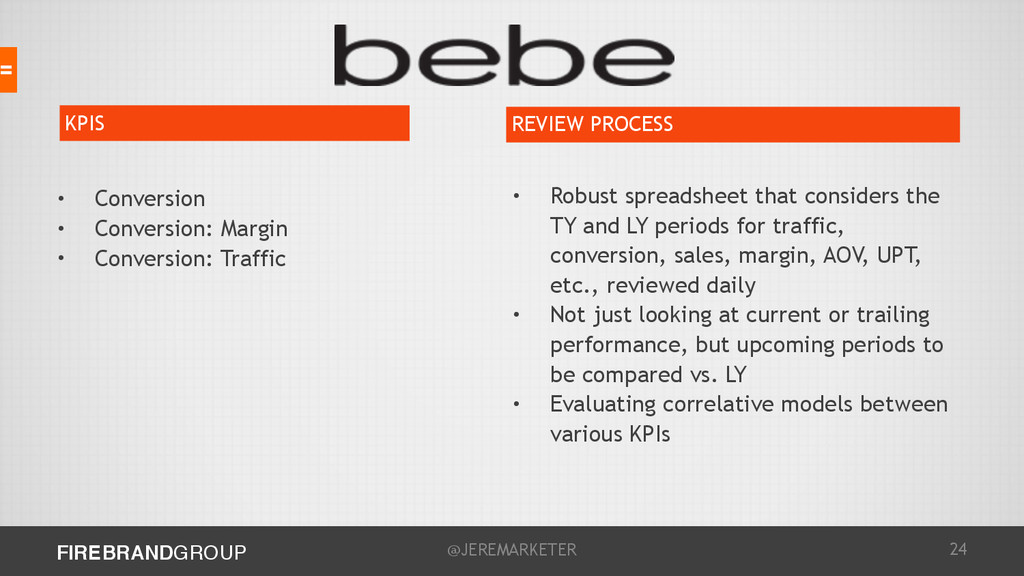
Traffic • Robust spreadsheet that considers the TY and LY periods for traffic, conversion, sales, margin, AOV, UPT, etc., reviewed daily • Not just looking at current or trailing performance, but upcoming periods to be compared vs. LY • Evaluating correlative models between various KPIs KPIS REVIEW PROCESS
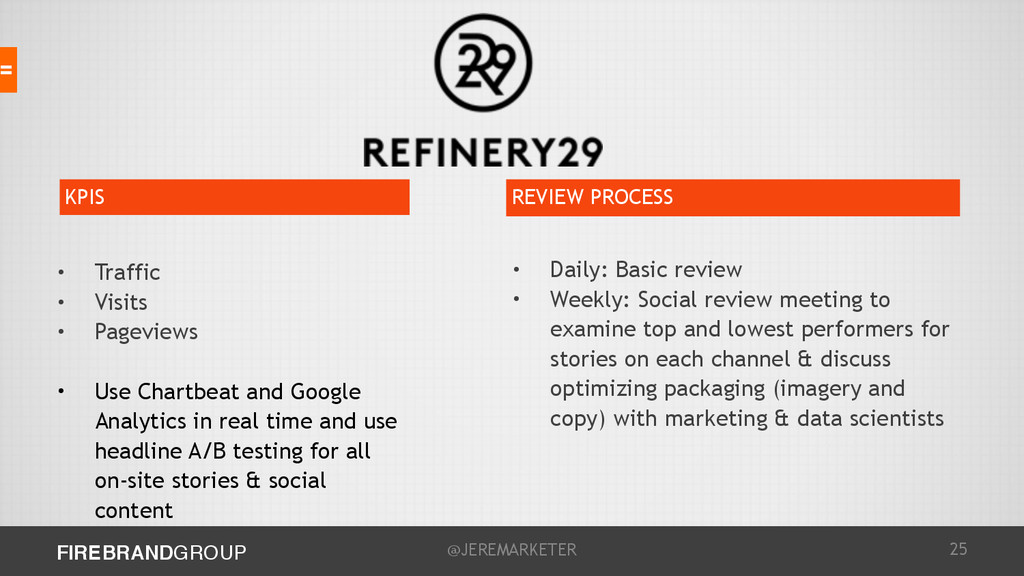
Use Chartbeat and Google Analytics in real time and use headline A/B testing for all on-site stories & social content • Daily: Basic review • Weekly: Social review meeting to examine top and lowest performers for stories on each channel & discuss optimizing packaging (imagery and copy) with marketing & data scientists KPIS REVIEW PROCESS
Time Spent • Daily • Use a custom built dashboard to track these KPIs by user type & country globally across audience of 1B+ people. KPIS REVIEW PROCESS
# of Orders • Conversion Rate • AOV • Daily • No formal process, but have daily tracker with transacted sales, visitor, order, etc information into and the conversion rate & AOV updates automatically • Dig into analytics accordingly depending on where they see dips or spikes vs plan KPIS REVIEW PROCESS
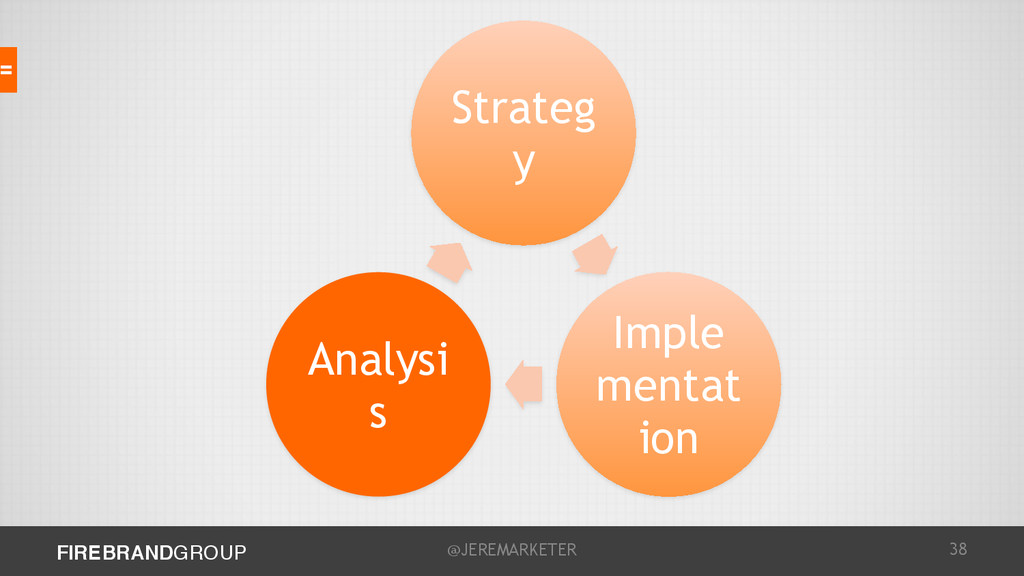
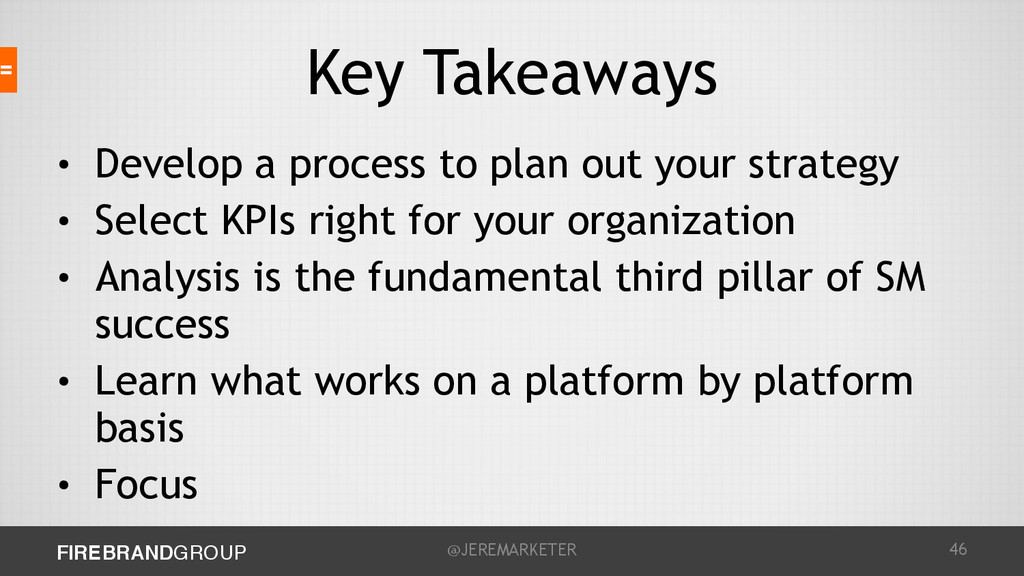
out your strategy • Select KPIs right for your organization • Analysis is the fundamental third pillar of SM success • Learn what works on a platform by platform basis • Focus 46


 distilled
 mrmtsu
 nakanao
 yohyamasaki
 sanghyuk
 snowwmn0824
 kentapapa
 ryotarai
 sansantech
 yutakaosada
 tomokusaba
 ishiirikie
 rabernat
 frankvandijk
 danielanewman
 jct
jct
 thirion
 mfonobong
 rocio
rocio
 badams
 lara
lara
 mkilby
 hatefulcrawdad
 tammyeverts