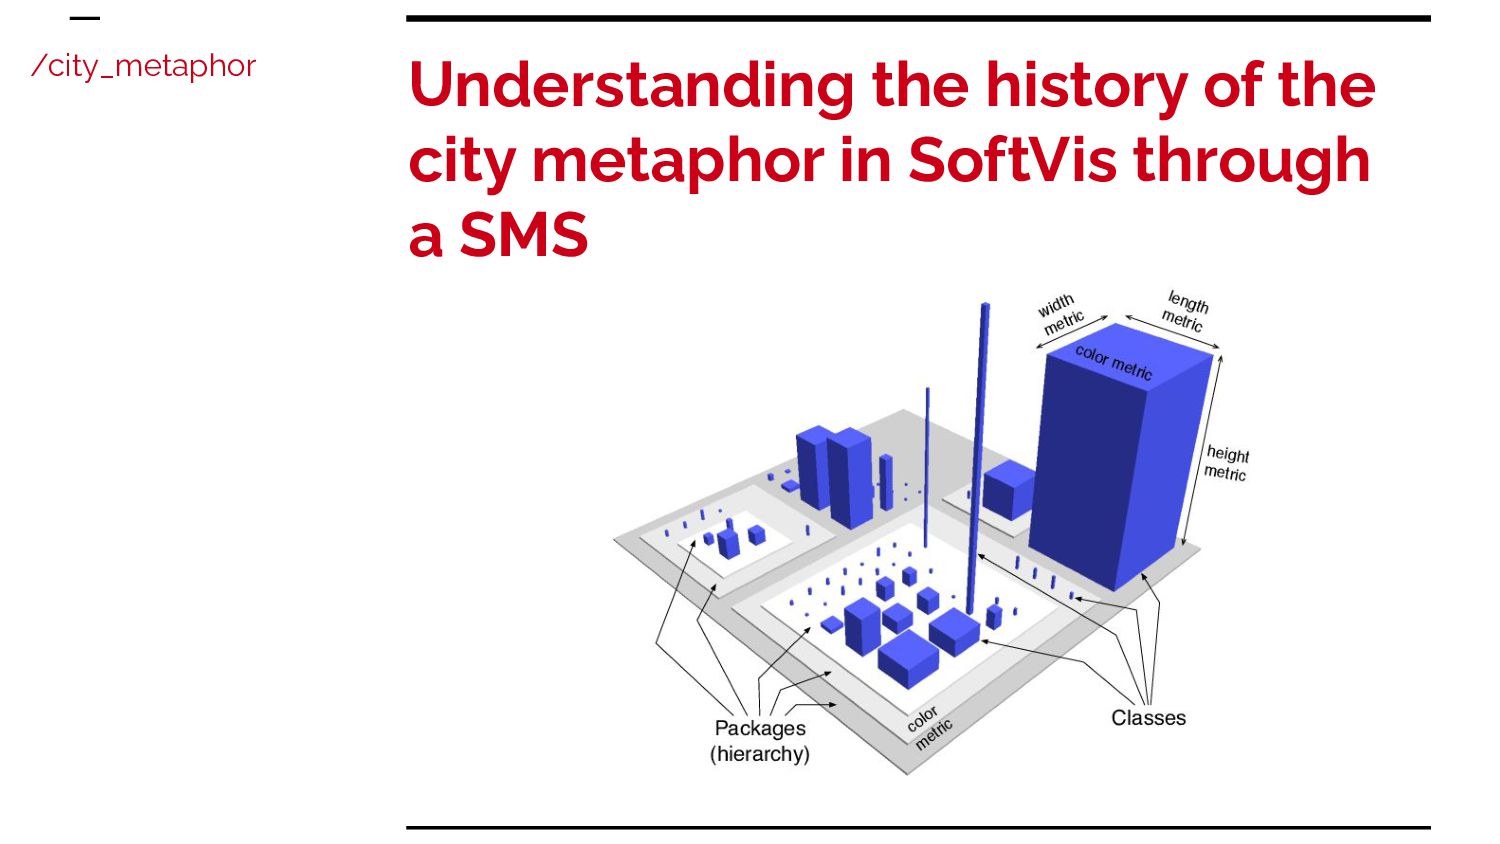
on the use of the city metaphor. Create a platform for web-based data visualizations in the XR environment. Development of a web-based version of the city metaphor visualization. Conduct empirical studies for validating BabiaXR-visualizations. Enhance the city metaphor visualization. /goals
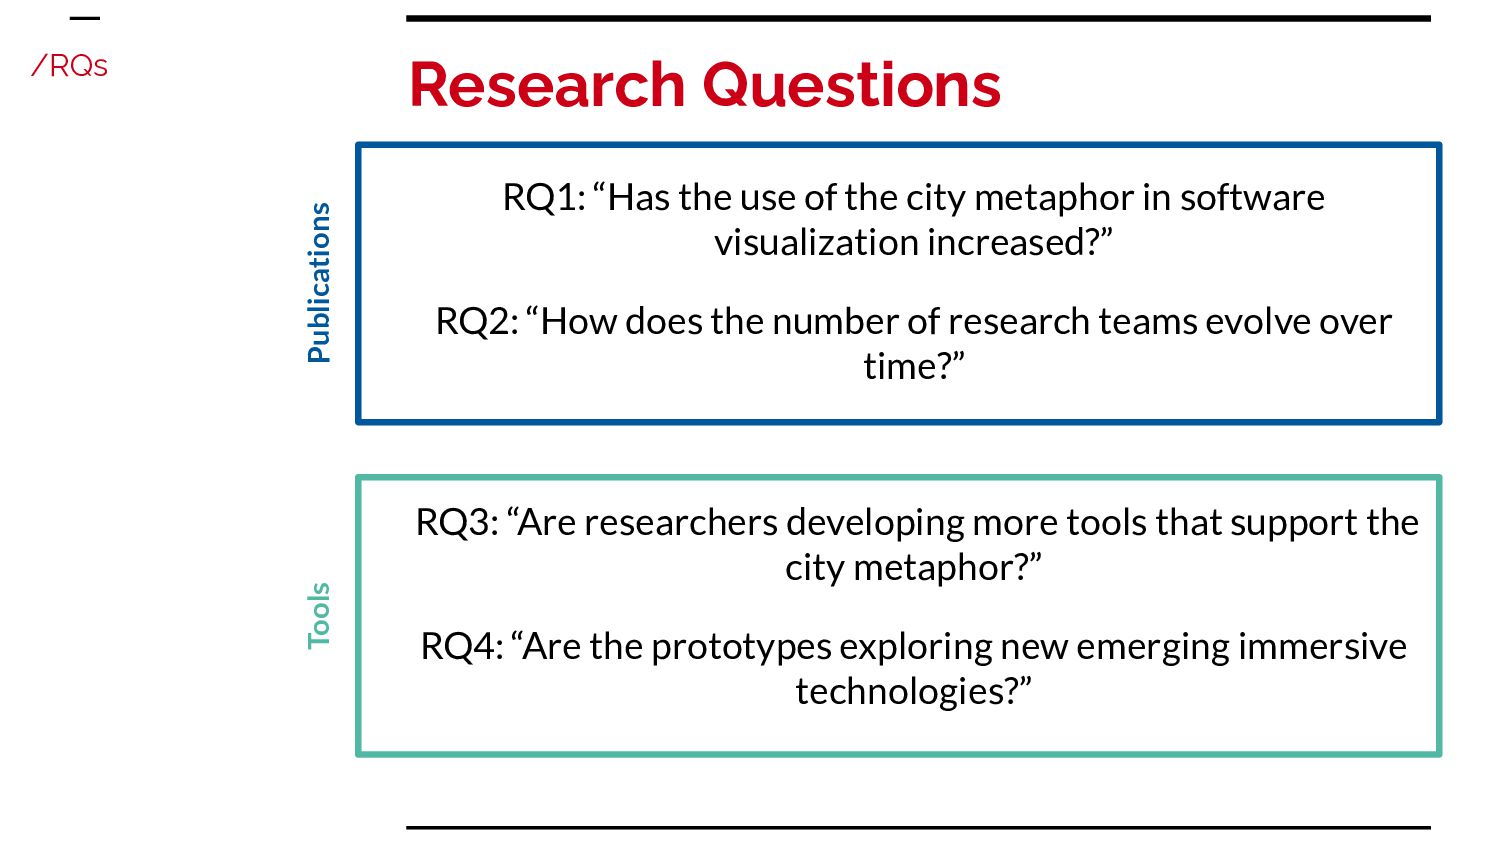
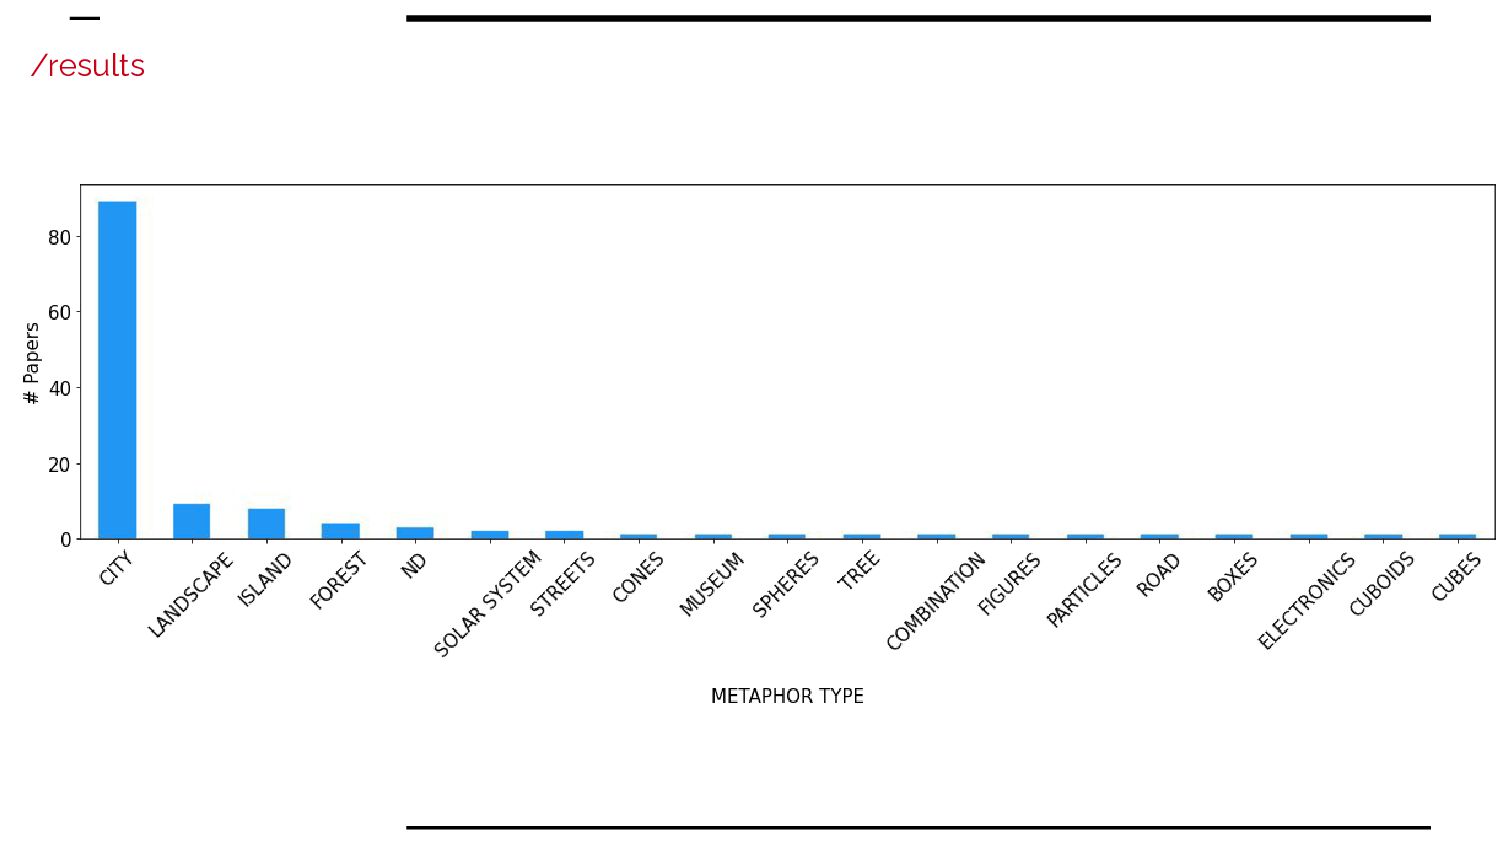
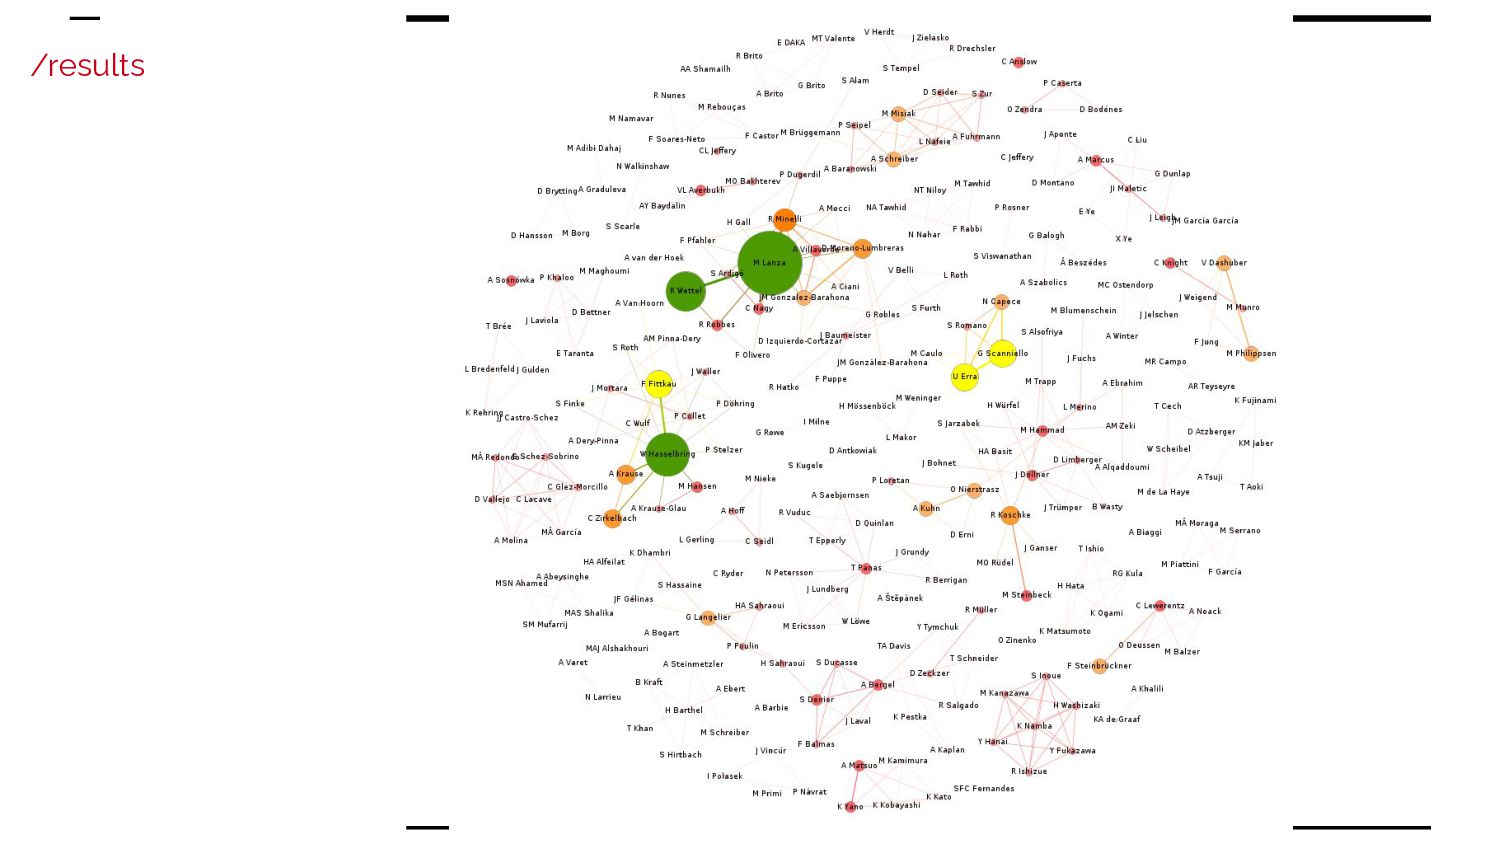
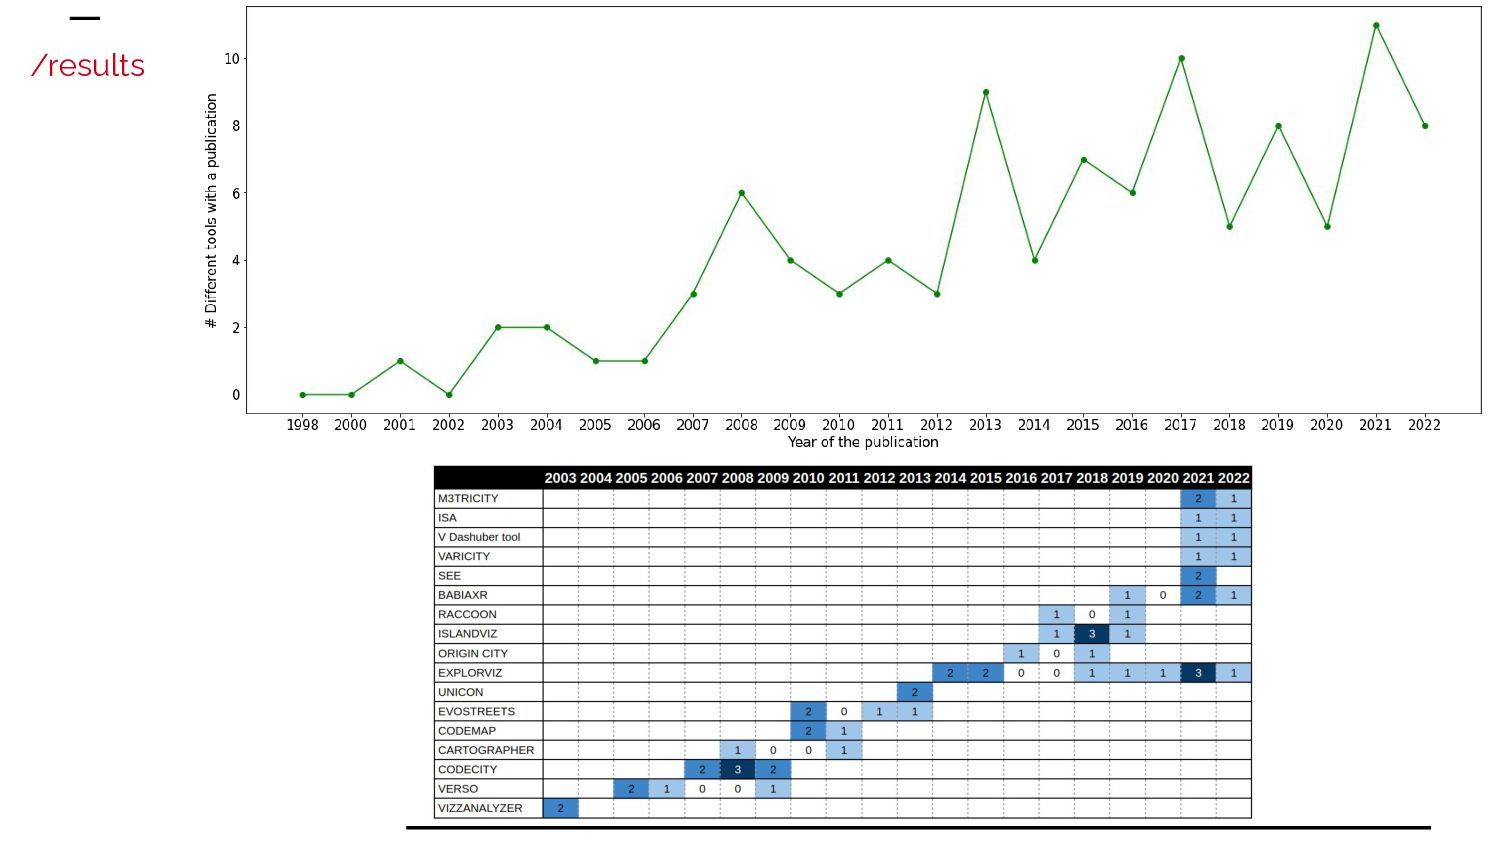
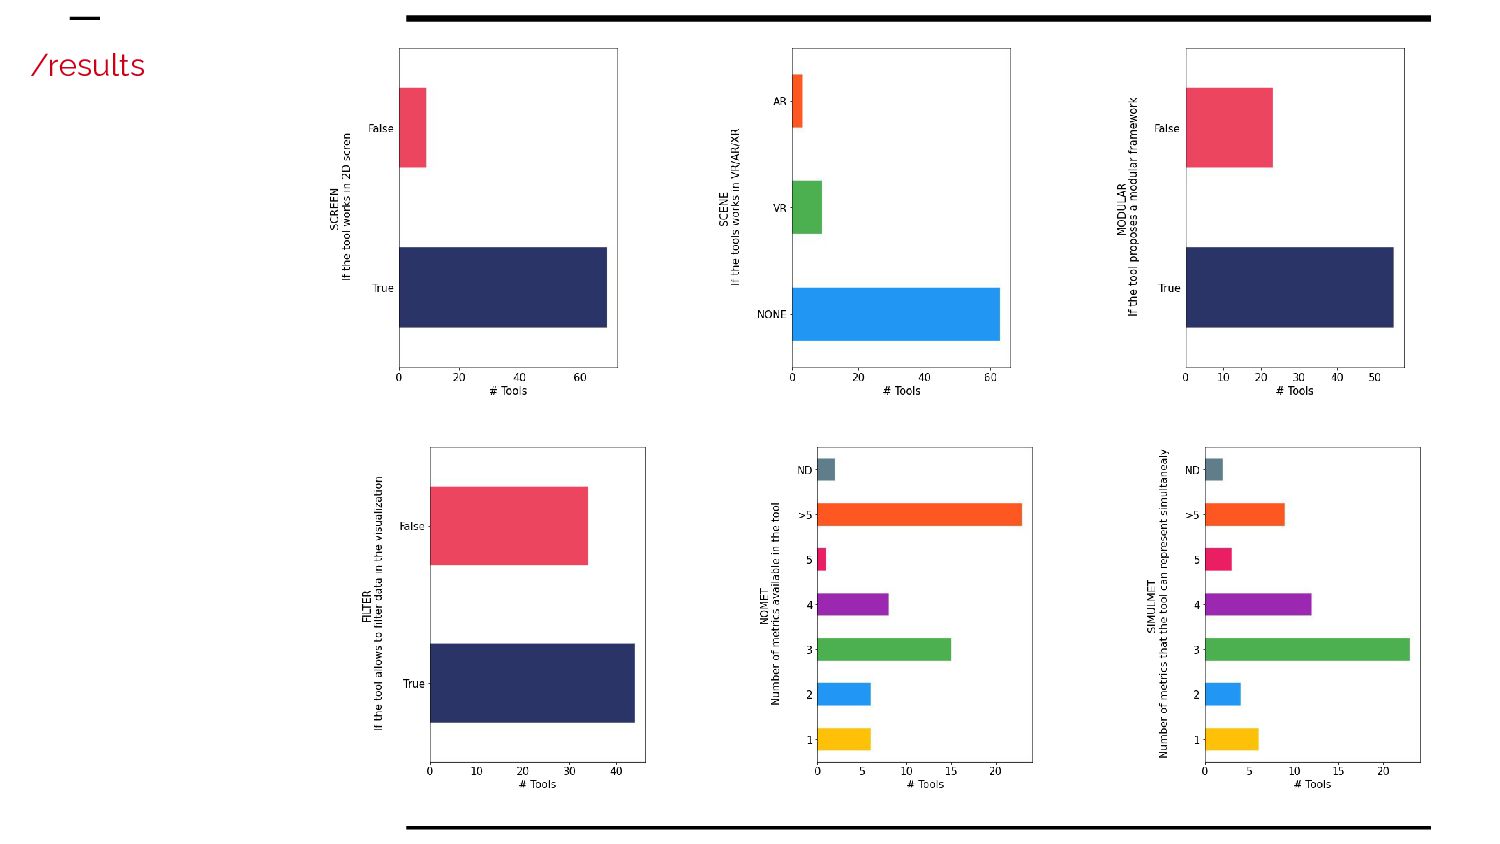
in software visualization increased?” RQ2: “How does the number of research teams evolve over time?” RQ3: “Are researchers developing more tools that support the city metaphor?” RQ4: “Are the prototypes exploring new emerging immersive technologies?” /RQs Publications Tools
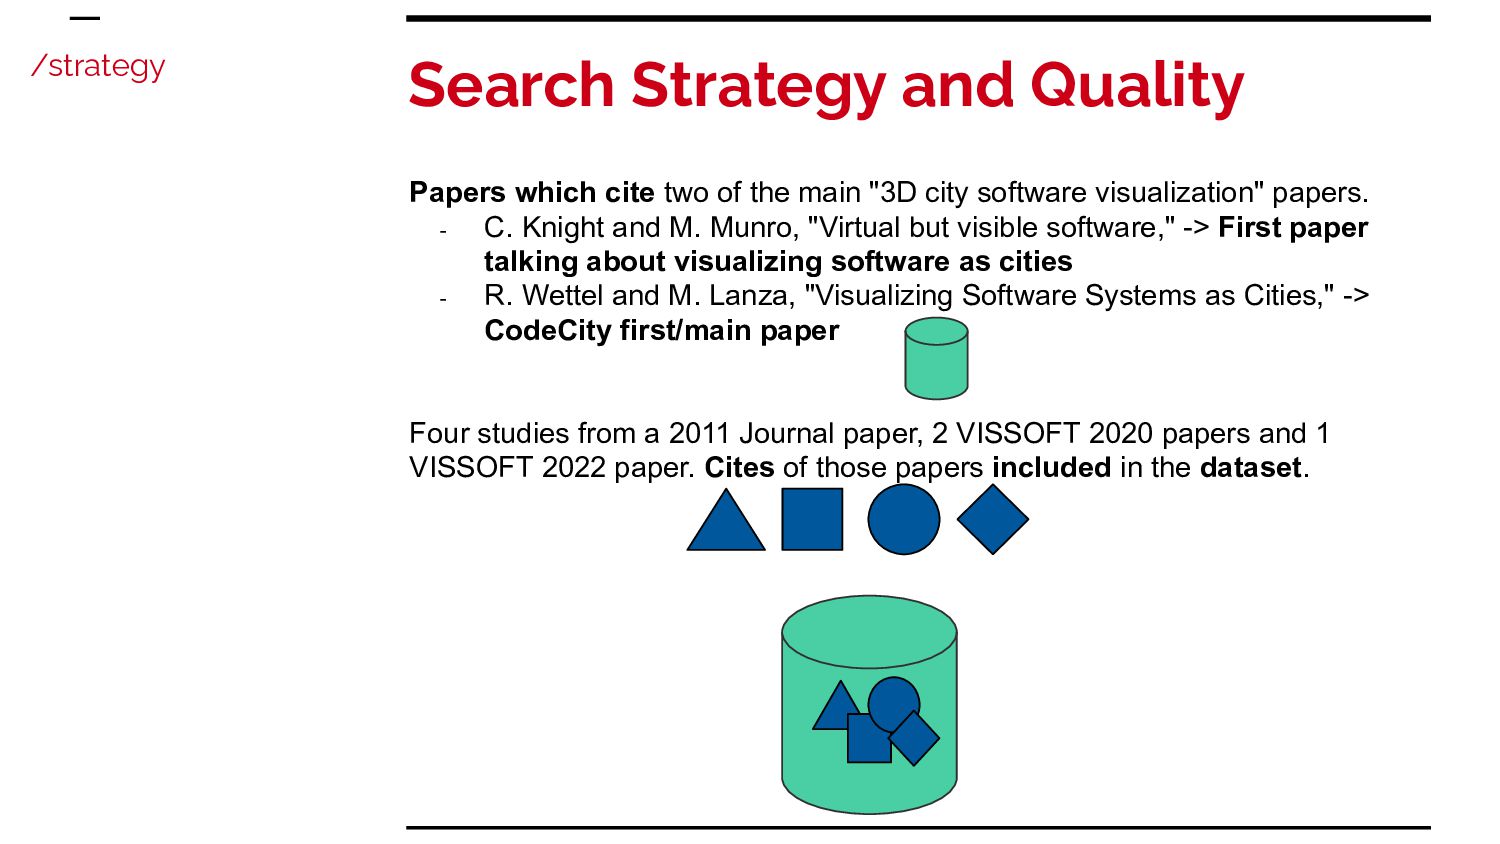
main "3D city software visualization" papers. - C. Knight and M. Munro, "Virtual but visible software," -> First paper talking about visualizing software as cities - R. Wettel and M. Lanza, "Visualizing Software Systems as Cities," -> CodeCity first/main paper Four studies from a 2011 Journal paper, 2 VISSOFT 2020 papers and 1 VISSOFT 2022 paper. Cites of those papers included in the dataset. /strategy
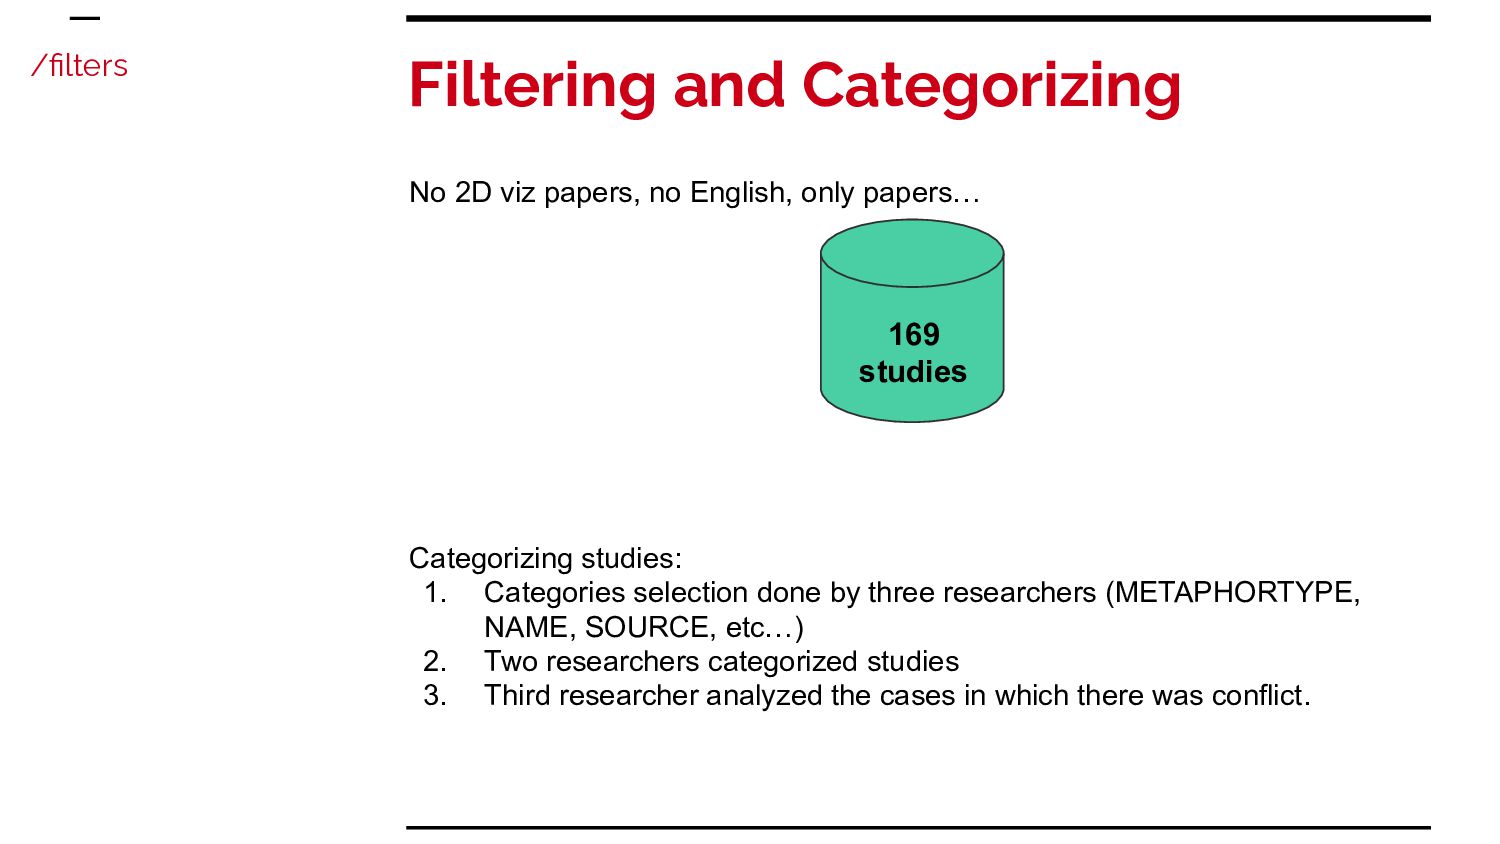
papers… 169 studies Categorizing studies: 1. Categories selection done by three researchers (METAPHORTYPE, NAME, SOURCE, etc…) 2. Two researchers categorized studies 3. Third researcher analyzed the cases in which there was conflict. /filters
in software visualization continues to be an active metaphor in the community. Greater technology accessibility fuels software visualization research growth.
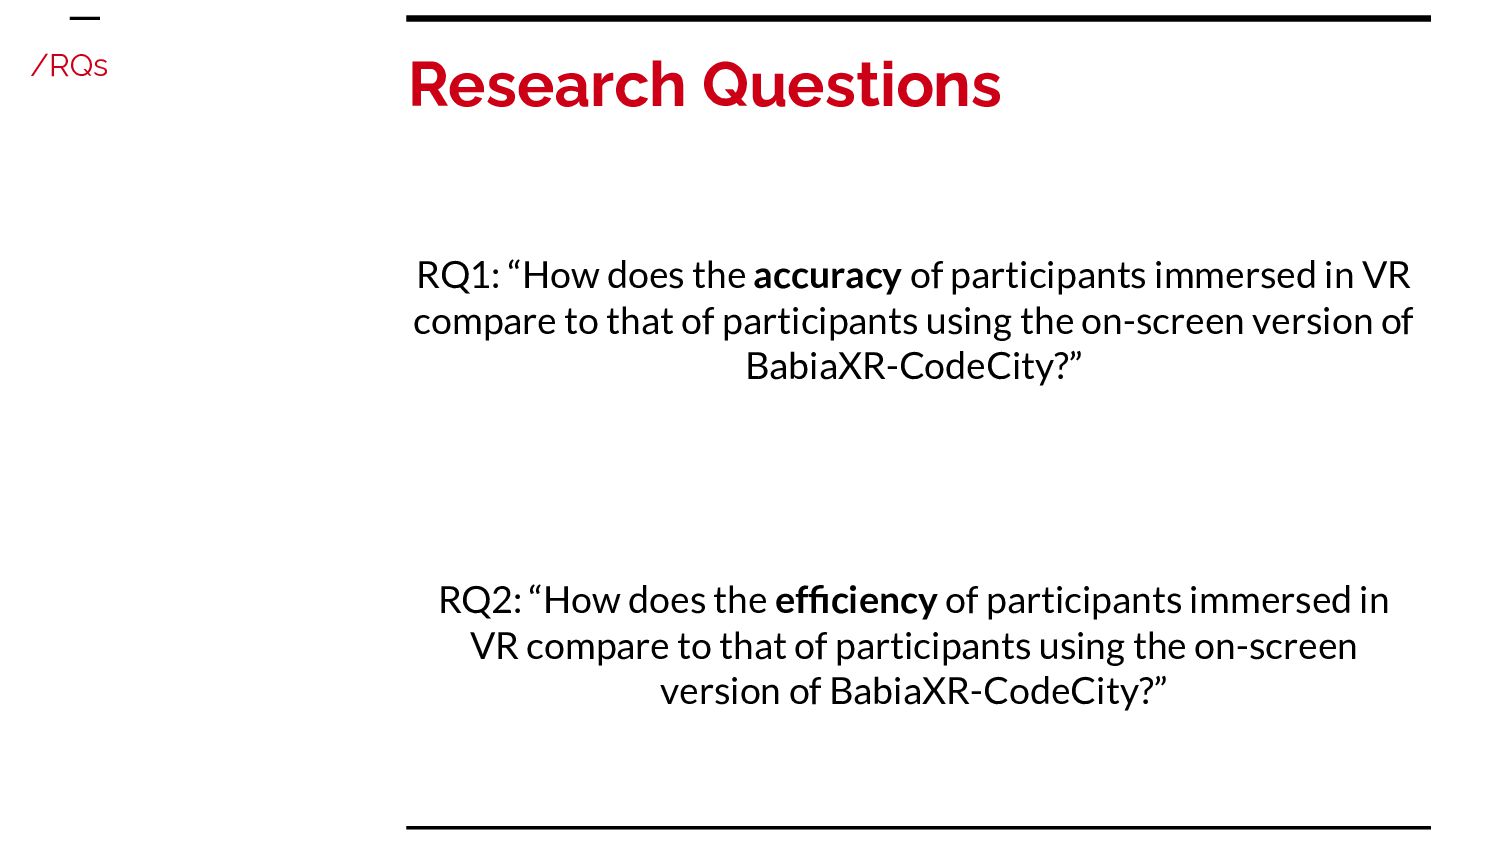
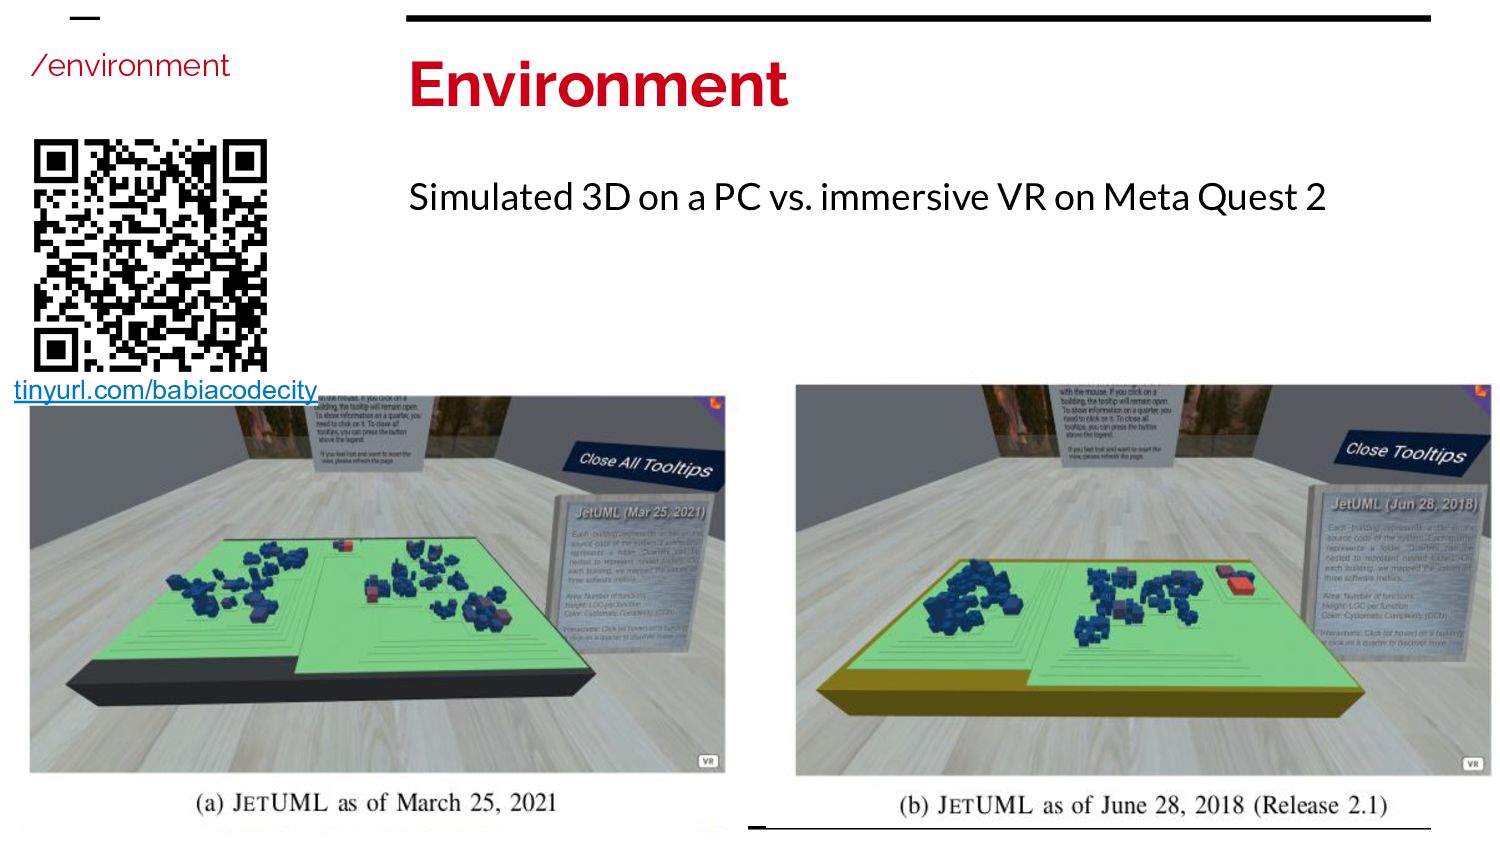
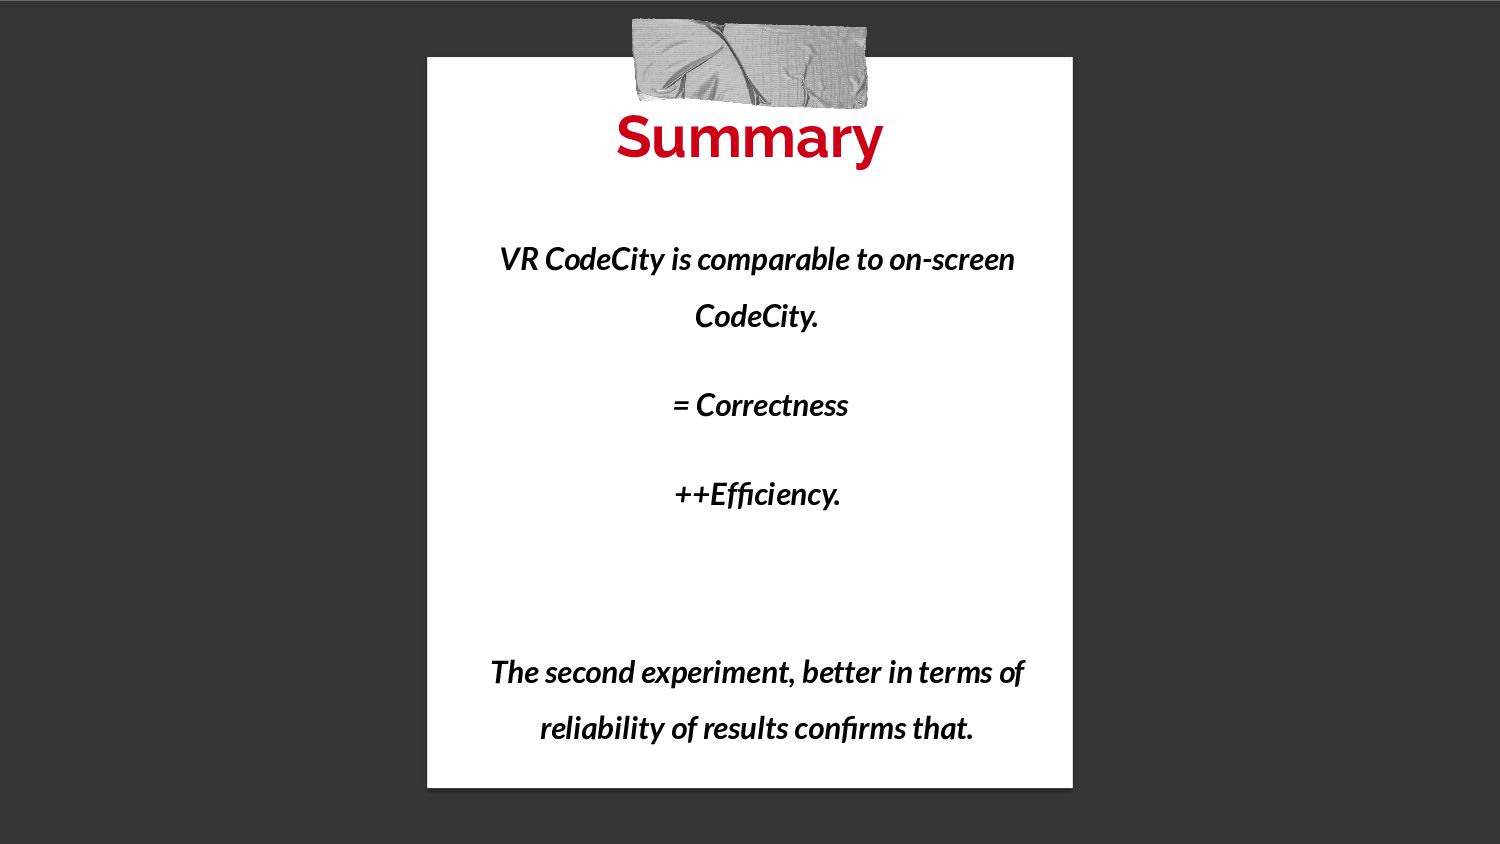
visualization - VR better to visualize 3D Comparison of CodeCity in two environments. Software comprehension tasks. Can VR improve software comprehension using the city metaphor for visualizing source code metrics? Know advantages/limitations of VR in this context.
in VR compare to that of participants using the on-screen version of BabiaXR-CodeCity?” RQ2: “How does the efficiency of participants immersed in VR compare to that of participants using the on-screen version of BabiaXR-CodeCity?” /RQs
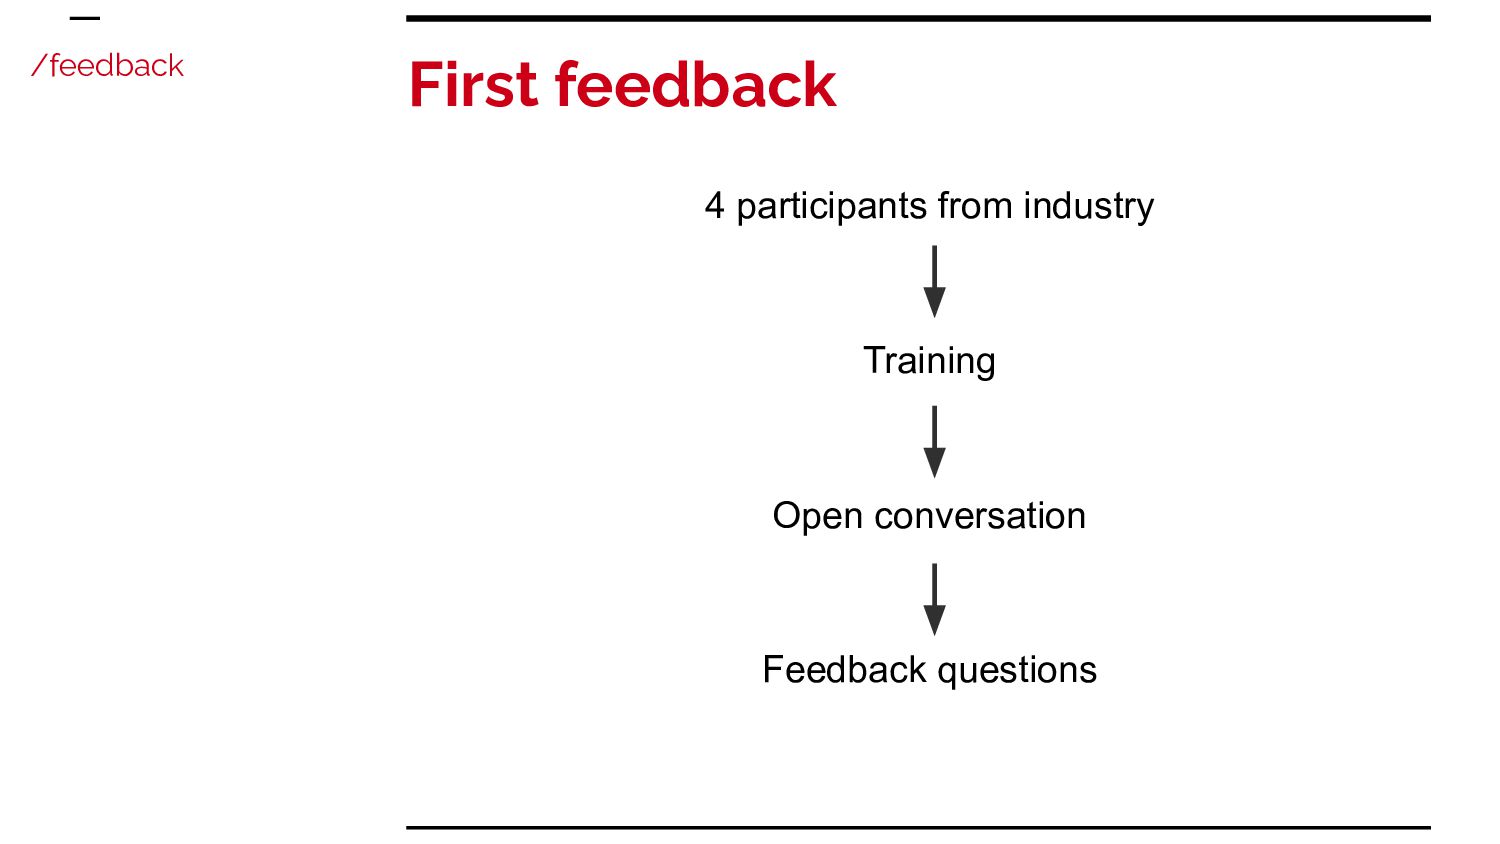
Invited for an extension. Repeat the experiment with some changes from the feedback. Compare results and confirm the ones extracted in the first experiment.
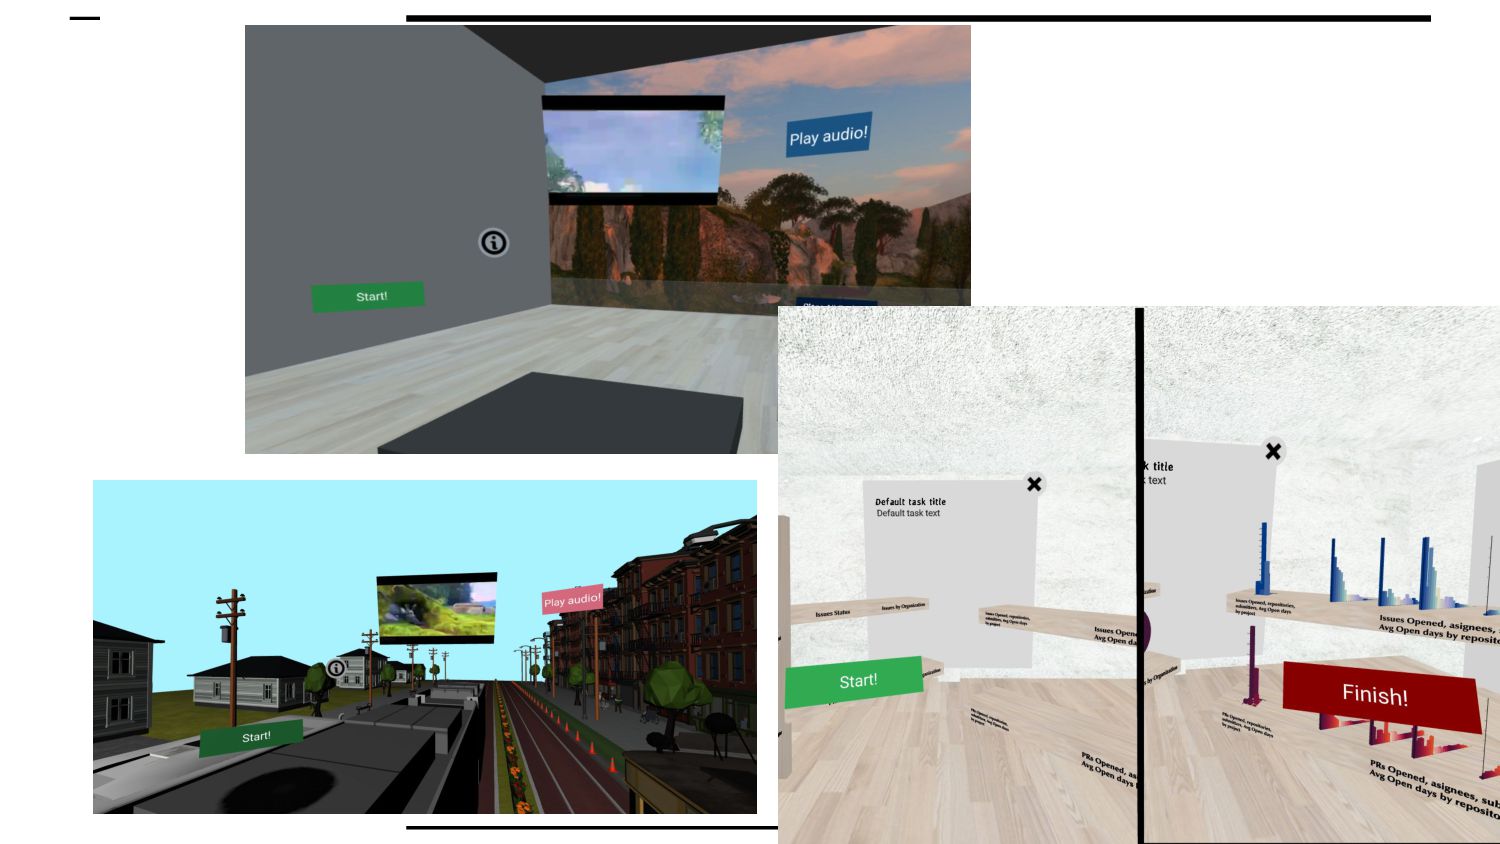
and tasks displayed on the scene. Location of the tasks in order to avoid bias. Training with the city and non-usable data. Remove the environment on a old release. Add two new tasks to improve the results. 26 new participants
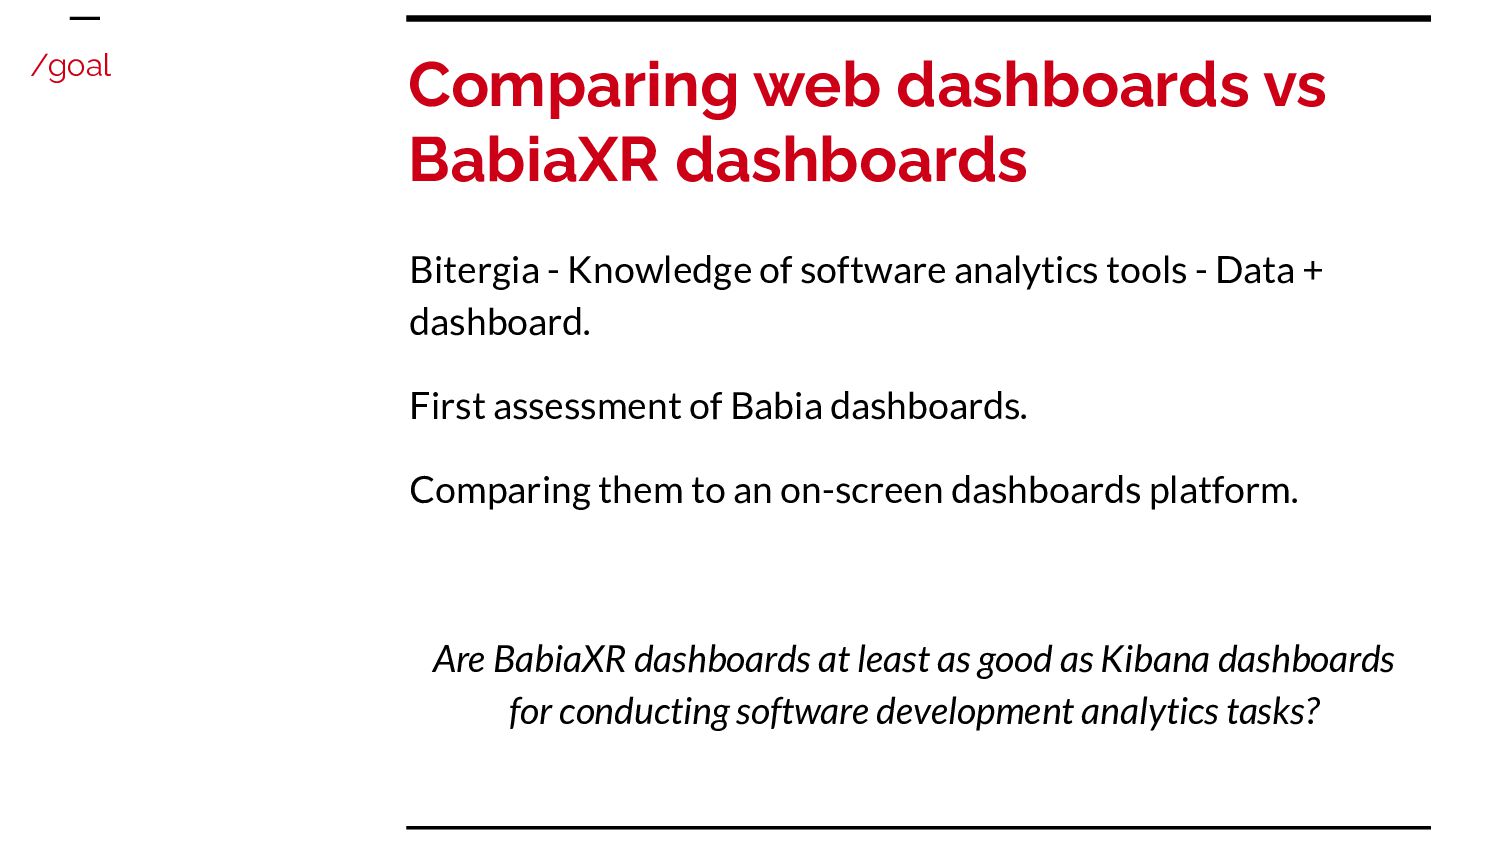
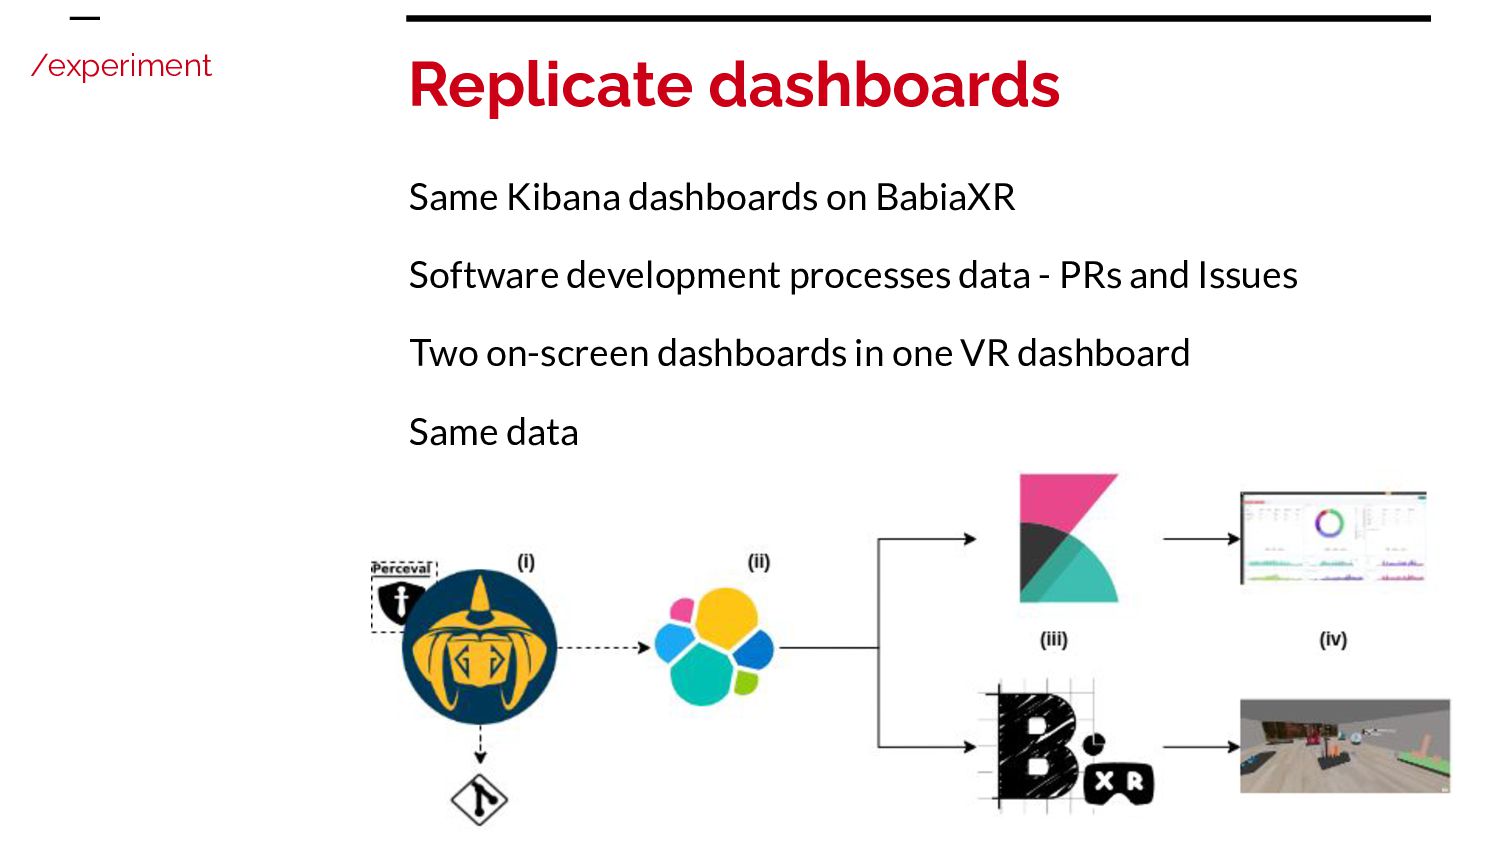
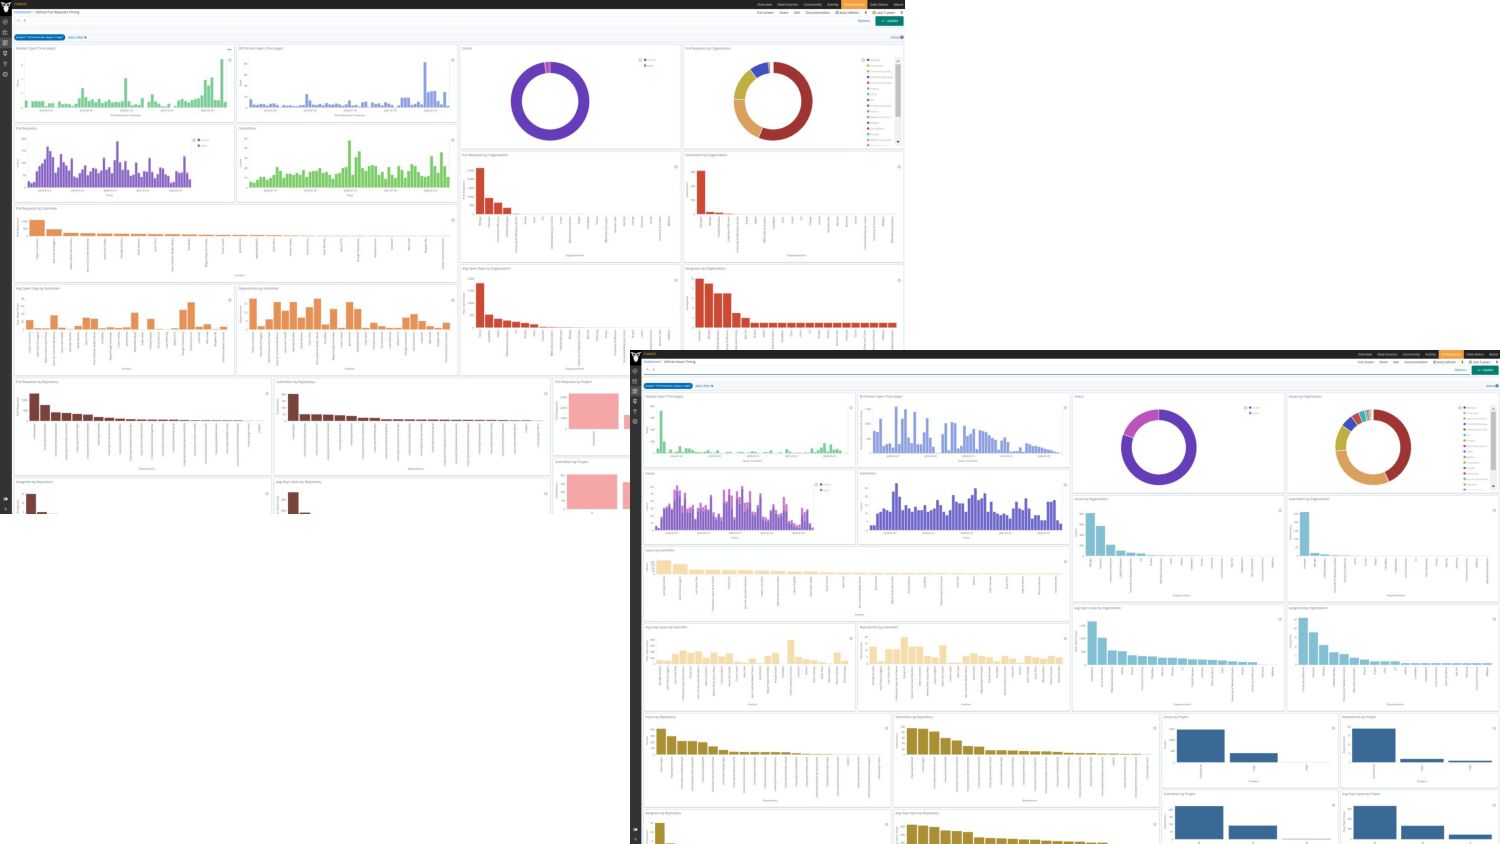
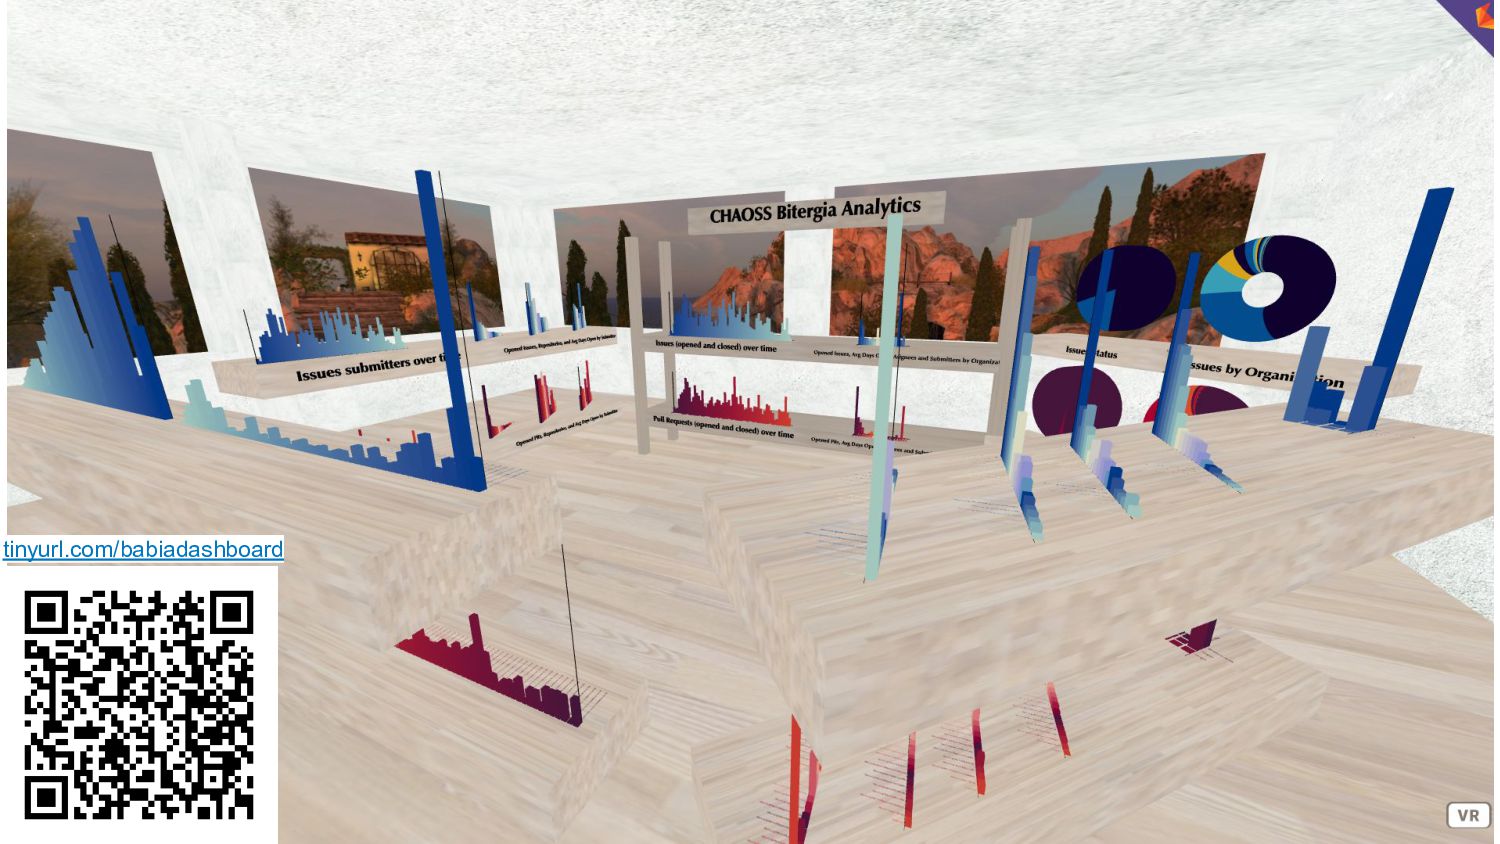
of software analytics tools - Data + dashboard. First assessment of Babia dashboards. Comparing them to an on-screen dashboards platform. Are BabiaXR dashboards at least as good as Kibana dashboards for conducting software development analytics tasks?
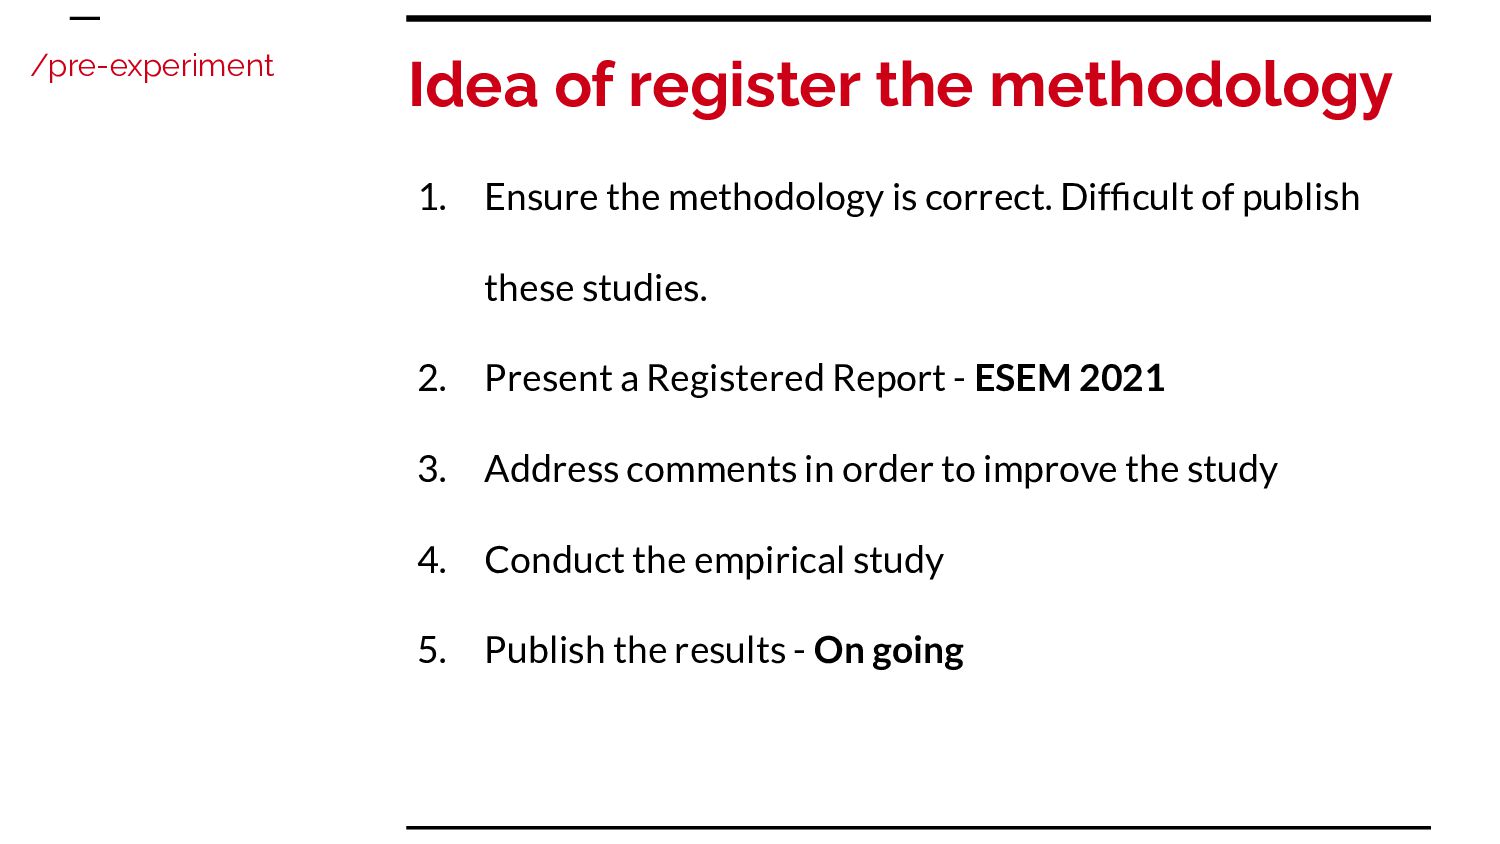
correct. Difficult of publish these studies. 2. Present a Registered Report - ESEM 2021 3. Address comments in order to improve the study 4. Conduct the empirical study 5. Publish the results - On going /pre-experiment
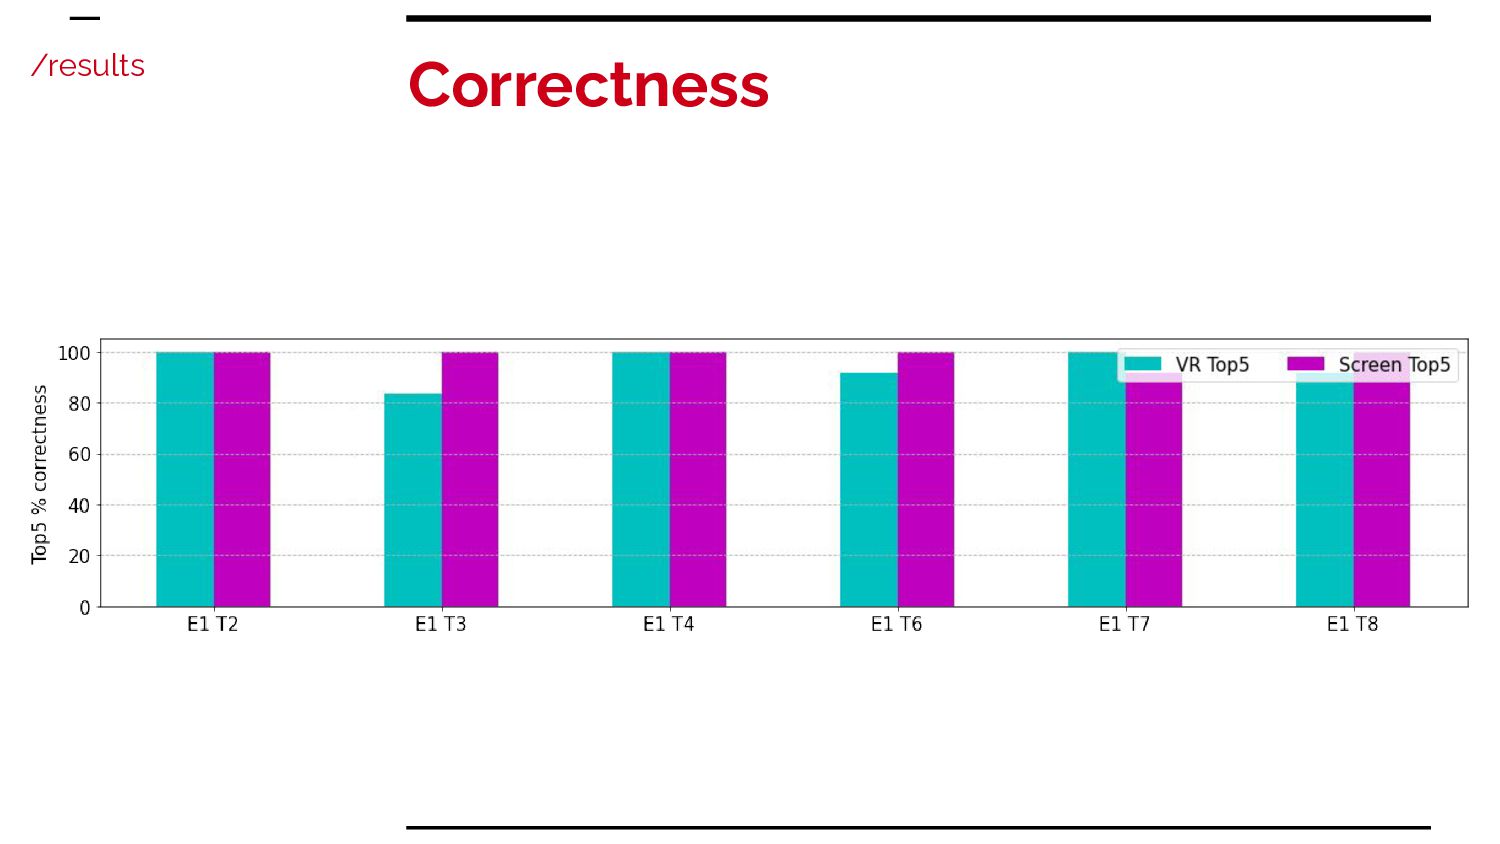
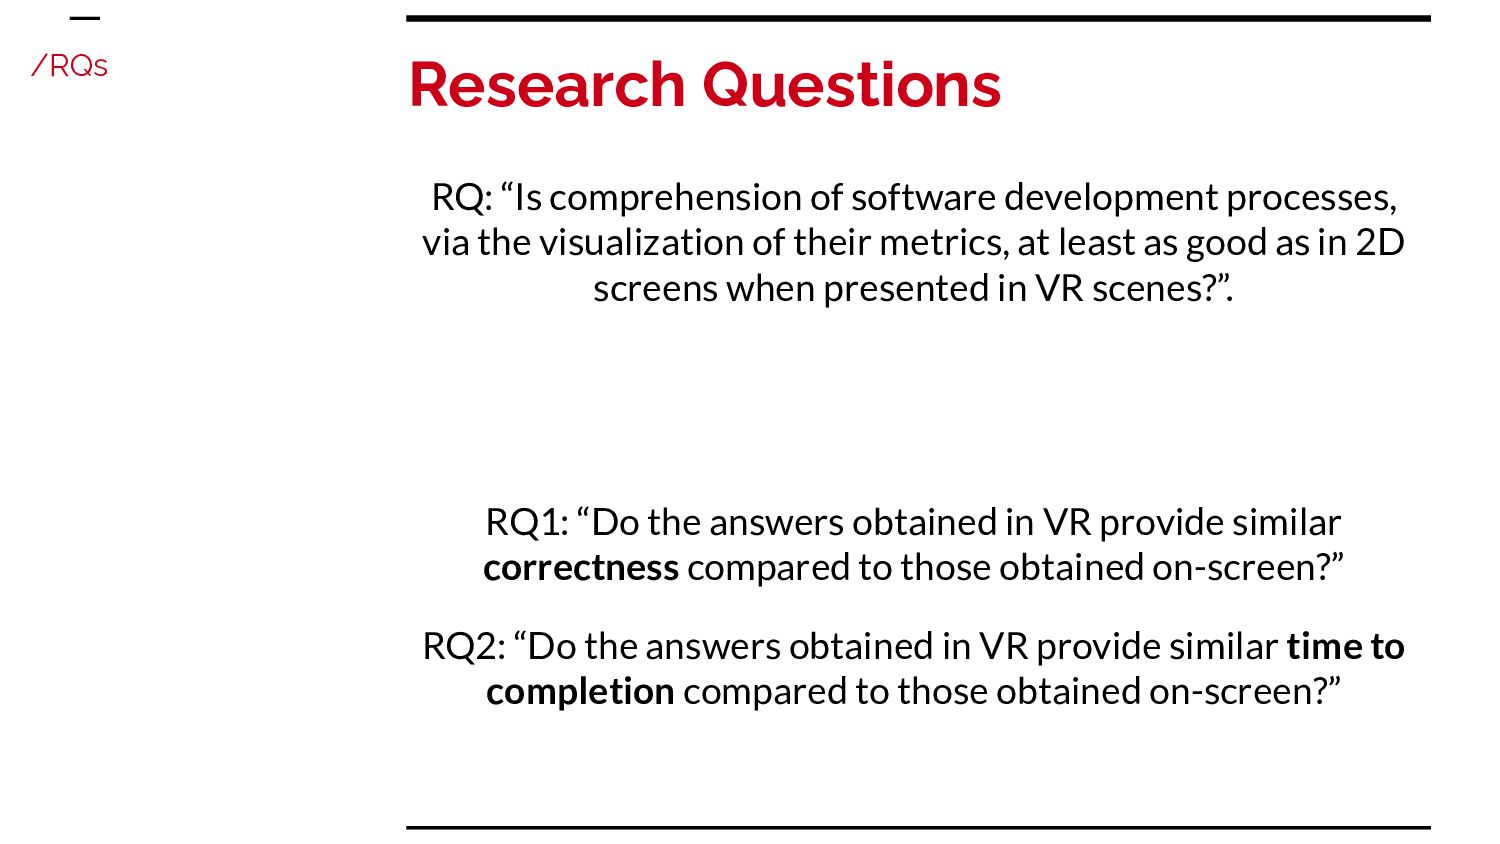
the visualization of their metrics, at least as good as in 2D screens when presented in VR scenes?”. RQ1: “Do the answers obtained in VR provide similar correctness compared to those obtained on-screen?” RQ2: “Do the answers obtained in VR provide similar time to completion compared to those obtained on-screen?” /RQs
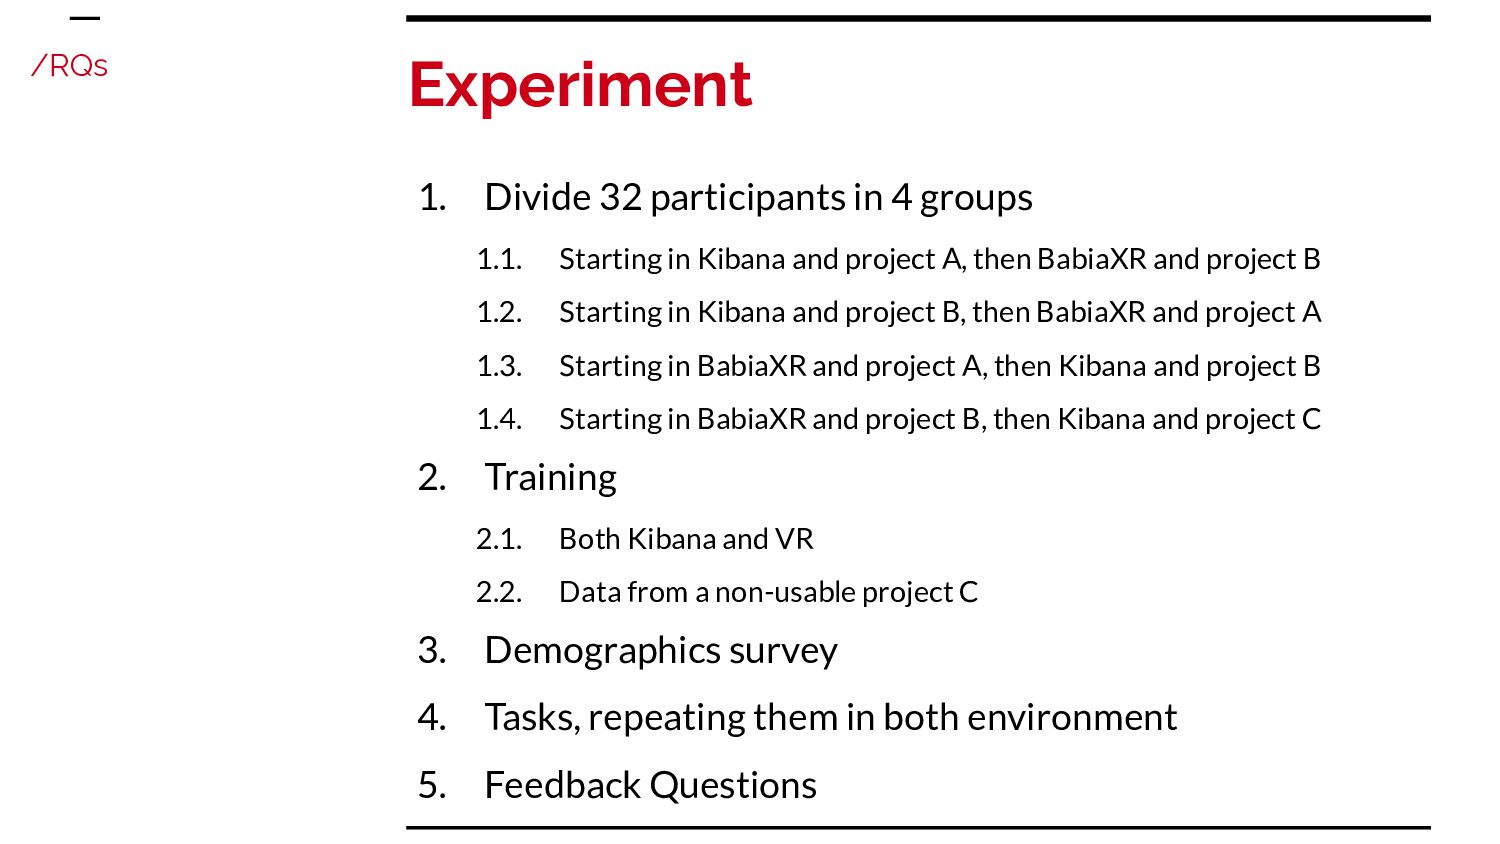
in Kibana and project A, then BabiaXR and project B 1.2. Starting in Kibana and project B, then BabiaXR and project A 1.3. Starting in BabiaXR and project A, then Kibana and project B 1.4. Starting in BabiaXR and project B, then Kibana and project C 2. Training 2.1. Both Kibana and VR 2.2. Data from a non-usable project C 3. Demographics survey 4. Tasks, repeating them in both environment 5. Feedback Questions /RQs
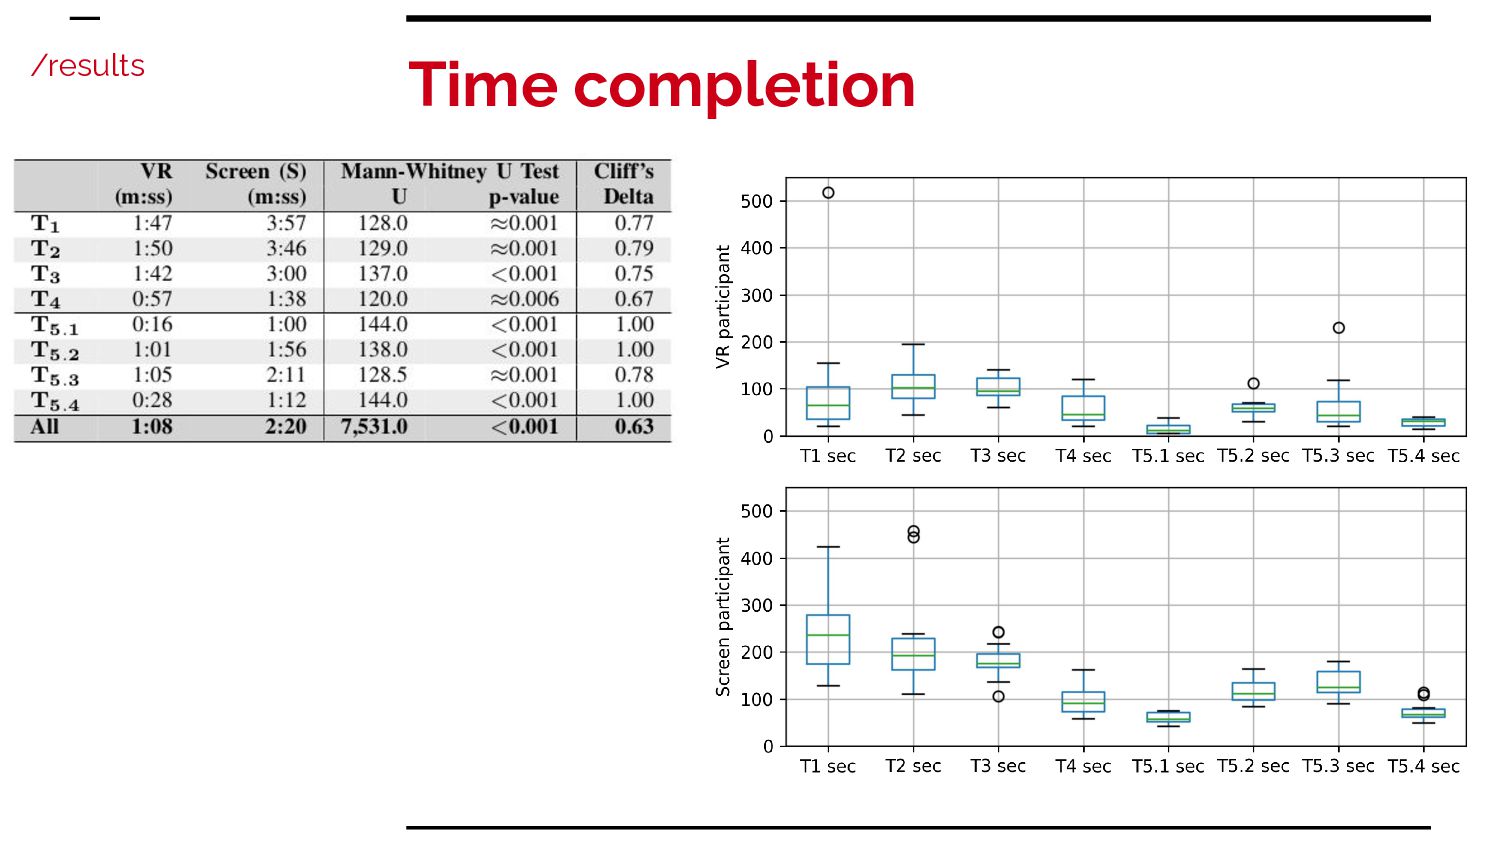
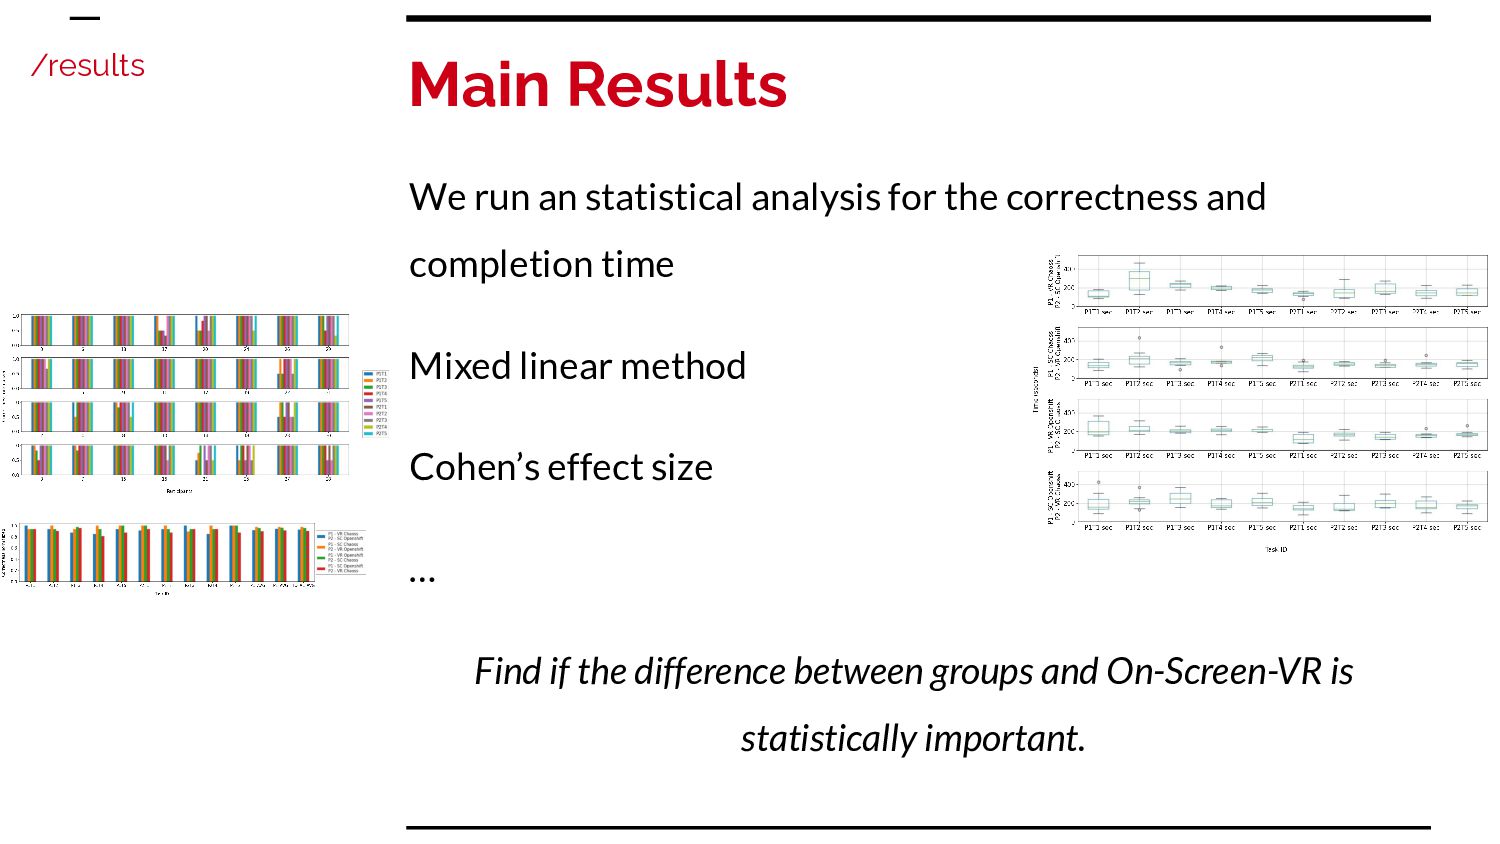
time Mixed linear method Cohen’s effect size … Find if the difference between groups and On-Screen-VR is statistically important. Main Results /results
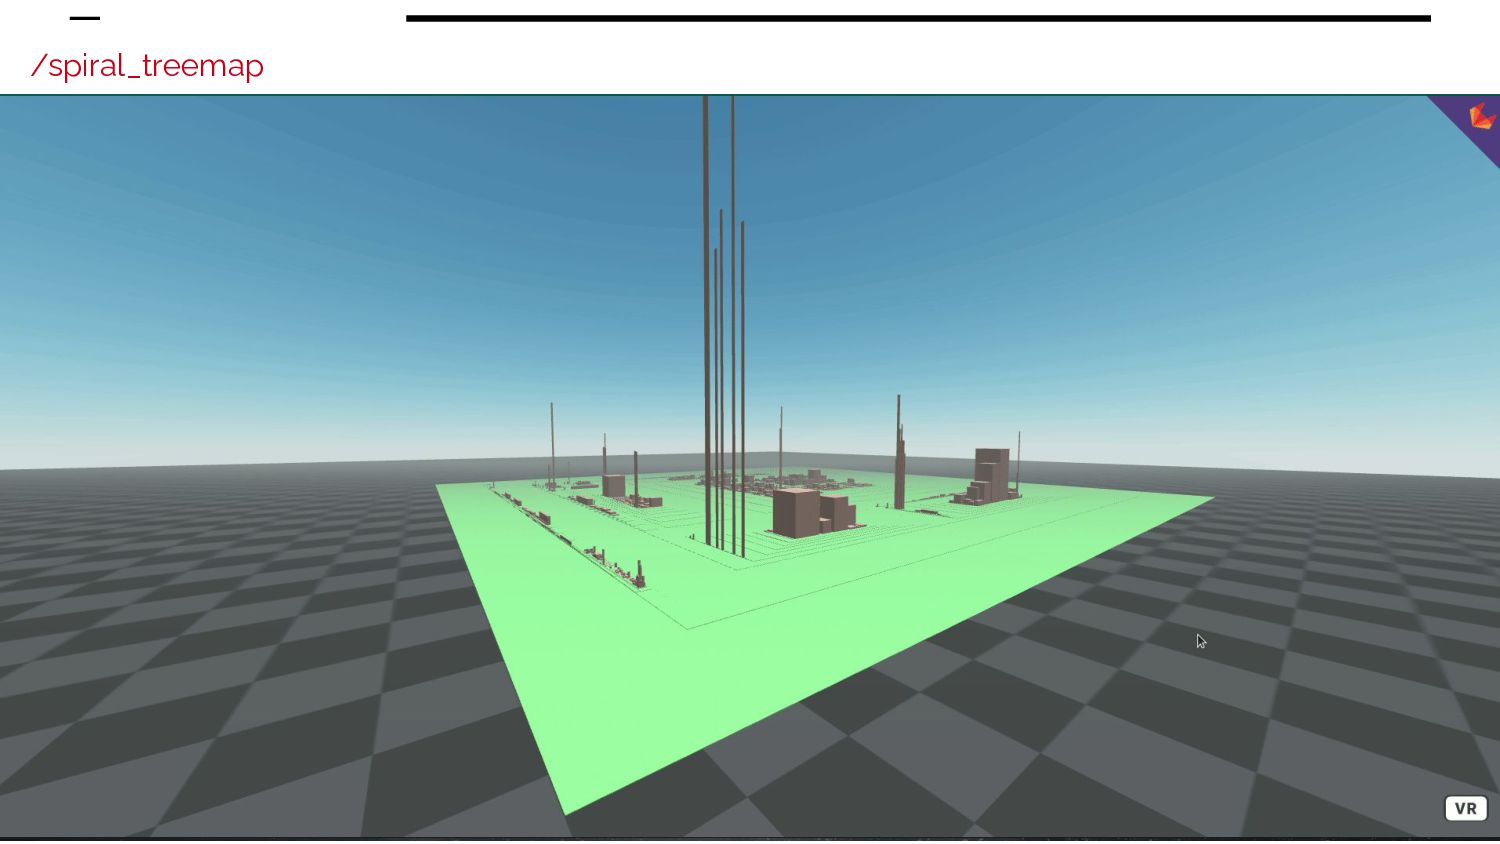
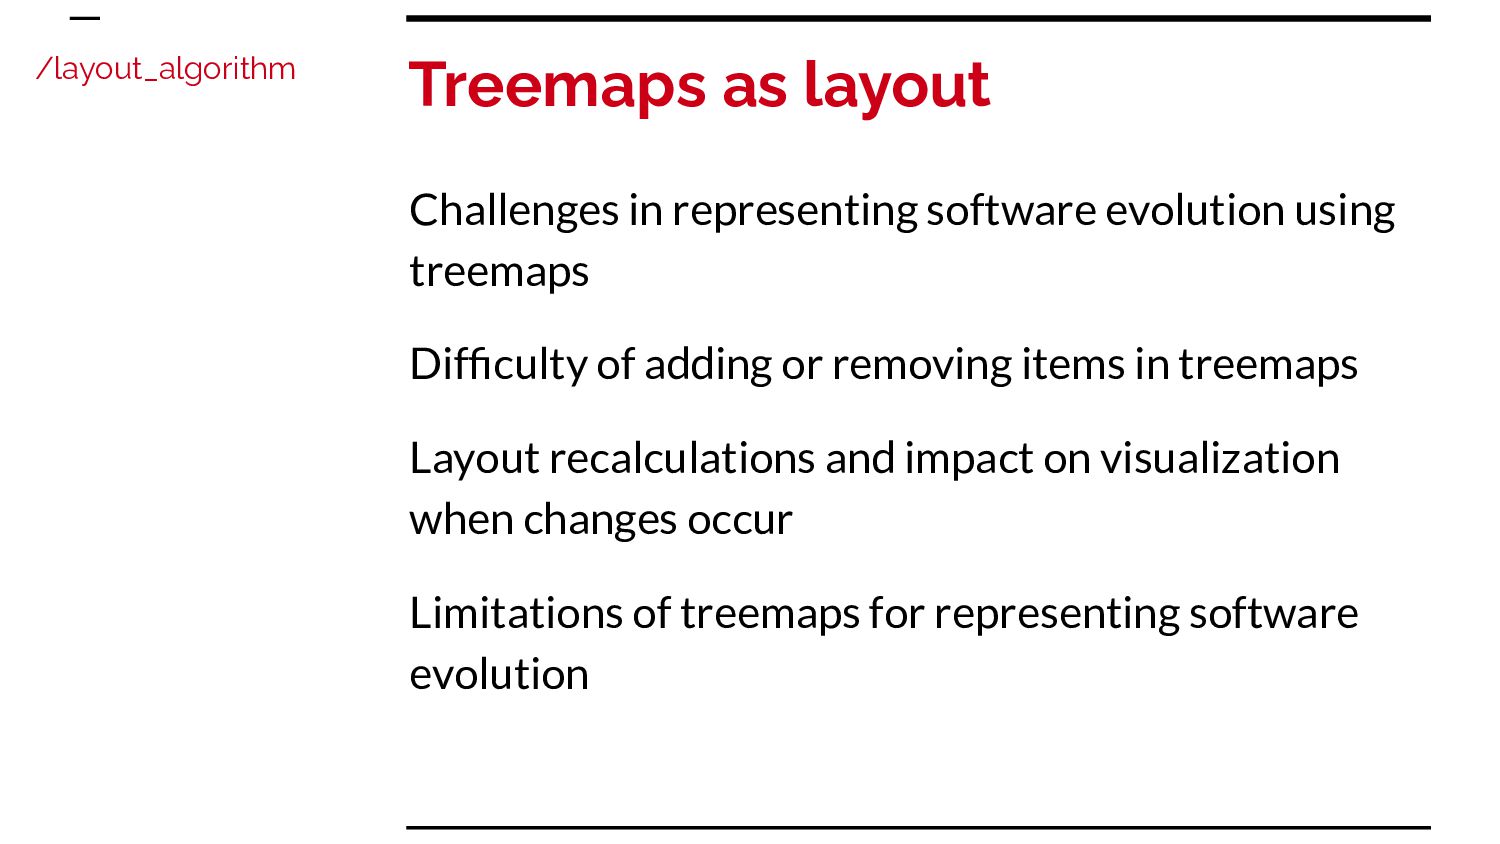
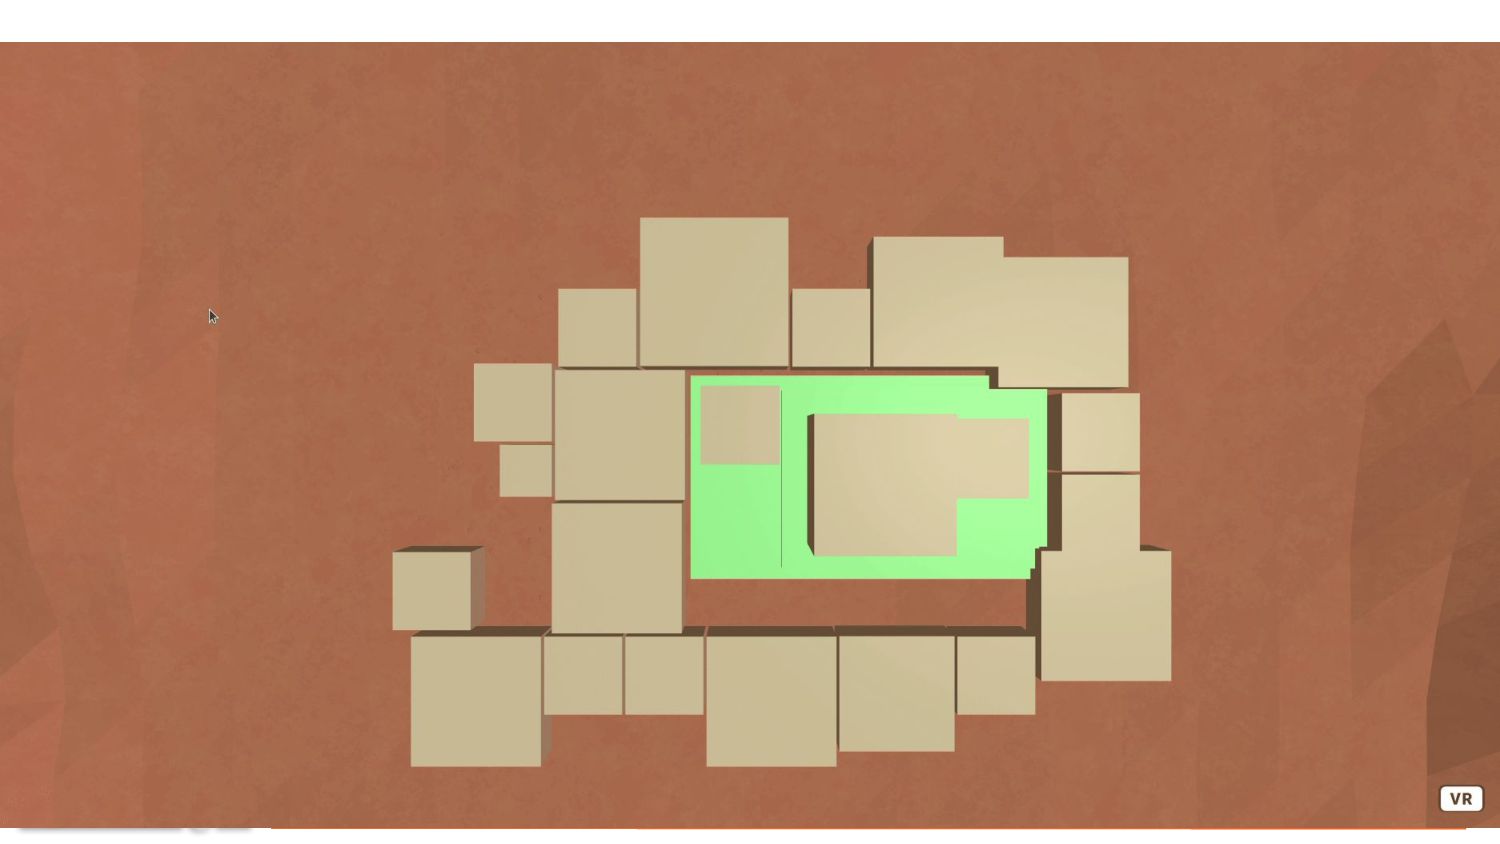
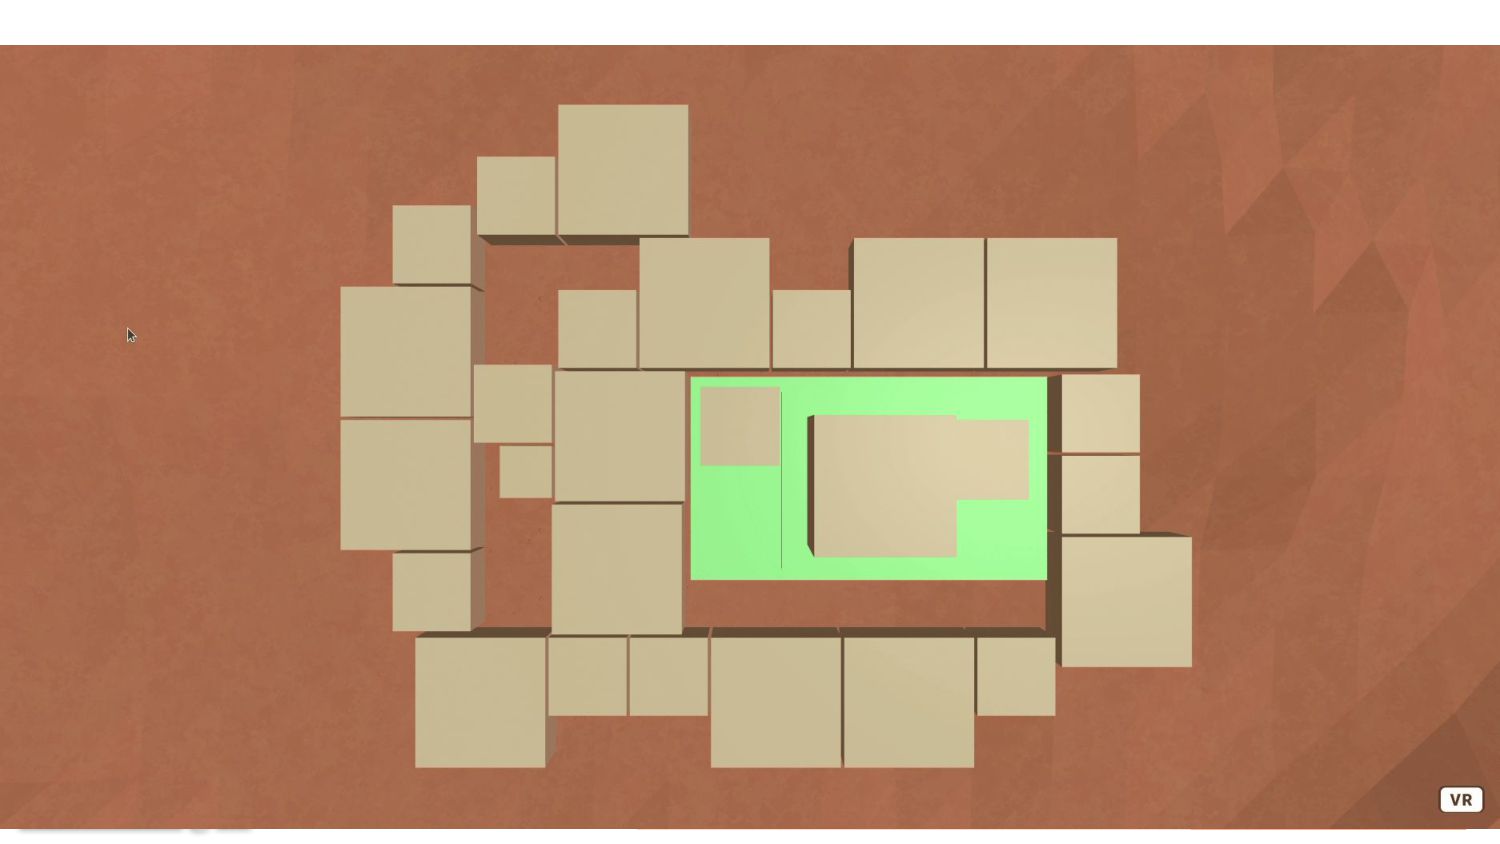
adding or removing items in treemaps Layout recalculations and impact on visualization when changes occur Limitations of treemaps for representing software evolution Treemaps as layout
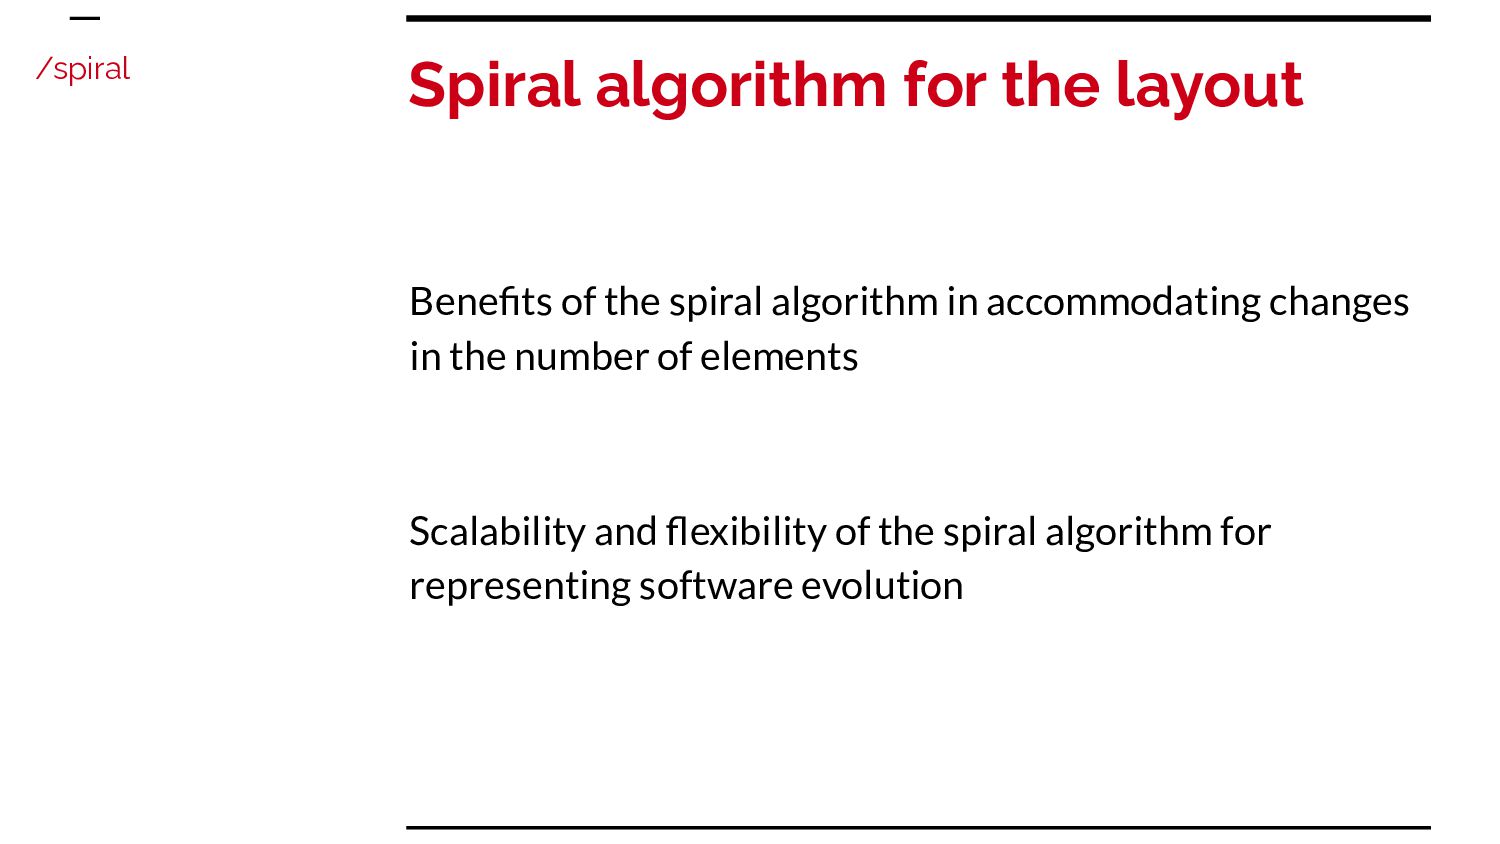
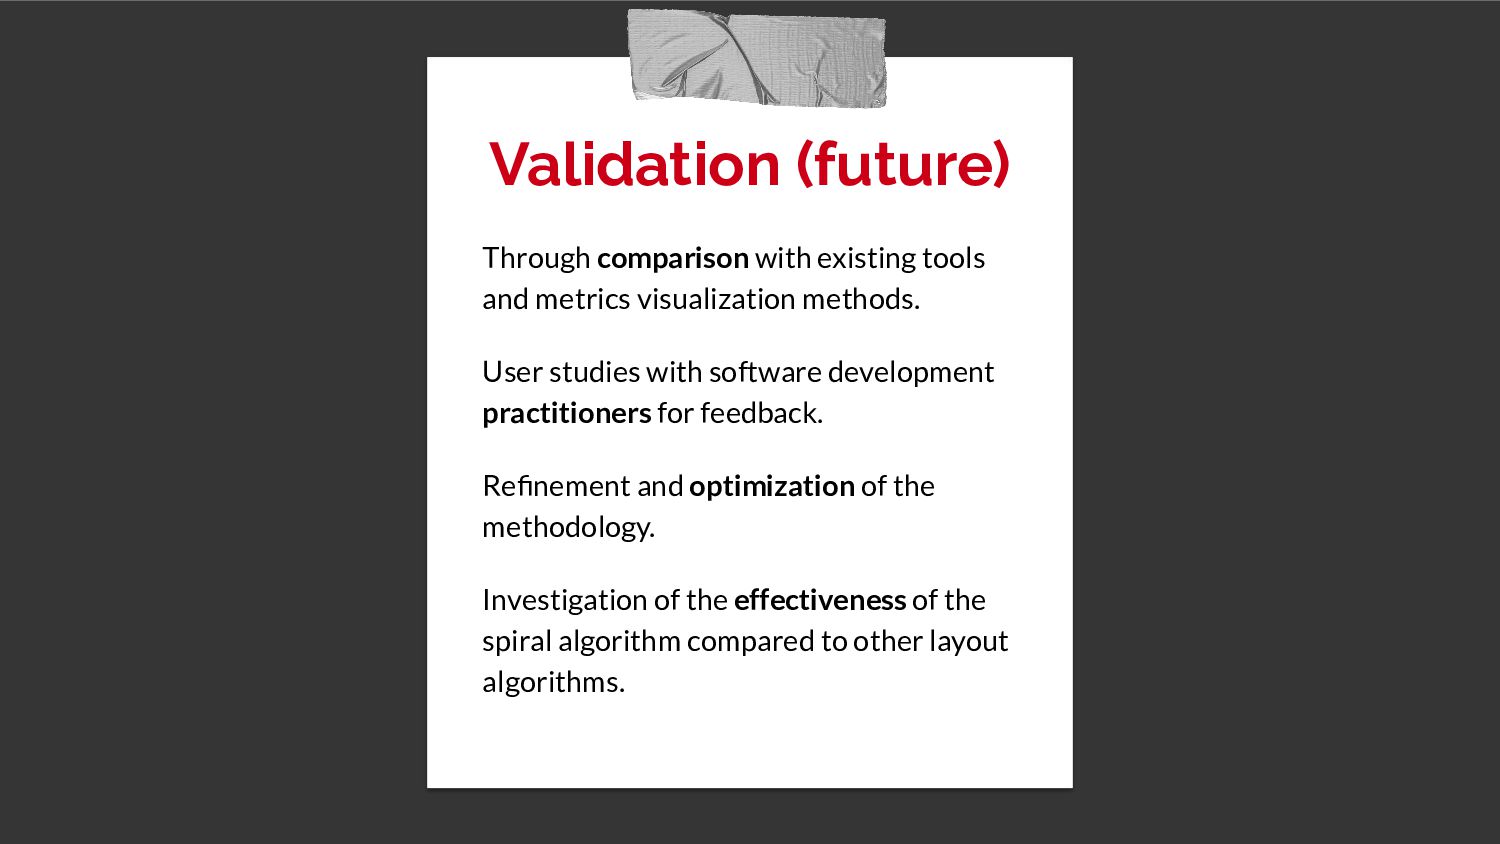
methods. User studies with software development practitioners for feedback. Refinement and optimization of the methodology. Investigation of the effectiveness of the spiral algorithm compared to other layout algorithms.
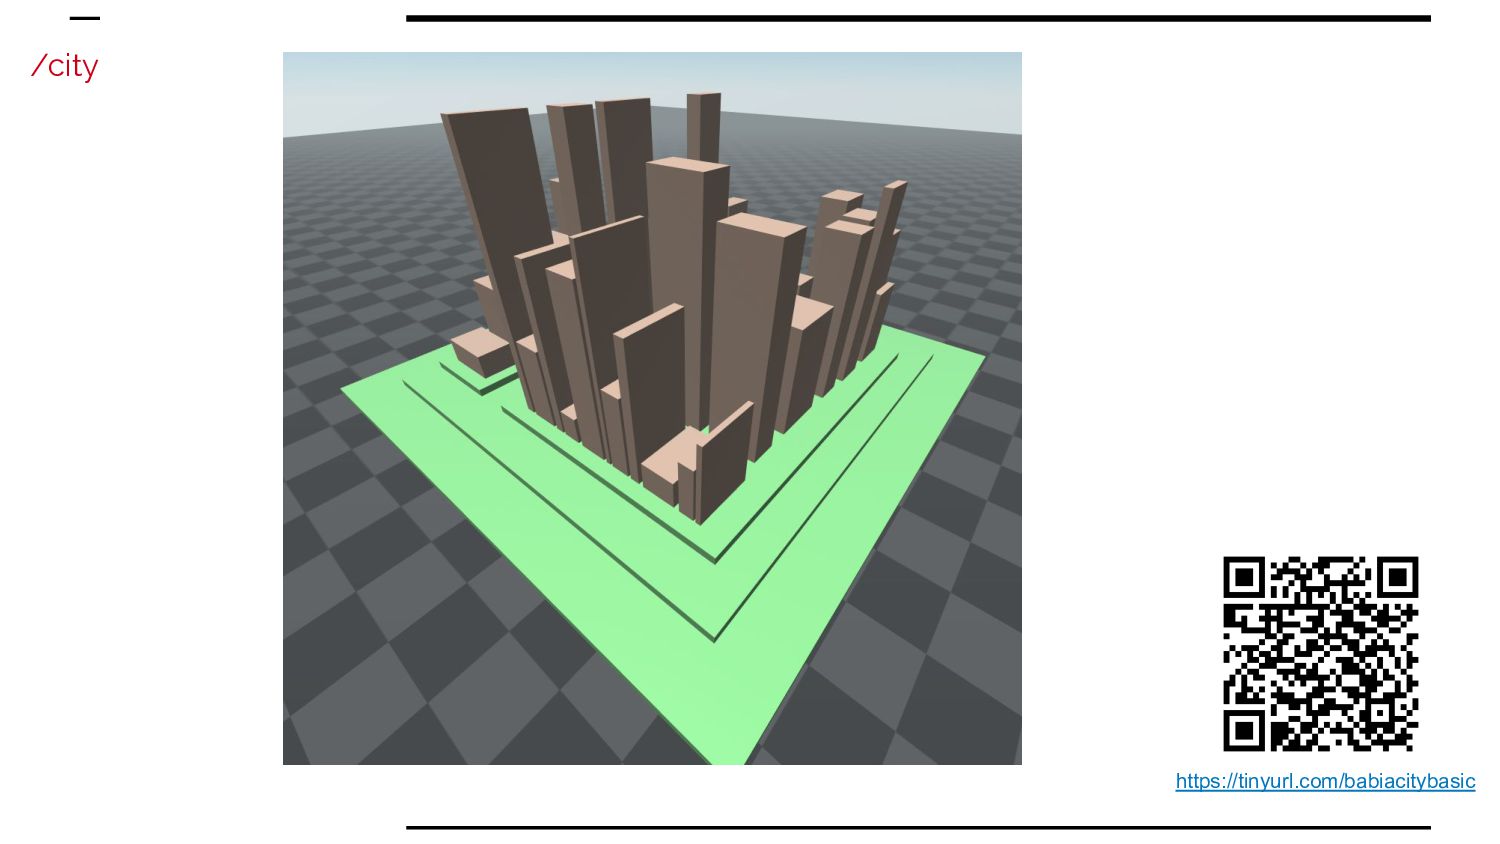
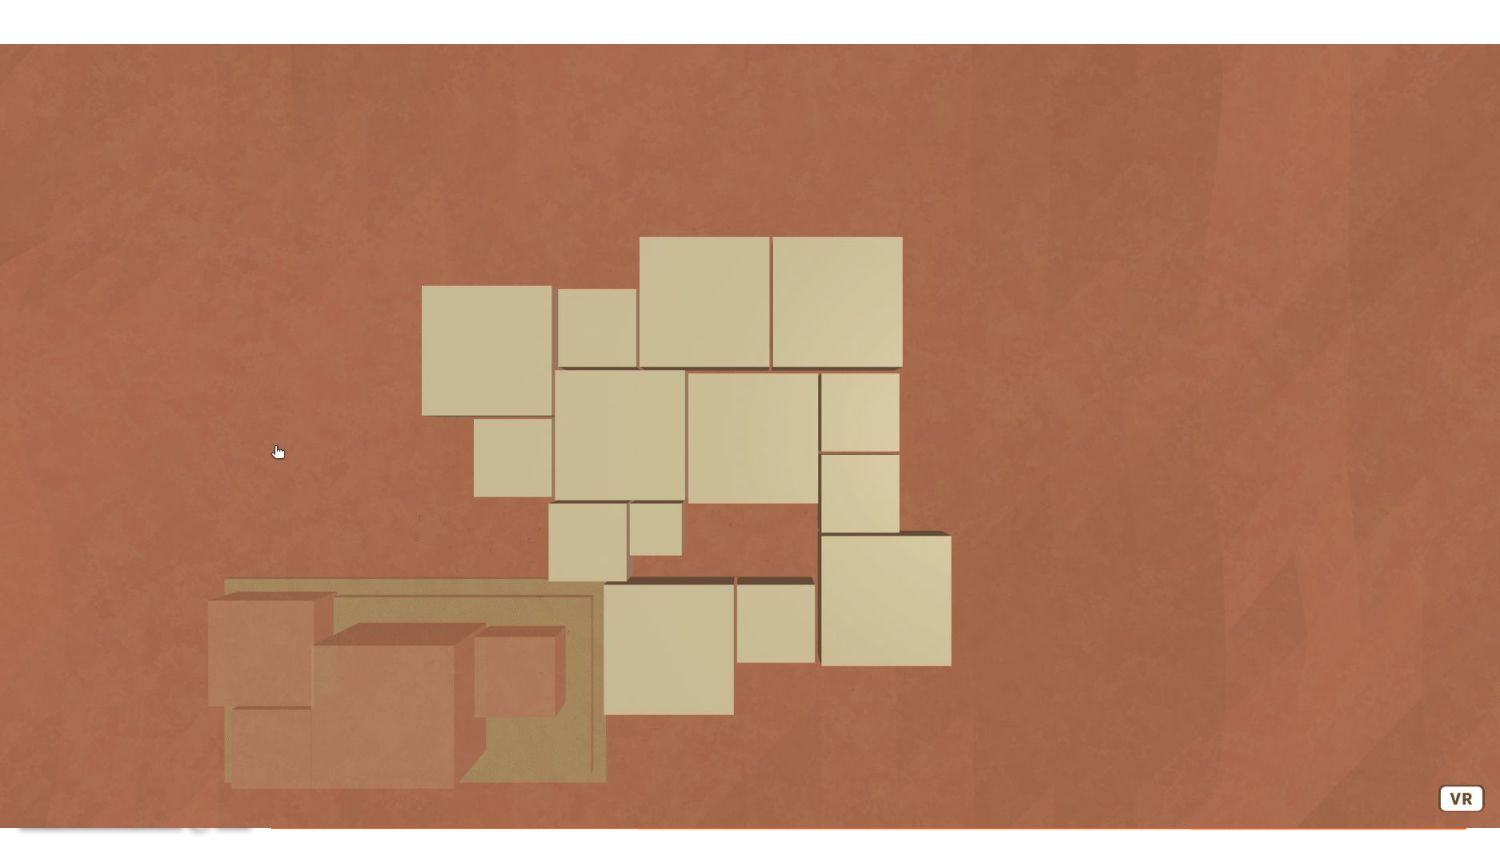
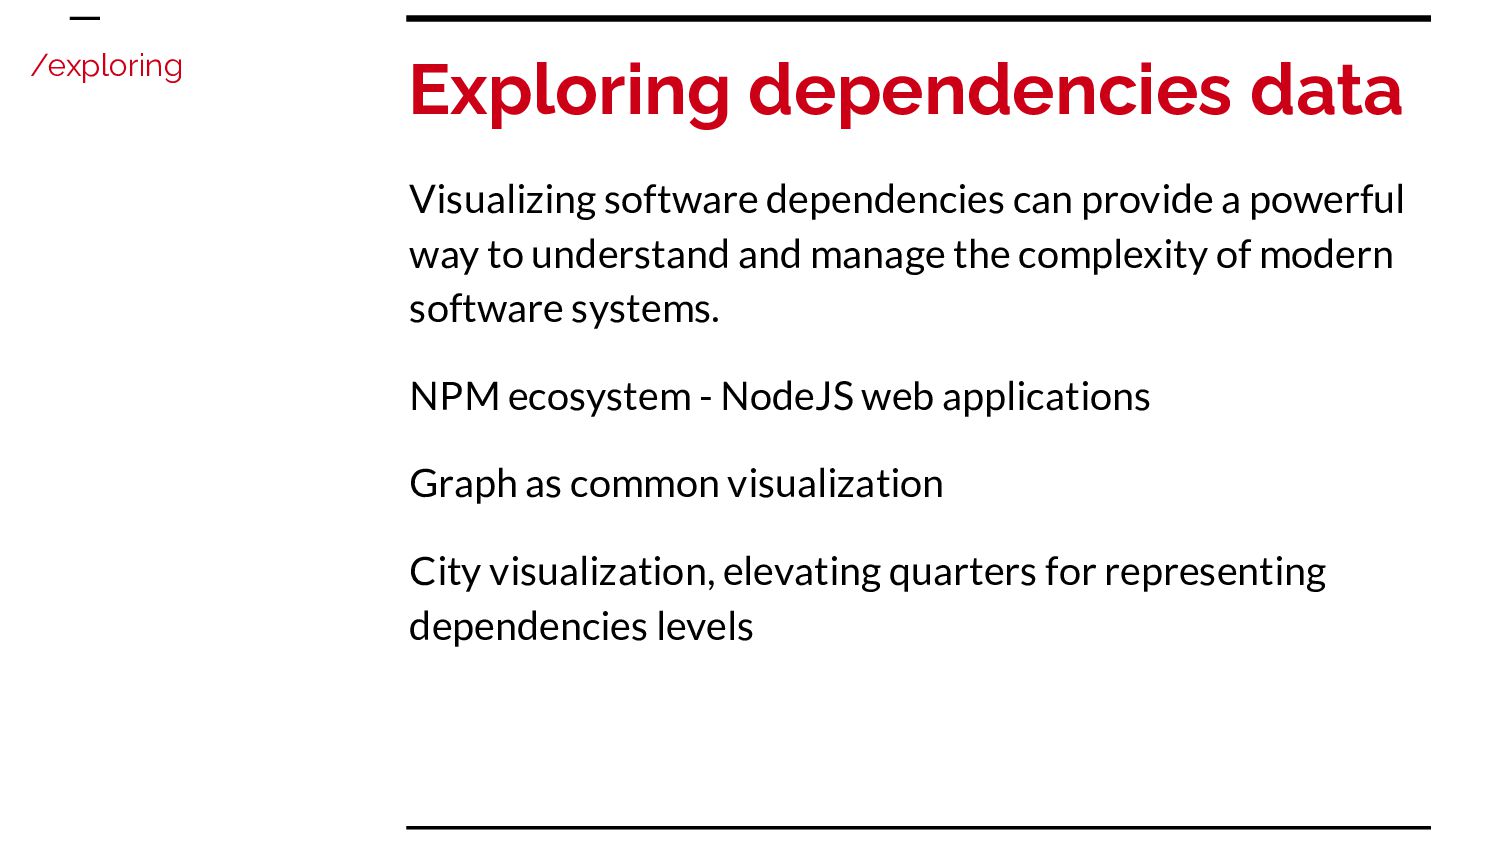
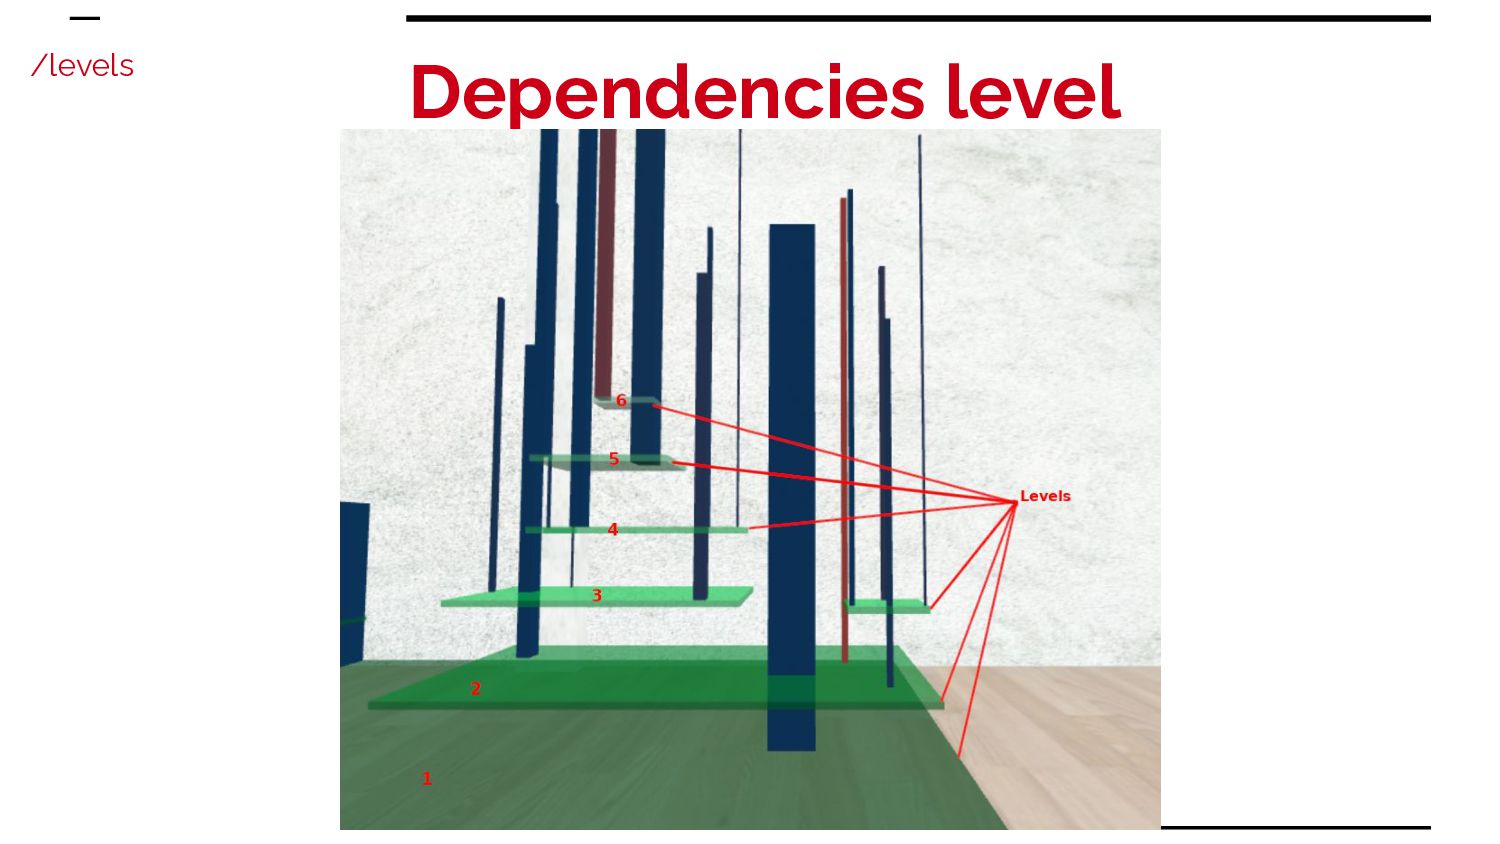
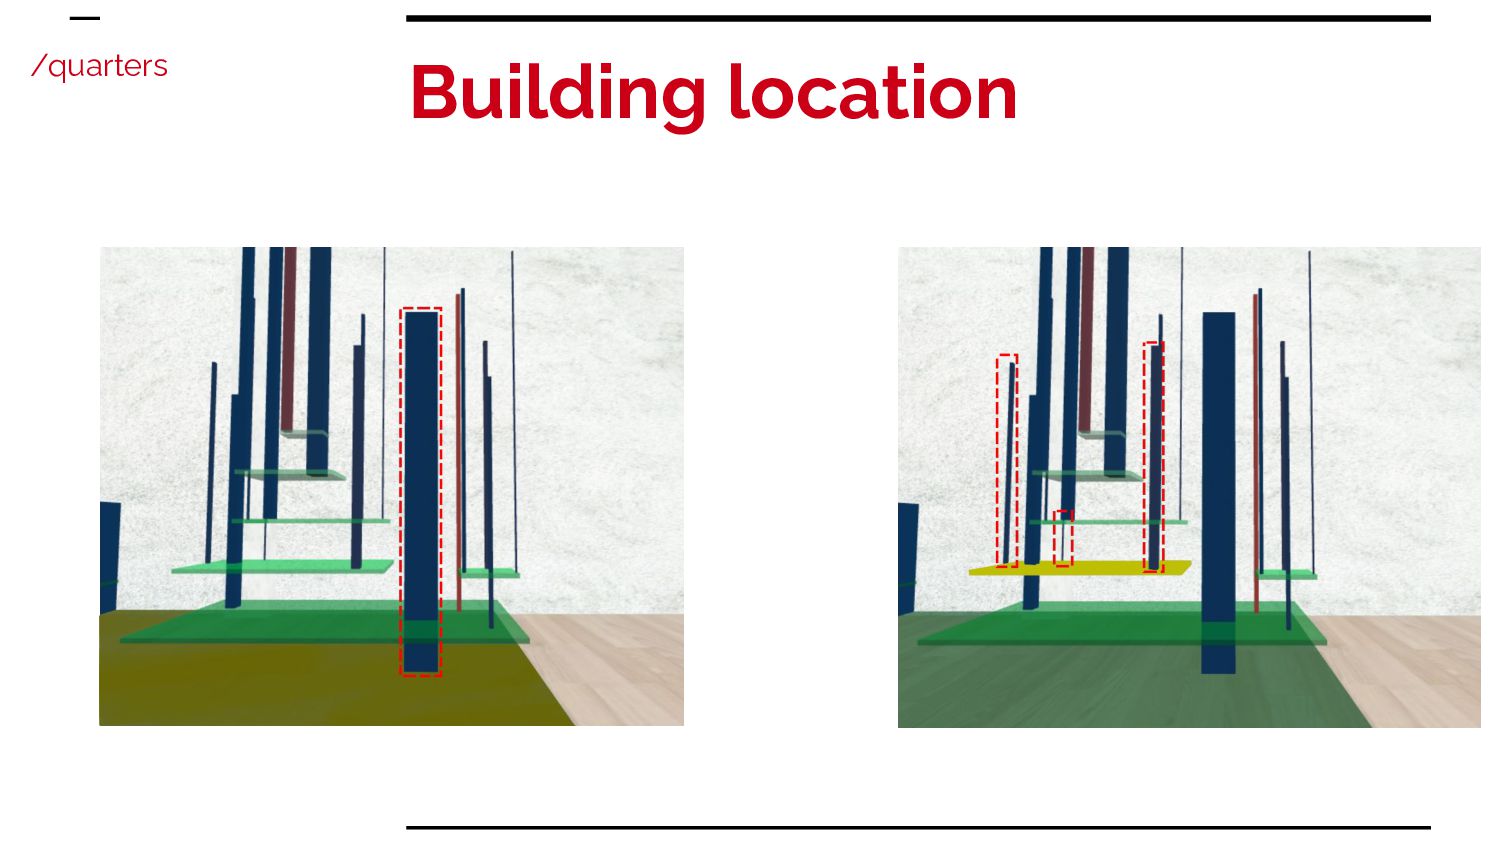
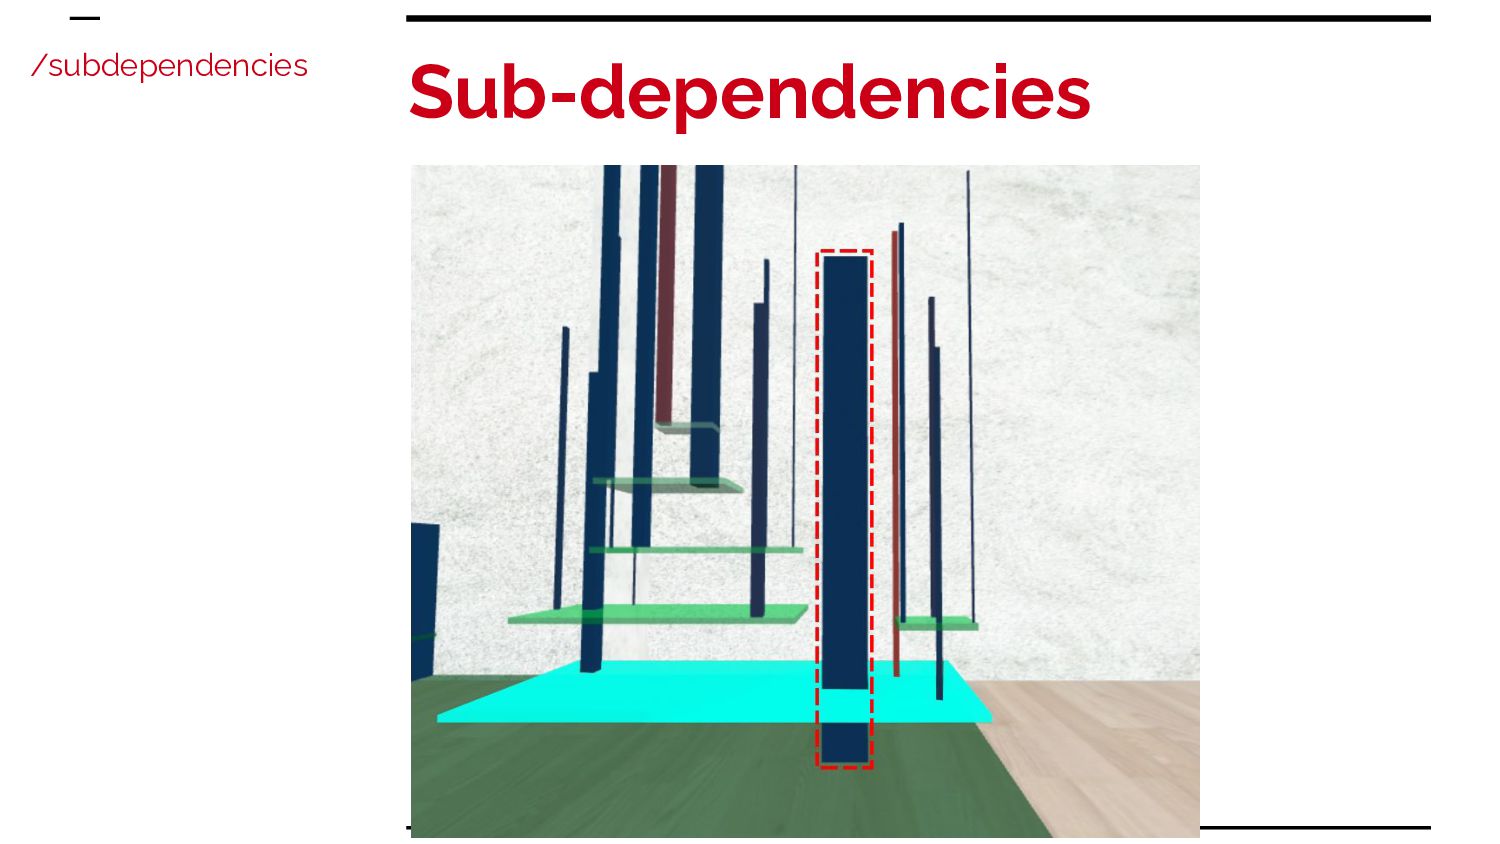
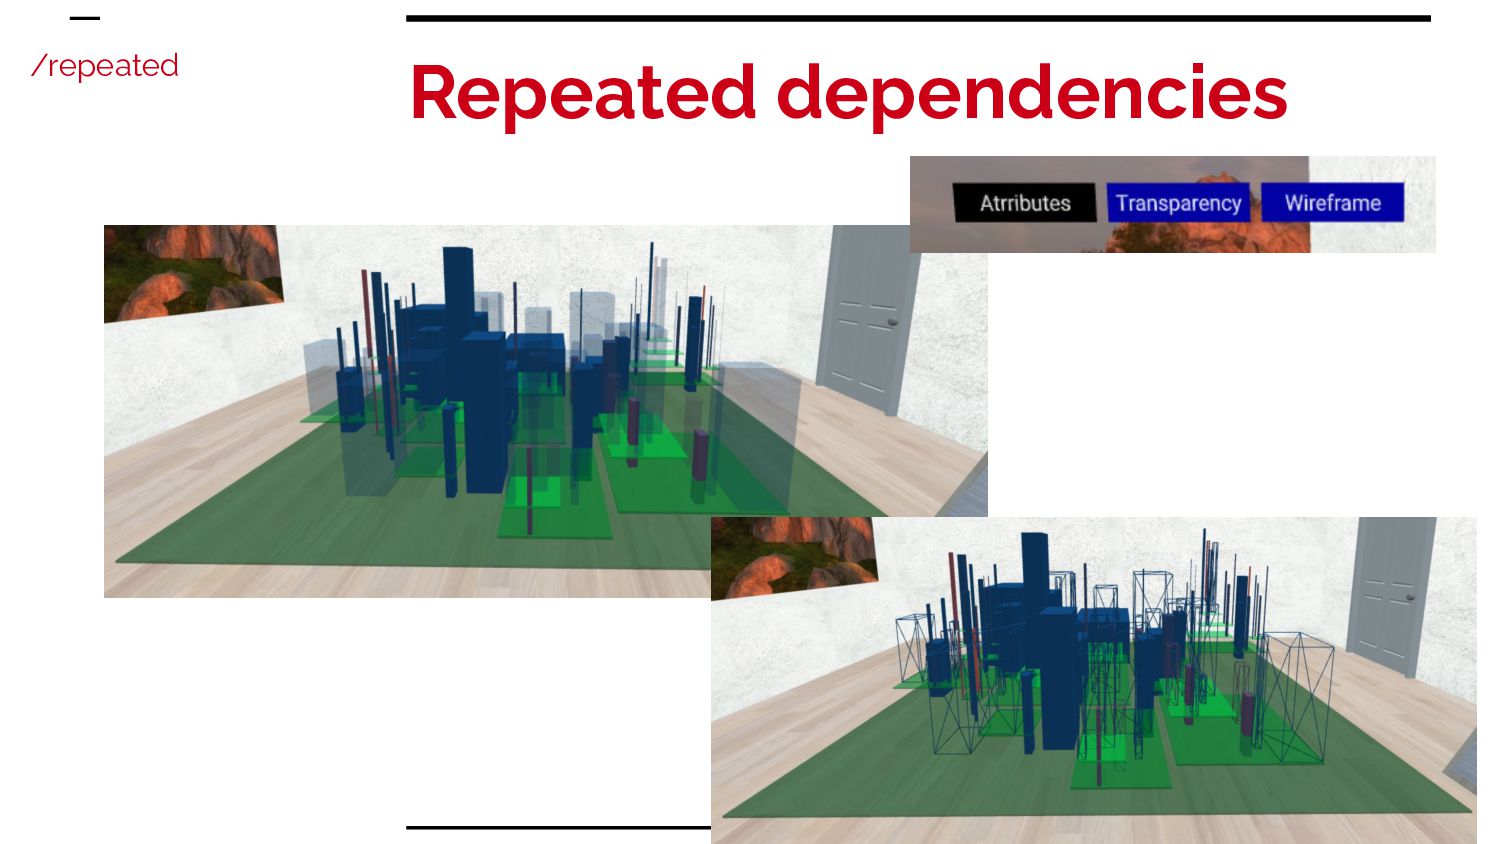
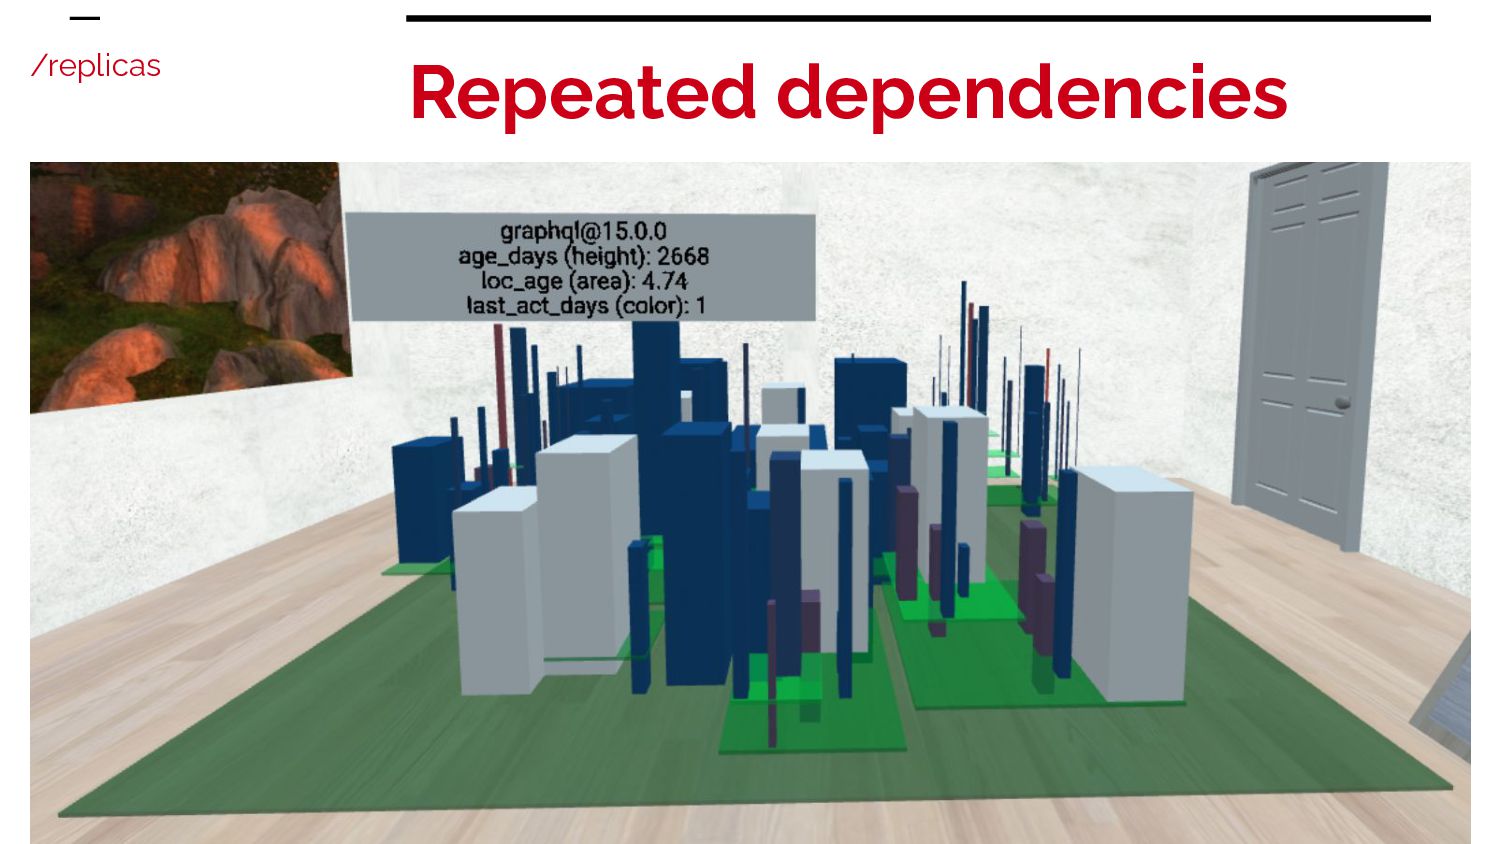
way to understand and manage the complexity of modern software systems. NPM ecosystem - NodeJS web applications Graph as common visualization City visualization, elevating quarters for representing dependencies levels /exploring
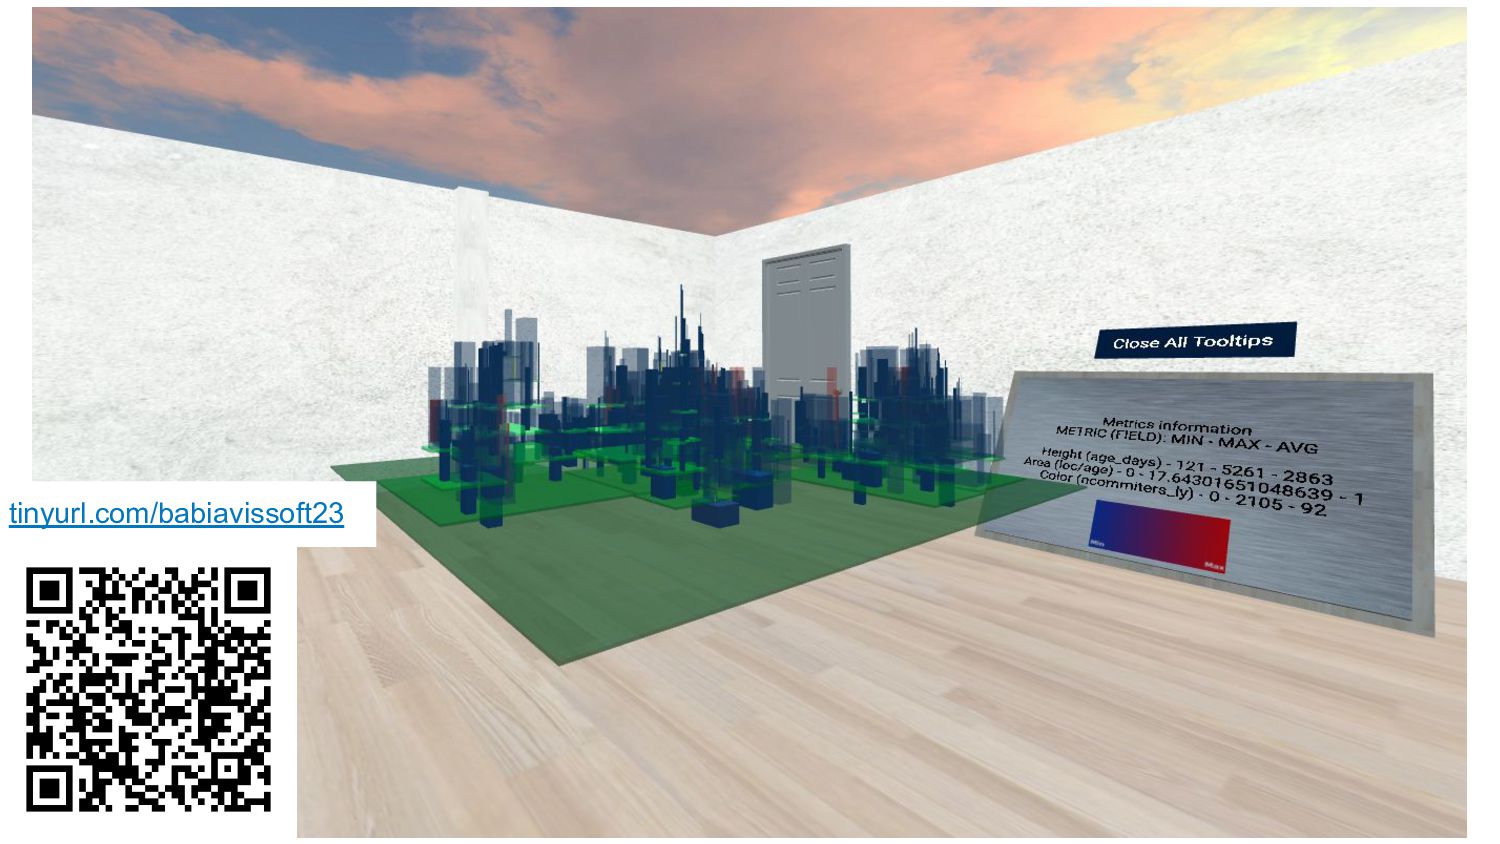
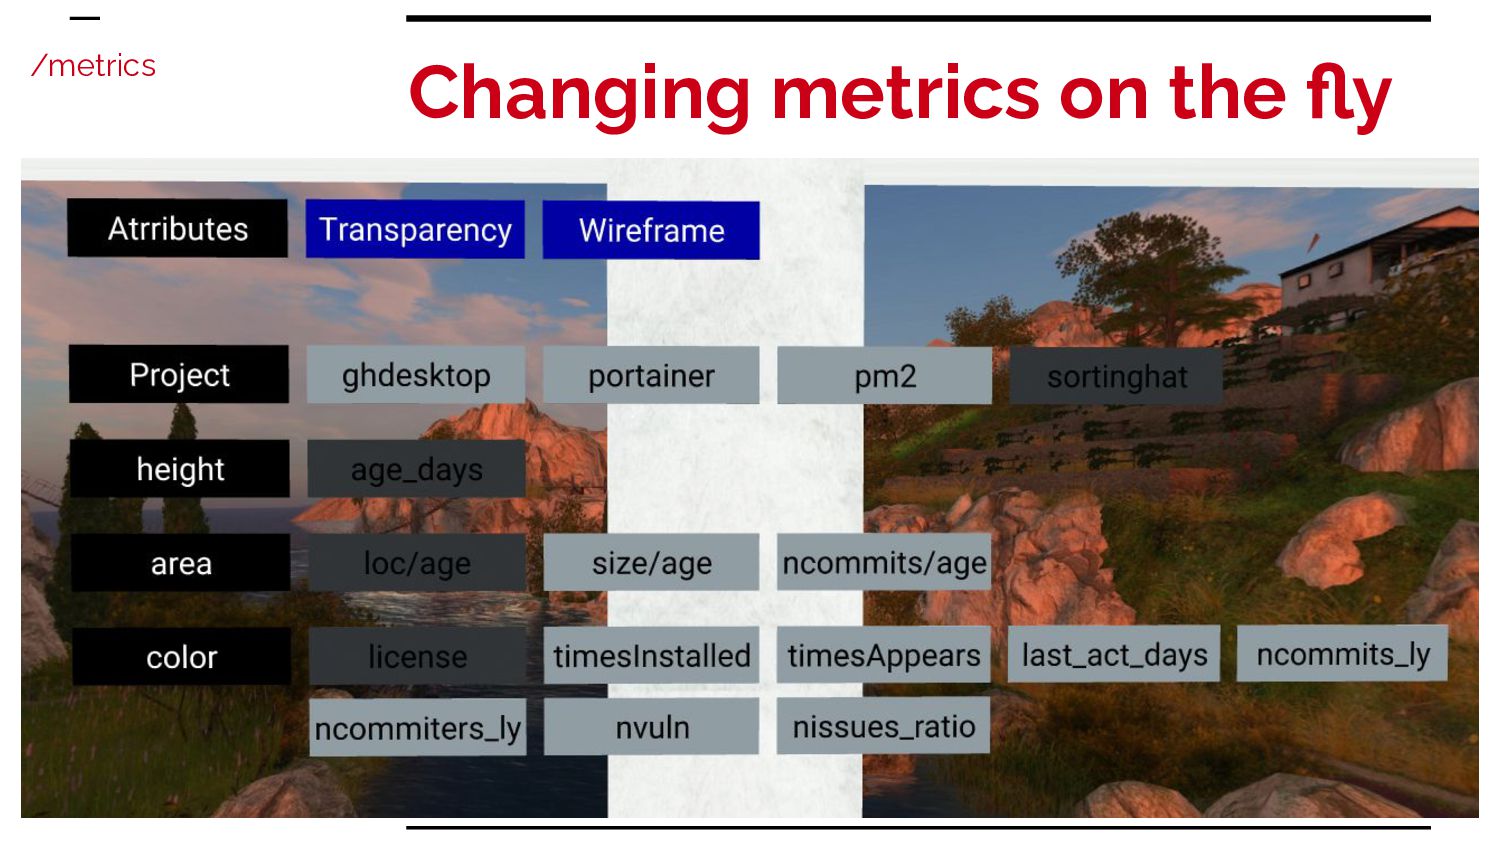
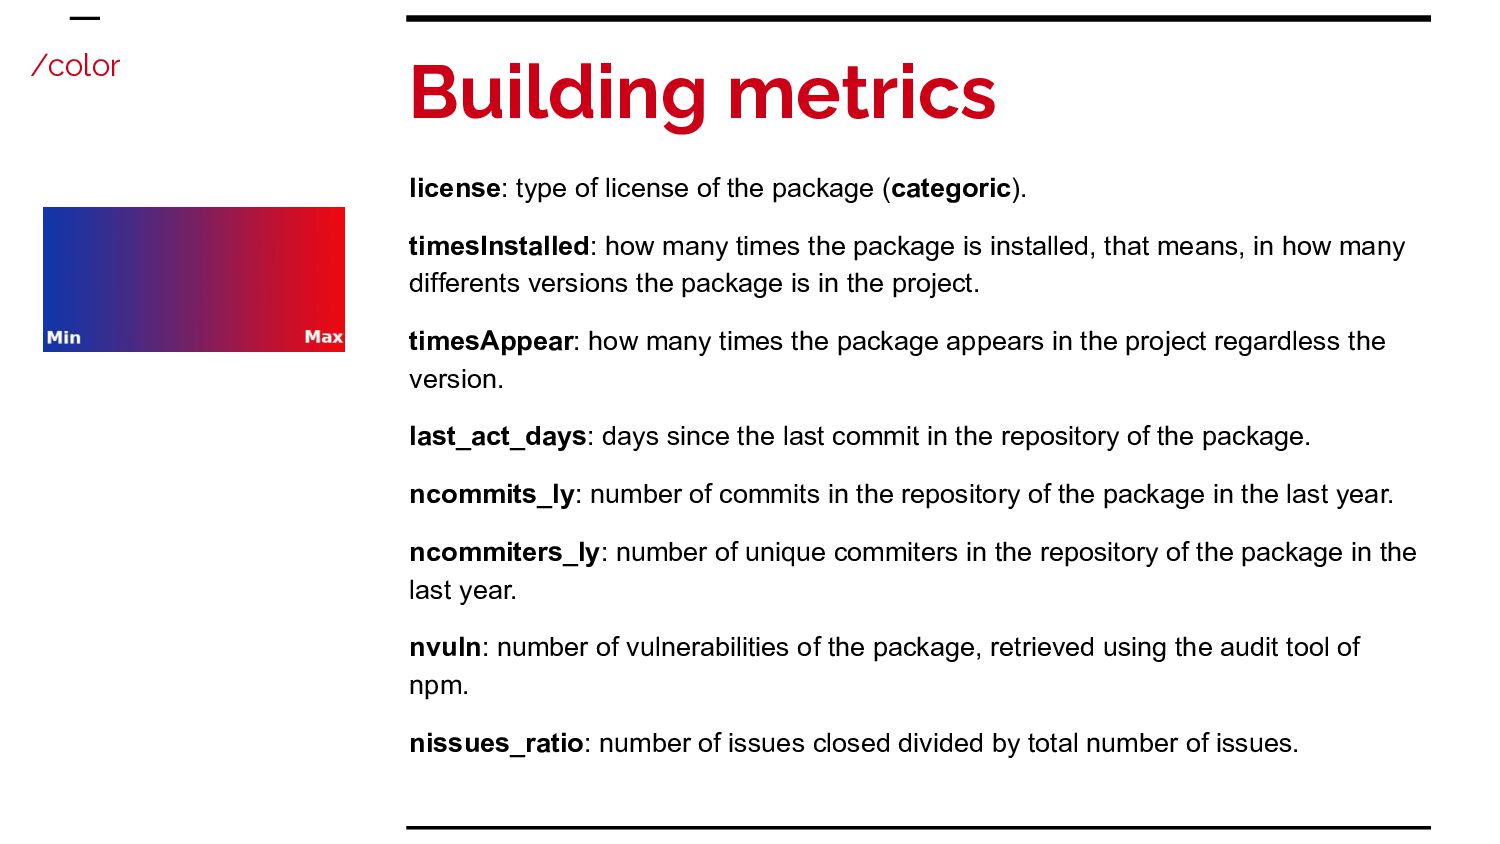
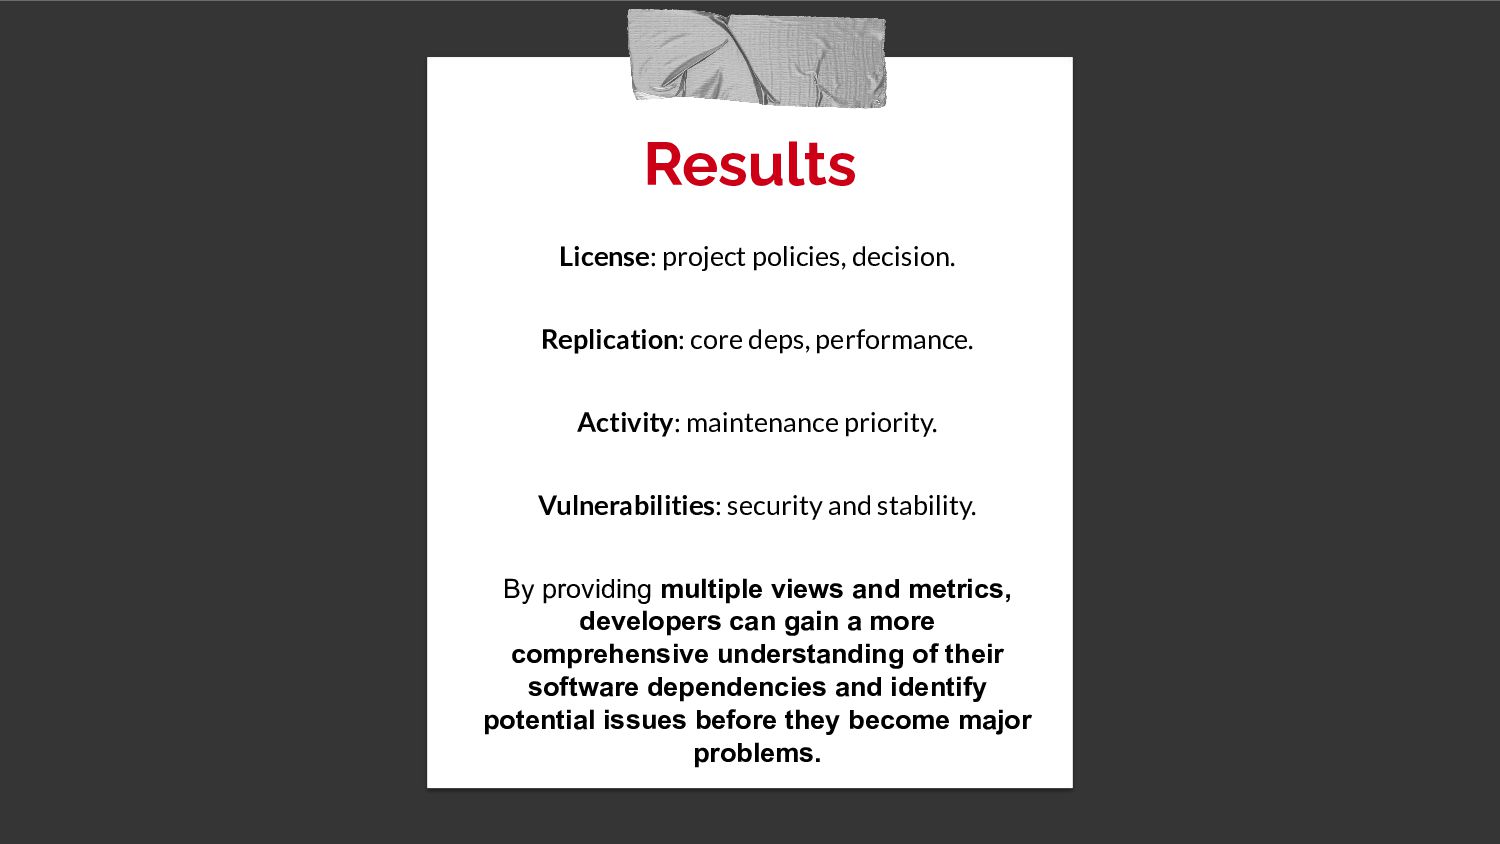
many times the package is installed, that means, in how many differents versions the package is in the project. timesAppear: how many times the package appears in the project regardless the version. last_act_days: days since the last commit in the repository of the package. ncommits_ly: number of commits in the repository of the package in the last year. ncommiters_ly: number of unique commiters in the repository of the package in the last year. nvuln: number of vulnerabilities of the package, retrieved using the audit tool of npm. nissues_ratio: number of issues closed divided by total number of issues. Building metrics /color
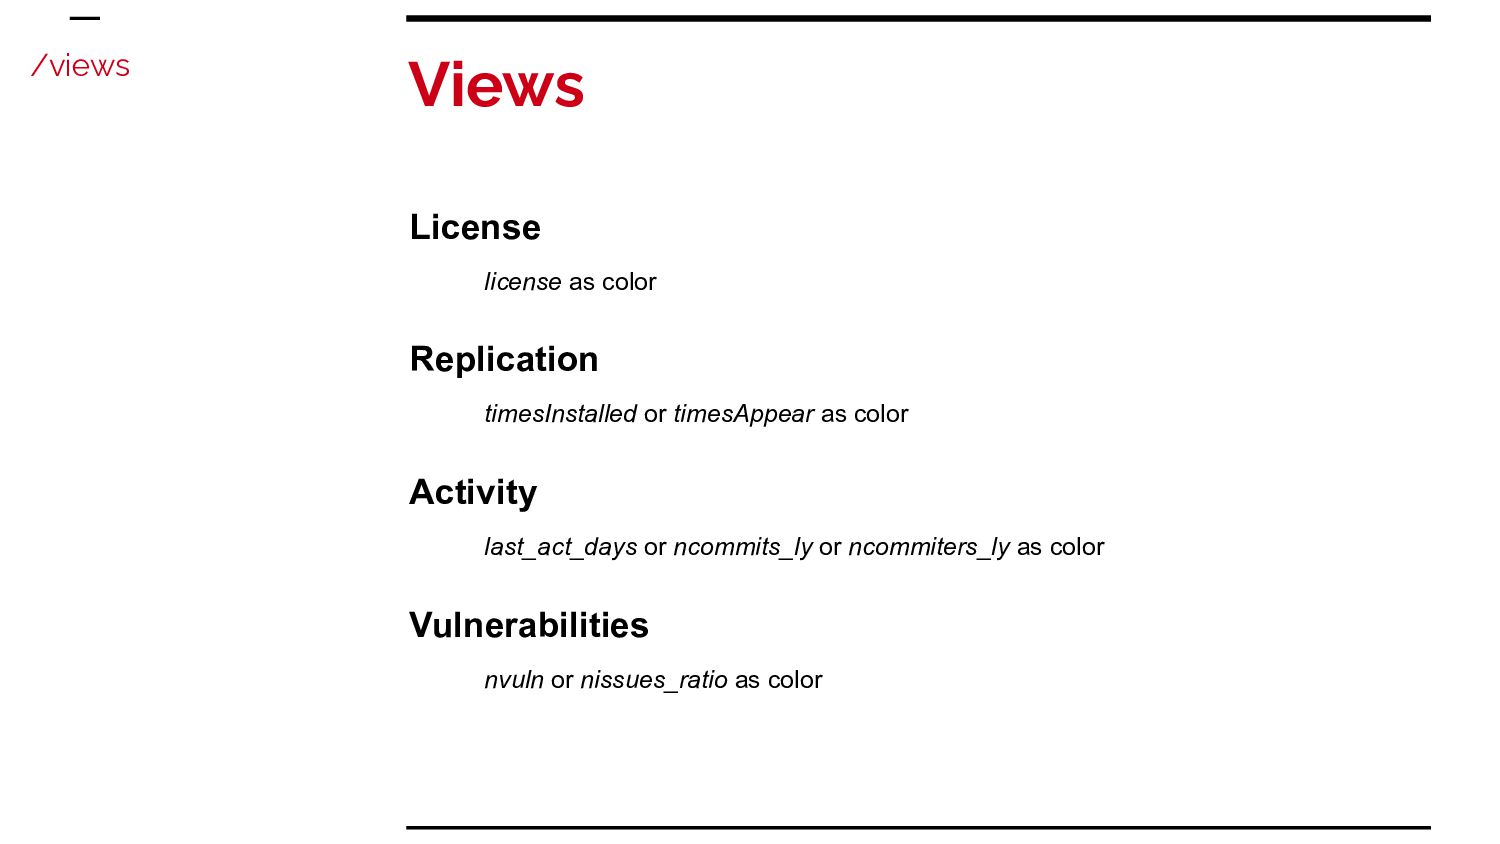
maintenance priority. Vulnerabilities: security and stability. By providing multiple views and metrics, developers can gain a more comprehensive understanding of their software dependencies and identify potential issues before they become major problems.
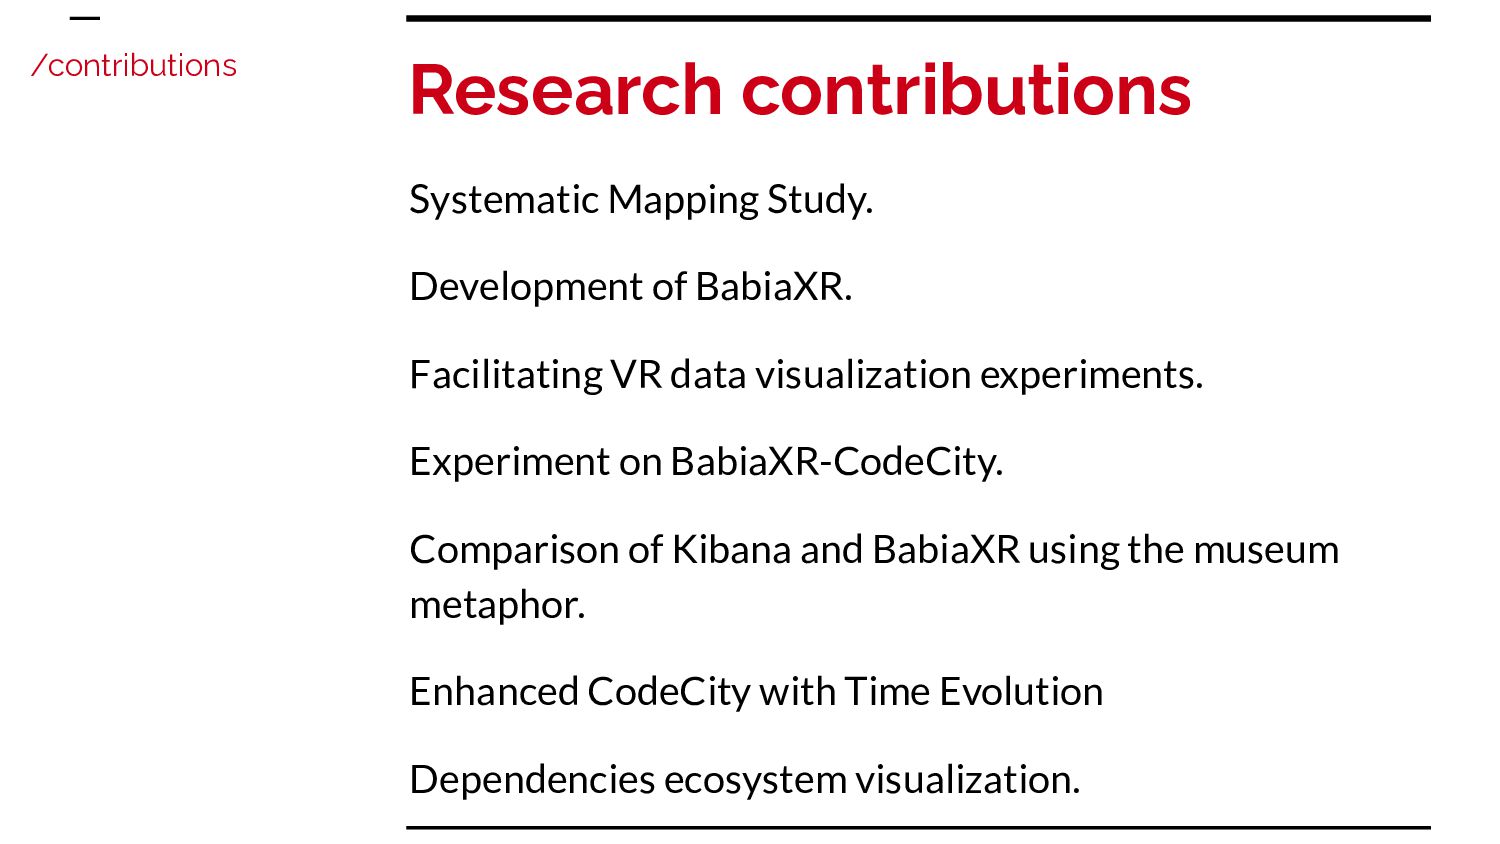
data visualization experiments. Experiment on BabiaXR-CodeCity. Comparison of Kibana and BabiaXR using the museum metaphor. Enhanced CodeCity with Time Evolution Dependencies ecosystem visualization. /contributions
Path for future advancements. Softvis in immersive web environments. Our contributions wanted to have impact on the software visualization research communities. Conclusions
of the Elevated City. Exploration of Augmented Reality (AR) in Software Visualization. Analysis of Alternative Metaphors in VR. General Platform Improvement and Ongoing Research. /future