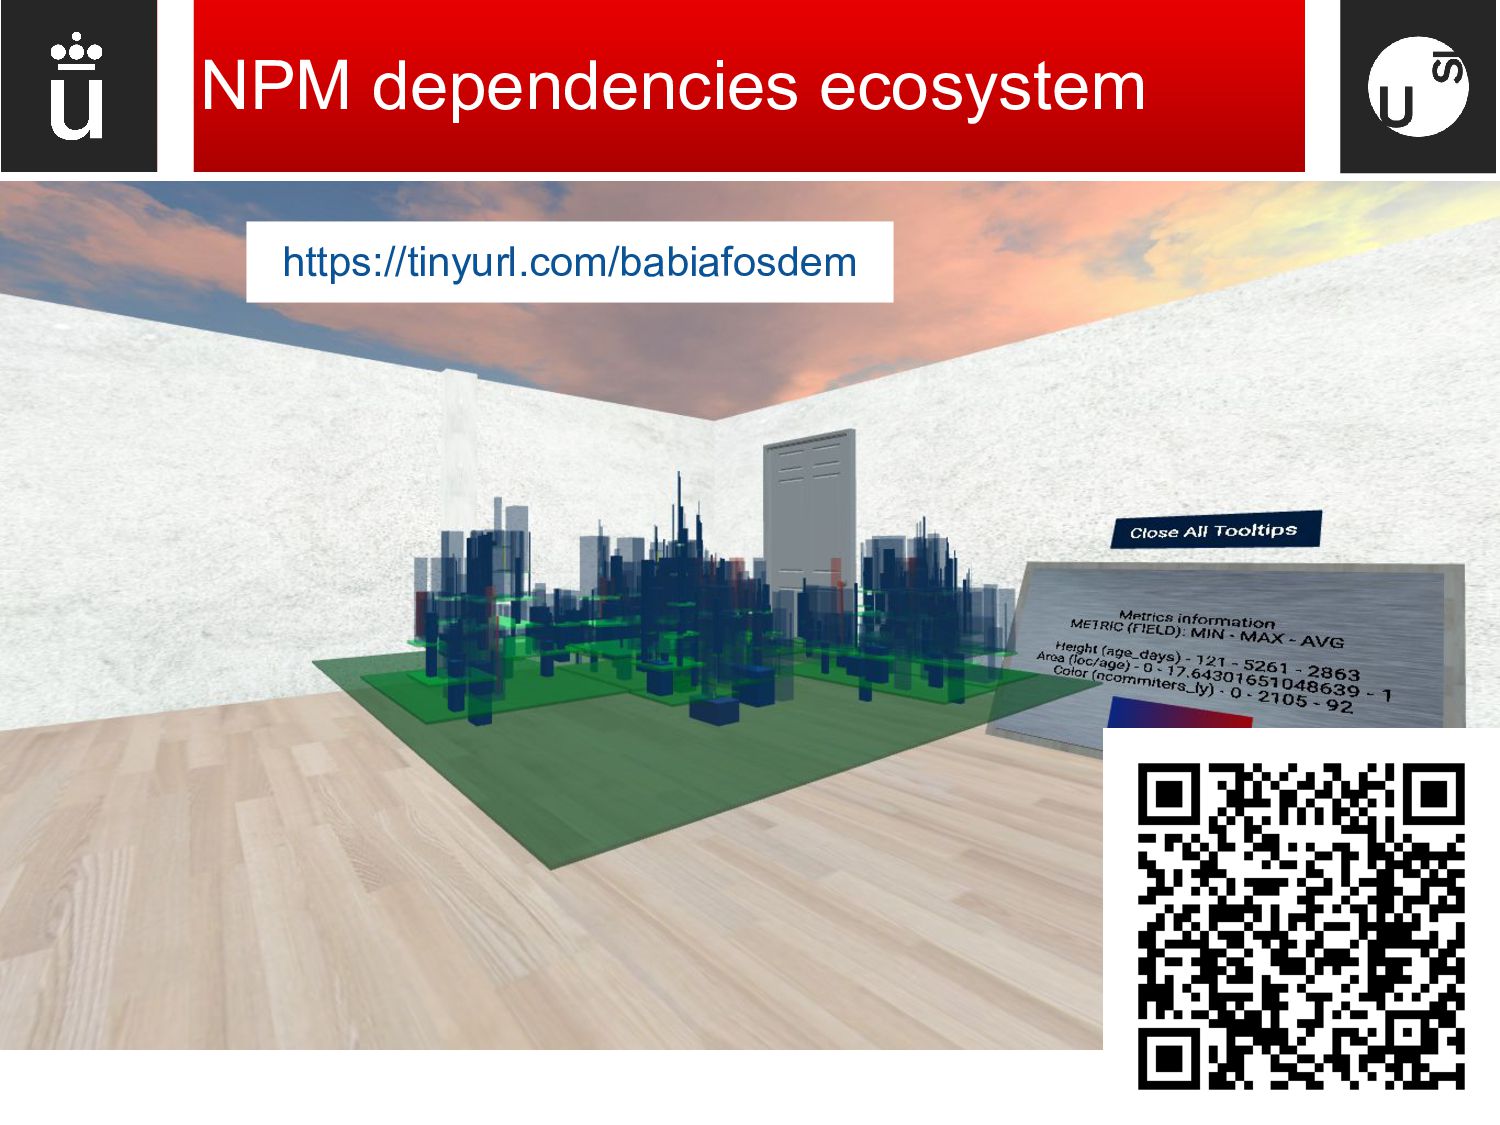
as cities - Building features as metrics (height, area, color) - Building location as position of the artifact in the system hierarchy - Locality, orientation, habitability
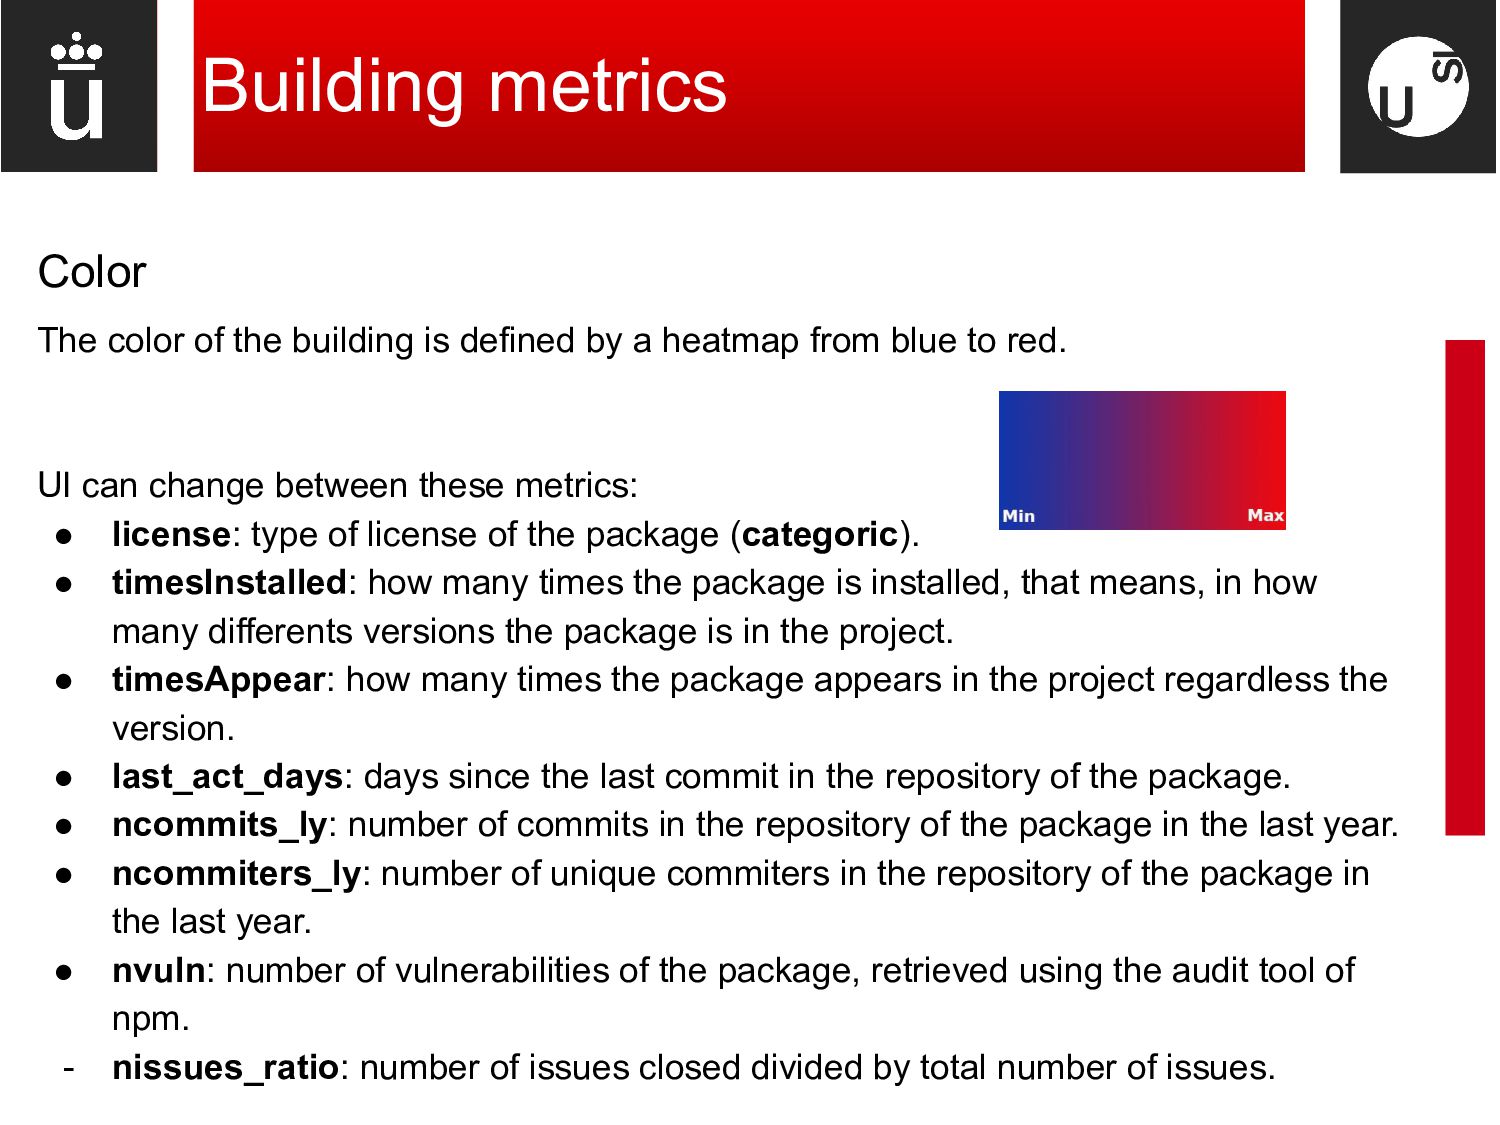
• age_days: package age in total number of days. Area The UI can change between these metrics: • loc/age: lines of code of the package divided by the age in total number of days. • size/age: size in bytes of the package divided by the age in total number of days. • ncommits/age: number of commits of the repository of the package divided by the age in total number of days.
by a heatmap from blue to red. UI can change between these metrics: • license: type of license of the package (categoric). • timesInstalled: how many times the package is installed, that means, in how many differents versions the package is in the project. • timesAppear: how many times the package appears in the project regardless the version. • last_act_days: days since the last commit in the repository of the package. • ncommits_ly: number of commits in the repository of the package in the last year. • ncommiters_ly: number of unique commiters in the repository of the package in the last year. • nvuln: number of vulnerabilities of the package, retrieved using the audit tool of npm. - nissues_ratio: number of issues closed divided by total number of issues.
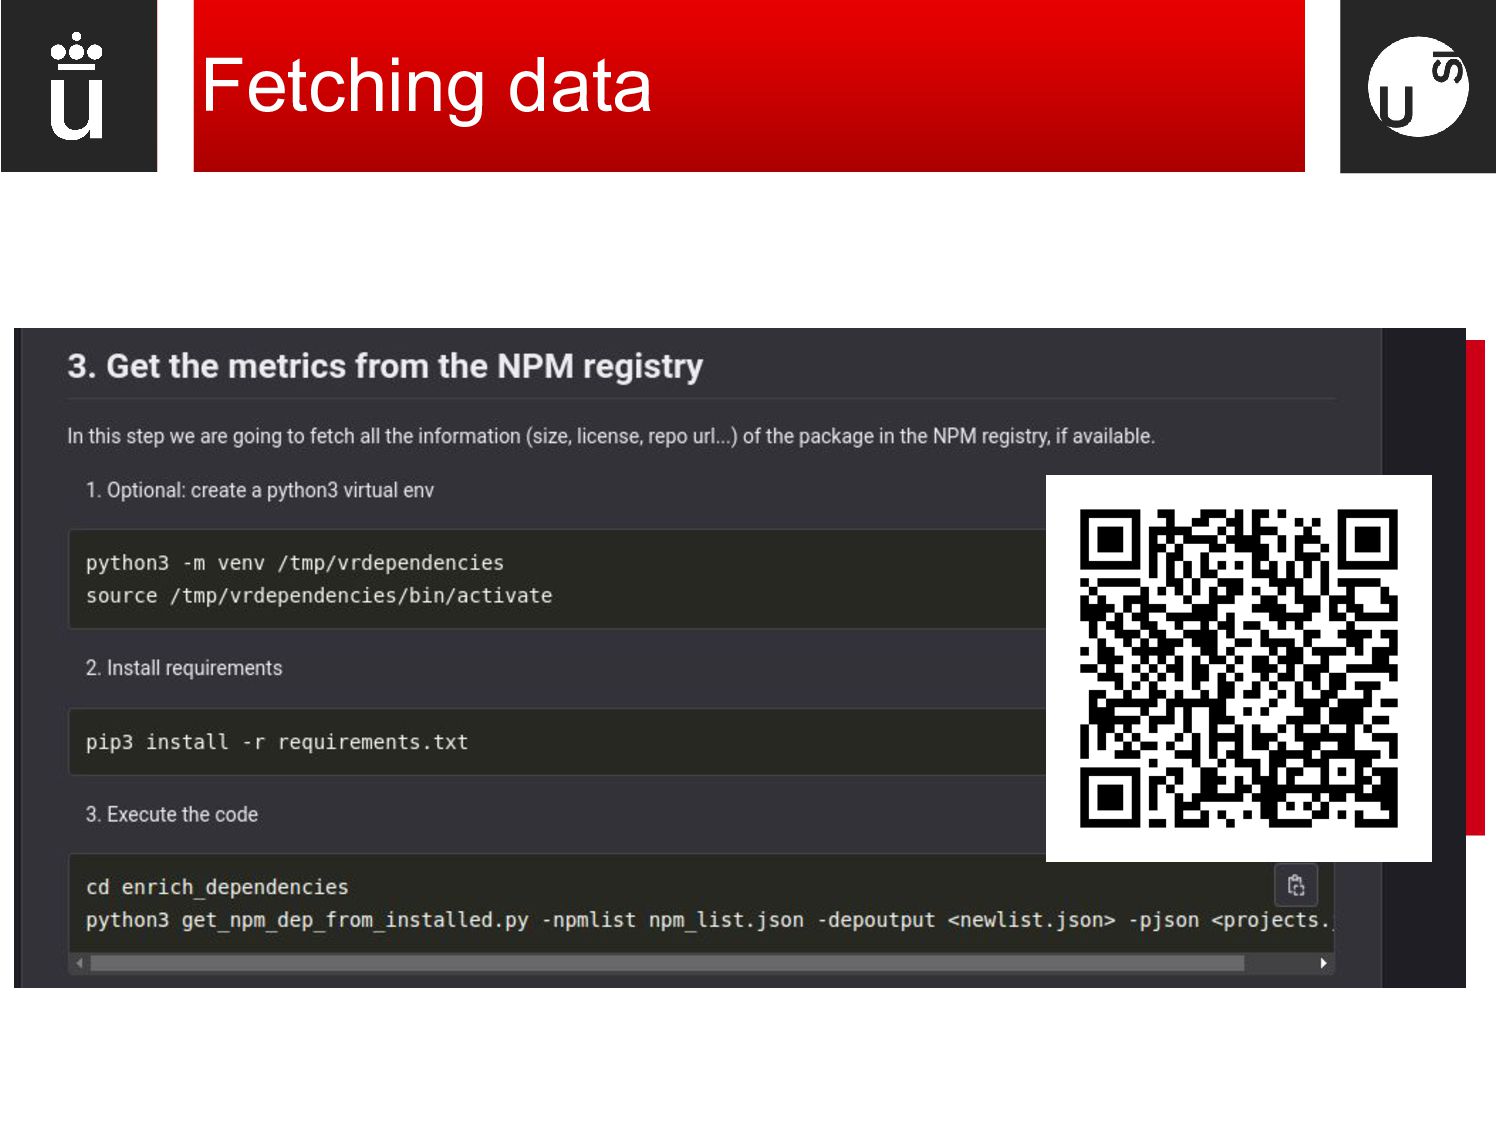
the node project/npm package Data from the NPM registry (license, repo url…) Vulnerabilities metrics Community metrics from the repo Other “physical” metrics (size, loc, etc…)