Upgrade to Pro — share decks privately, control downloads, hide ads and more …

Fastest Servlets in the West

Daniel Mikusa
September 09, 2014

Fastest Servlets in the West

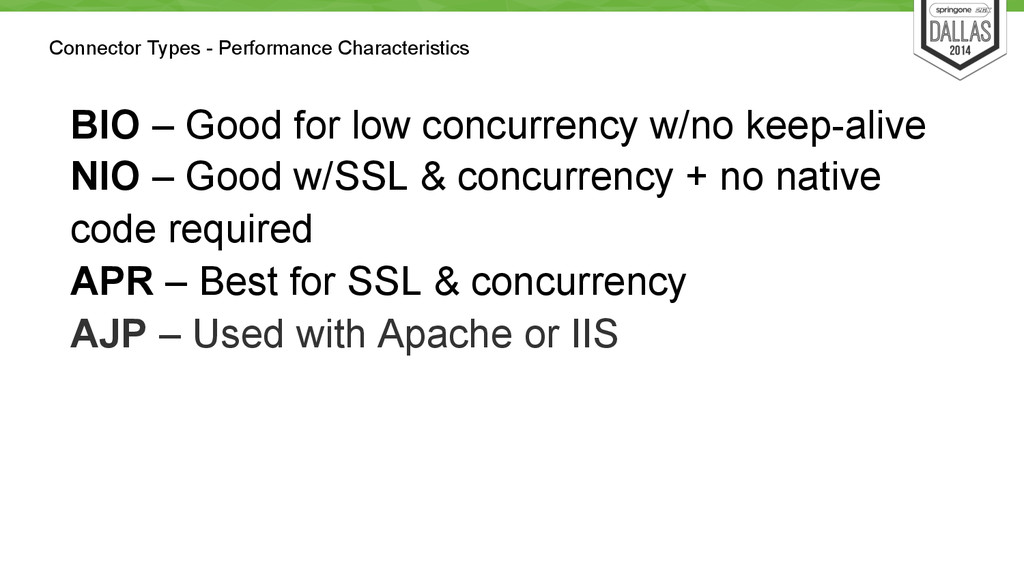
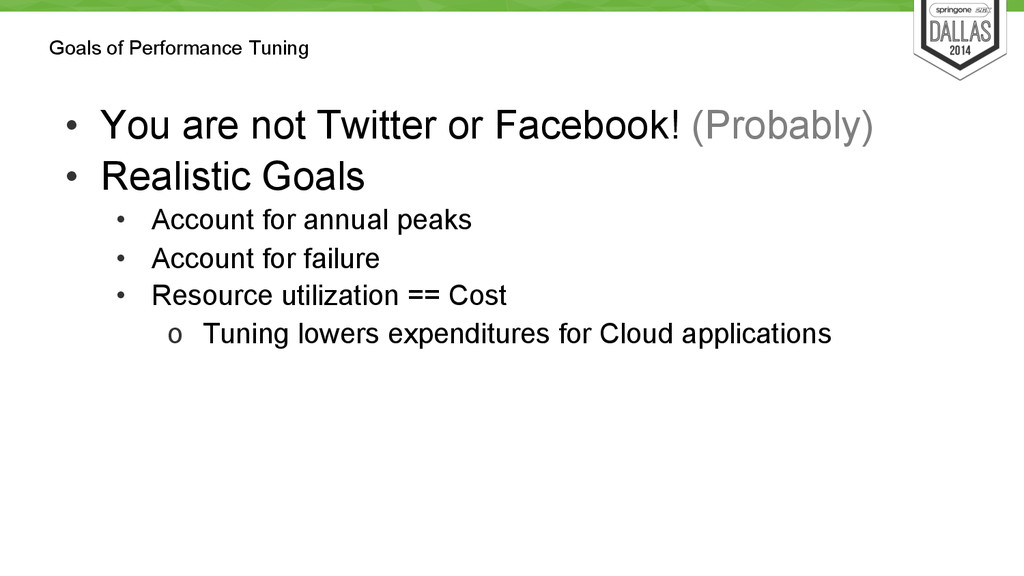
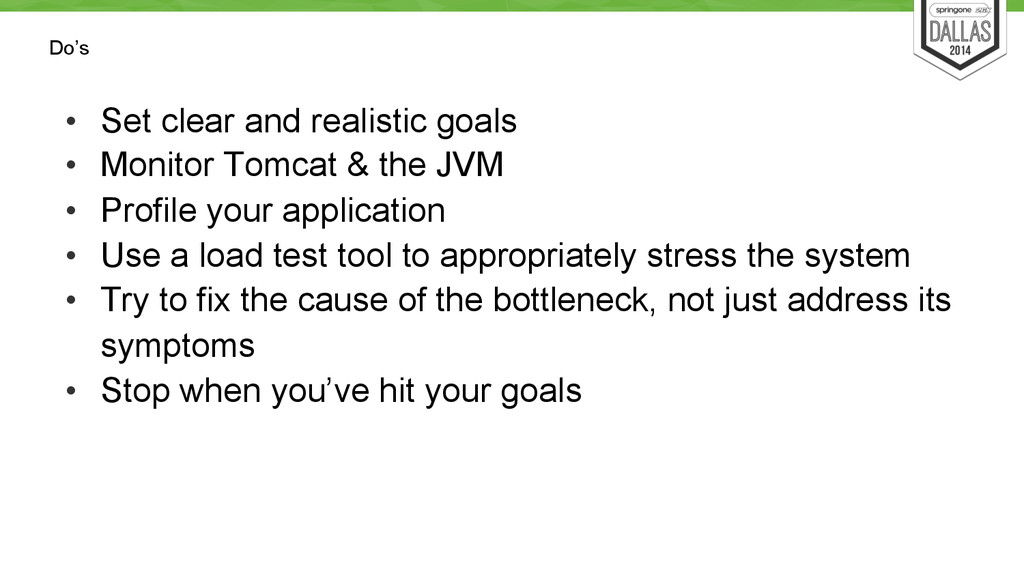
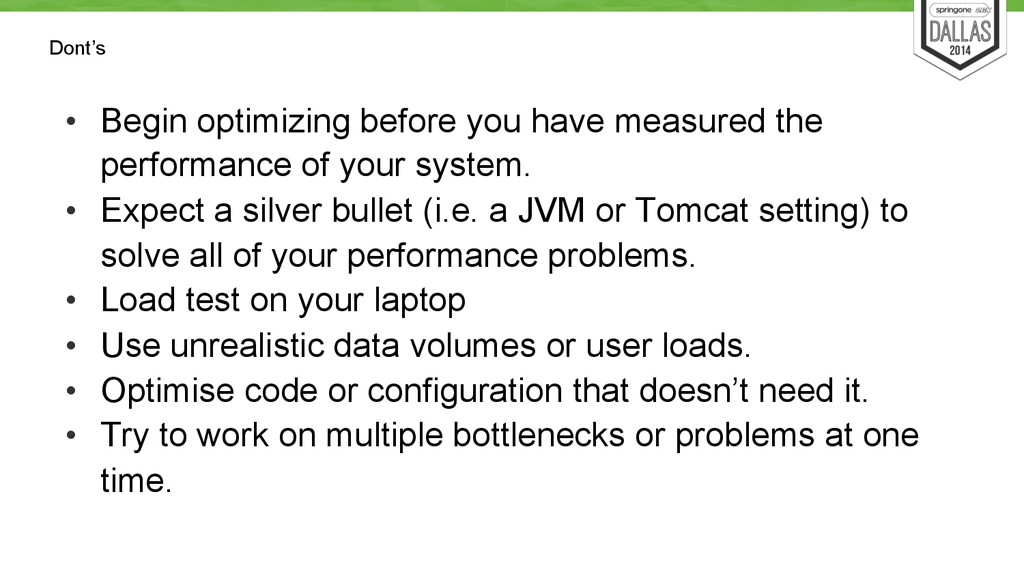
The authors demonstrate Apache Tomcat's stability under high load, describe some do's (and some don'ts!), explain how to performance test a Servlet-based application, troubleshoot and tune the container and your application and compare the performance characteristics of the different Tomcat connectors.

Daniel Mikusa

September 09, 2014
Tweet

More Decks by Daniel Mikusa

Other Decks in Technology

Transcript

  1. Daniel Mikusa [email protected] •  Contributing Author on TomcatExpert.com •  Senior

    Technical Support Engineer at Pivotal –  Tomcat / tc Server –  Spring Framework –  CloudFoundry @dmikusa Stuart Williams [email protected] •  A committer on open source projects at Apache, Eclipse and elsewhere •  Software Engineer at Pivotal –  RTI project lead @pidster Presenter Bios
  2. Introduction •  Not a talk about Tomcat being the fastest

    •  IS a talk about how to make your Servlets & applications perform well under load •  It’s easier than you may think
  3. Apache Tomcat •  History •  Started at Sun as the

    RI for Servlet & JSP specs •  Donated to the ASF in 1999, became top level project in 2005 •  First ASF release was 3.0, now up to 8.0 •  All versions implement Servlet & JSP specs. •  EL was added with 6. •  WebSockets in 7 & 8 •  Trend towards lightweight increasing adoption
  4. We have some questions for you… •  Who’s brought a

    Tomcat app to production? •  Who maintains a production Tomcat today? •  What is the average load? •  Daily active users? •  Daily active sessions? •  Requests… o  per day, per hour, per second*? * Prize for the provably largest!
  5. Architecture Overview •  Server is the top level structure, it

    represents the entire container. •  A Server can have multiple Services. •  A Service is the combination of an engine and one or more connectors •  An Engine represents the request processing machinery of the service. Takes in requests, returns responses. •  An Engine can have multiple Hosts (i.e. virtual hosts). •  Each Host can have multiple Contexts (i.e. applications). •  Elements marked in red in the diagram are only valid at that level. Other elements can be used at that level or below. Cluster is the exception, not being valid in the Context. Server Listeners Global Resources Services Connectors Engine Realms Cluster Hosts Valves Contexts Executor Loader Manager Resources Servlets
  6. Architecture Overview •  Server is the top level structure, it

    represents the entire container. •  A Server can have multiple Services. •  A Service is the combination of an engine and one or more connectors •  An Engine represents the request processing machinery of the service. Takes in requests, returns responses. •  An Engine can have multiple Hosts (i.e. virtual hosts). •  Each Host can have multiple Contexts (i.e. applications). •  Elements marked in red in the diagram are only valid at that level. Other elements can be used at that level or below. Cluster is the exception, not being valid in the Context. Server Listeners Global Resources Services Connectors Engine Realms Cluster Hosts Valves Contexts Executor Loader Manager Resources Servlets Global Resources Connectors Executor Loader Manager
  7. Request Execution Path •  Connectors are tunable •  Engine –

    not tunable •  Valve Pipeline •  Host, Context, Servlet are not tunable •  Your application is tunable Connector Engine Host Context Servlet
  8. Performance configuration and tuning for Tomcat •  Three main areas

    to focus 1.  Memory and OS o  JVM and GC config o  Open file handles, ulimit & TCP socket buffers 2.  Connectors o  Type o  Config – e.g. thread count 3.  Application
  9. A simplified view of the a JVM’s Process Heap. Java

    Object Heap Young Generation Old Generation Perm Gen (Java 6 & 7) Meta Space (Java 8) Native Code Compiler, GC, ... Thread Stacks Eden Survivor Spaces Non-Heap
  10. More questions… •  Who has seen an OOM in production?

    •  Was it ‘unfortunate’ configuration or … •  … just not enough memory? •  … or did you just delay the OOM? •  Was it a leak in the application? •  Was it a leak in Tomcat?
  11. Basic rules for memory tuning: 1.  Start with the defaults,

    they will get you surprisingly far 2.  Don’t play the guessing game! Know what you’re changing and what you expect the change to do (i.e. RTFM) 3.  Change one setting at a time
  12. Basic rules for memory tuning: 4.  Don’t change setting solely

    based on a someone’s StackOverflow, blog or forum post. What works for them might not work for you. Also see #2. 5.  Monitor your application’s memory usage either via JMX or via GC logs. 6.  Test your app, observe the results, adjust memory settings, repeat.
  13. Memory & OS tuning considerations •  Request handling objects are

    pooled & reused •  Plain old Tomcat uses very little memory •  Connection counts •  Sockets use memory too •  Incorrect socket buffer size can cause serious instability
  14. The most common memory switches •  -Xmx •  Maximum object

    heap size •  -Xms •  Initial object heap size •  -Xmn, -XX:NewSize & -XX:NewRatio •  New or young generation sizes
  15. The most common memory switches •  -XX:PermSize & -XX:MaxPermSize (Java

    6 & 7) •  Initial & max sizes of PermGen space •  -XX:MetaspaceSize & -XX:MaxMetaspaceSize (Java 8) •  Initial & max sizes of Metaspace •  -Xss & -XX:ThreadStackSize •  Size of the thread stack for each thread created by the JVM
  16. Connector Types BIO Oldest, battle-tested connector Blocking, one thread per

    connected user NIO New default in Tomcat 8 Non-blocking NIO2 New in Tomcat 8 (Experimental) Uses JVM’s NIO2, Non-blocking APR Native implementation Non-blocking AJP Separate BIO, NIO, NIO2& APR implementations
  17. Connector Types HTTP AJP BIO 3.x 3.x NIO 6.0.x 7.0.x

    NIO2 8.0.x 8.0.x APR 5.5.x 5.5.x
  18. Connector Types - Performance Characteristics BIO – Good for low

    concurrency w/no keep-alive NIO – Good w/SSL & concurrency + no native code required APR – Best for SSL & concurrency AJP – Used with Apache or IIS
  19. How to Test Your Application •  Unit Tests •  Make

    sure it works first •  Integration Tests •  Embedded Tomcat instances can be very useful •  System / Performance Tests •  Deploy your application in a production-like environment o  Means similar network, CPU, RAM, disk type o  This is not negotiable
  20. Performance Testing Basics •  Your application •  Needs resources o 

    1 wobbly old spare server is Not A Good Choice •  Load Generator •  Needs resources o  1 wobbly old spare server is Still Not A Good Choice •  Use Open Source o  Commercial tools usually have per-seat licenses
  21. Performance Testing Process •  Start with a working / properly

    configured system. •  Determine your performance goals (i.e. how “fast”) •  Measure the current performance •  Examine metrics & data gathered to determine bottlenecks •  Determine and implement a fix •  Repeat until all performance goals are met
  22. Goals of Performance Tuning •  You are not Twitter or

    Facebook! (Probably) •  Realistic Goals •  Account for annual peaks •  Account for failure •  Resource utilization == Cost o  Tuning lowers expenditures for Cloud applications
  23. •  Test the performance of basic Tomcat features •  Iterate

    with small changes to see how they impact performance •  Throw a consistent amount of load at the server, monitor CPU usage Test Goals
  24. The Setup •  Tomcat 8.0.12 - running on one server

    with the default configuration & OpenJDK 7 •  Two clients - sending requests with ab •  Running on DigitalOcean VMs - 2CPUs, 2GB RAM, communicating on 1Gbps private LAN •  Tests with APR - libapr 1.5.1, libopenssl 1.0.1f (Ubuntu) •  Full configurations available from our Github repo
  25. Tests •  Test #1 - Small static file (32KB), served

    up with NIO connector •  Test #2 - Small static file (32KB), client using keep-alive •  Test #3 - Medium static file (107KB), served up with NIO connector •  Test #4 - Large static file (5MB), served up with NIO connector •  Test #5 - Small static file (32KB), served up with NIO over SSL •  Test #6 - Small static file (32KB), served up with APR connector •  Test #7 - Small static file (32KB), served up with APR connector over SSL
  26. Test #1 - 1555.40 & 1550.46 Test #2 - 1805.74

    & 1874 Test #3 - 422.51 & 422.02 Test #4 - 11.15 & 11.15 Test #5 - 474.77 & 476.71 Test #6 - 1810.40 & 1821.67 Test #7 - 1221.21 & 1199.73 Tests Interesting Comparisons… #1 & #2 - requests / sec go up when client uses keep-alive #1 & #3 (or #4) - requests / sec go down with bigger file #1 & #5 - requests / sec drop when SSL is in uses #1 & #6 - requests / sec go up when using APR #5 & #7 - impact of SSL is not as bad when using APR All of these are expected The Numbers - Requests Per Second (avg)
  27. The Numbers - 99% Percentile Tests Test #1 - 42ms

    & 43ms Test #2 - 46ms & 46ms Test #3 - 300ms & 304ms Test #4 - 60571ms & 60841ms Test #5 - 1210ms & 1041ms Test #6 - 33ms & 32ms Test #7 - 158ms & 166ms Interesting comparisons… •  #1 & #3 (or #4) - takes longer to serve larger files (duh) •  #1 & #5 - takes longer to serve SSL •  #1 & #6 - APR serves files faster •  #5 & #7 - Impact of SSL
  28. What Else? •  Runs tests against the BIO connector • 

    Adjust the number of concurrent connections sent by our clients •  Test with dynamic content (i.e servlet or JSP) •  Monitor CPU usage or other statistics through the tests •  Use a different client (instead of ab) to have more control over the requests
  29. Use a Profiler •  VisualVM •  Load the plugins • 

    MBean, Memory Pools, Buffer Pools, VisualGC •  Java Mission Control •  Since 7u40 •  YourKit •  Other commercial products are available •  JMH (for serious, lower level testing)
  30. What to Tune •  Your Application •  Connectors •  Type

    •  Threads & Connections •  Logging •  Disable logging to console handler •  FileHandler vs AsyncFileHandler •  Memory •  Heap, Eden & Survivor
  31. What to Tune •  Your application has… •  3rd party

    libraries •  Database connections •  Message queues •  Other services •  (REST, SOAP, etc…) •  Thread pools
  32. What to Tune With applications performing “real” work, time spent

    in the application will greatly overshadow time spent working by Tomcat.
  33. Do’s •  Set clear and realistic goals •  Monitor Tomcat

    & the JVM •  Profile your application •  Use a load test tool to appropriately stress the system •  Try to fix the cause of the bottleneck, not just address its symptoms •  Stop when you’ve hit your goals
  34. Dont’s •  Begin optimizing before you have measured the performance

    of your system. •  Expect a silver bullet (i.e. a JVM or Tomcat setting) to solve all of your performance problems. •  Load test on your laptop •  Use unrealistic data volumes or user loads. •  Optimise code or configuration that doesn’t need it. •  Try to work on multiple bottlenecks or problems at one time.