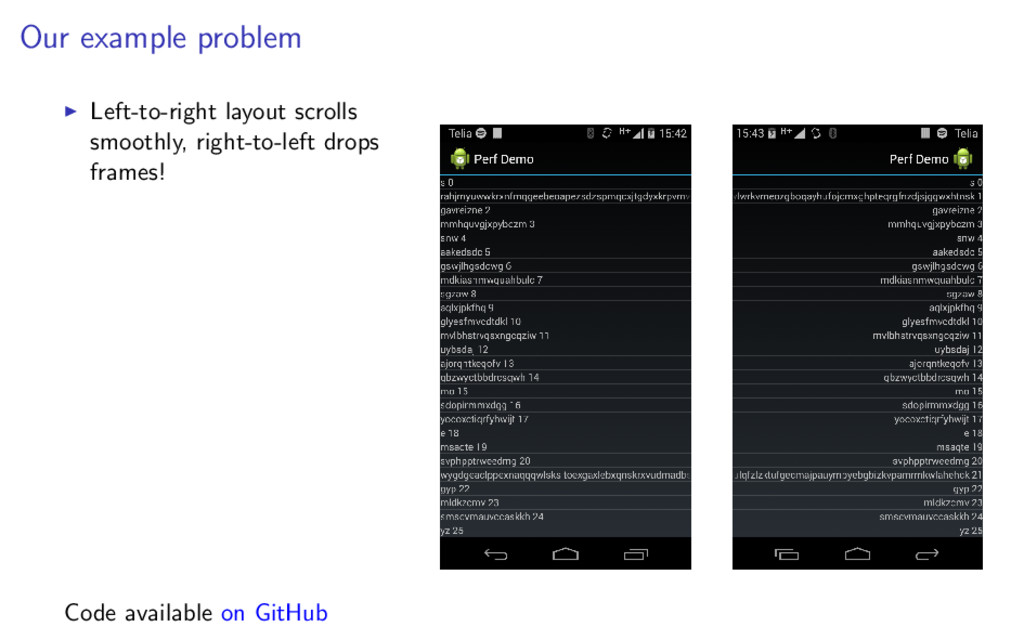
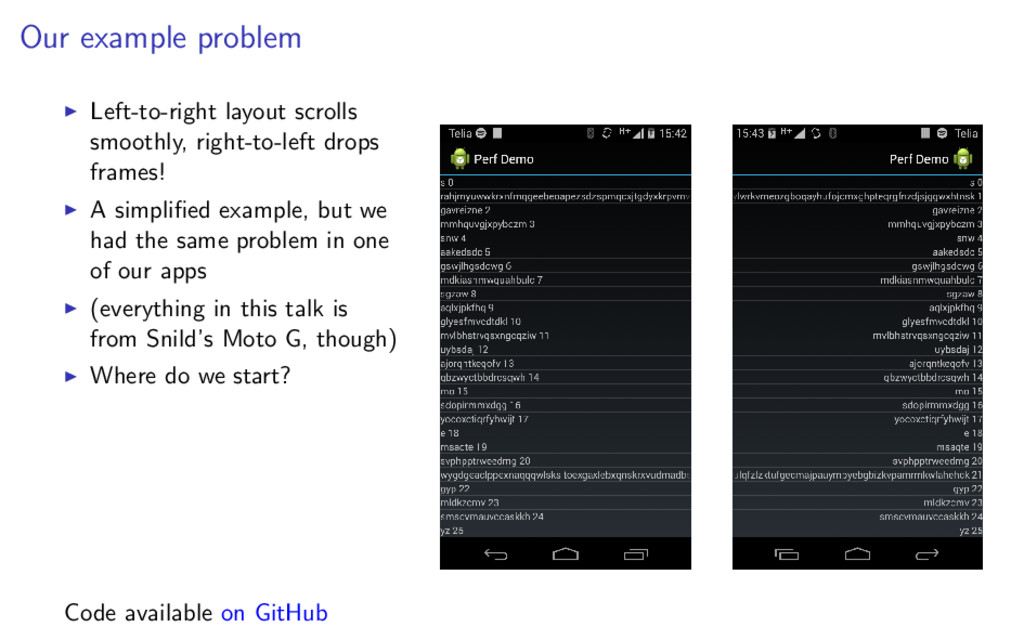
A simplified example, but we had the same problem in one of our apps (everything in this talk is from Snild’s Moto G, though) Where do we start? Code available on GitHub
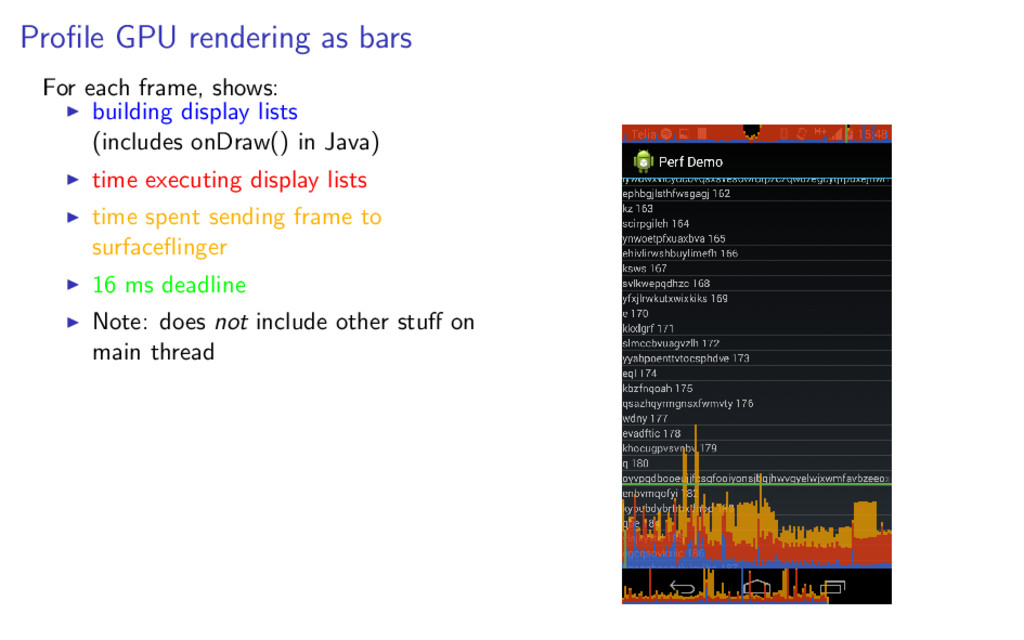
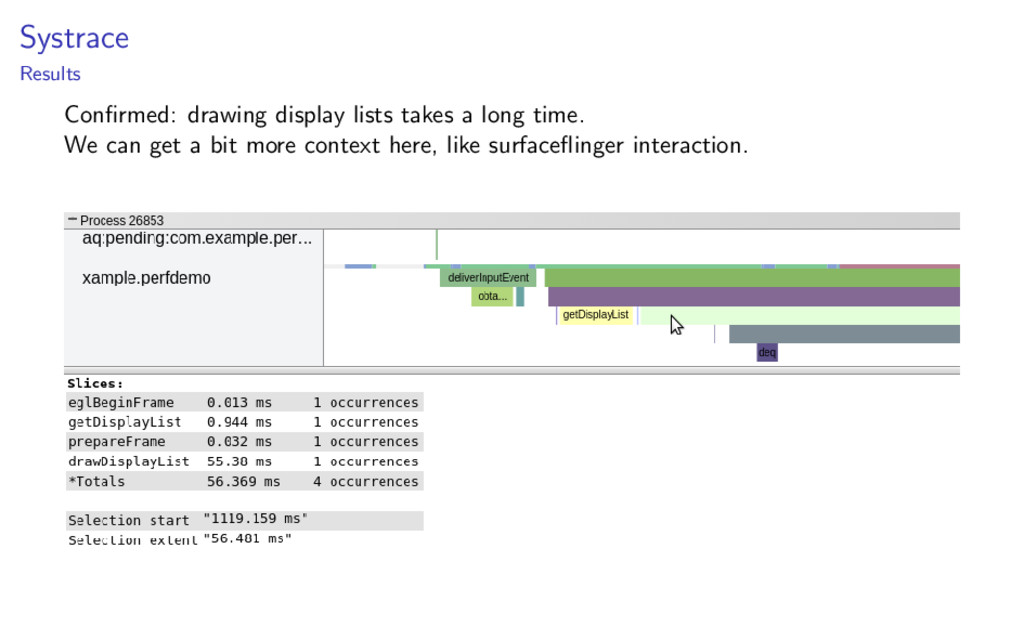
display lists (includes onDraw() in Java) time executing display lists time spent sending frame to surfaceflinger 16 ms deadline Note: does not include other stuff on main thread
display lists (includes onDraw() in Java) time executing display lists time spent sending frame to surfaceflinger 16 ms deadline Note: does not include other stuff on main thread
display lists (includes onDraw() in Java) time executing display lists time spent sending frame to surfaceflinger 16 ms deadline Note: does not include other stuff on main thread
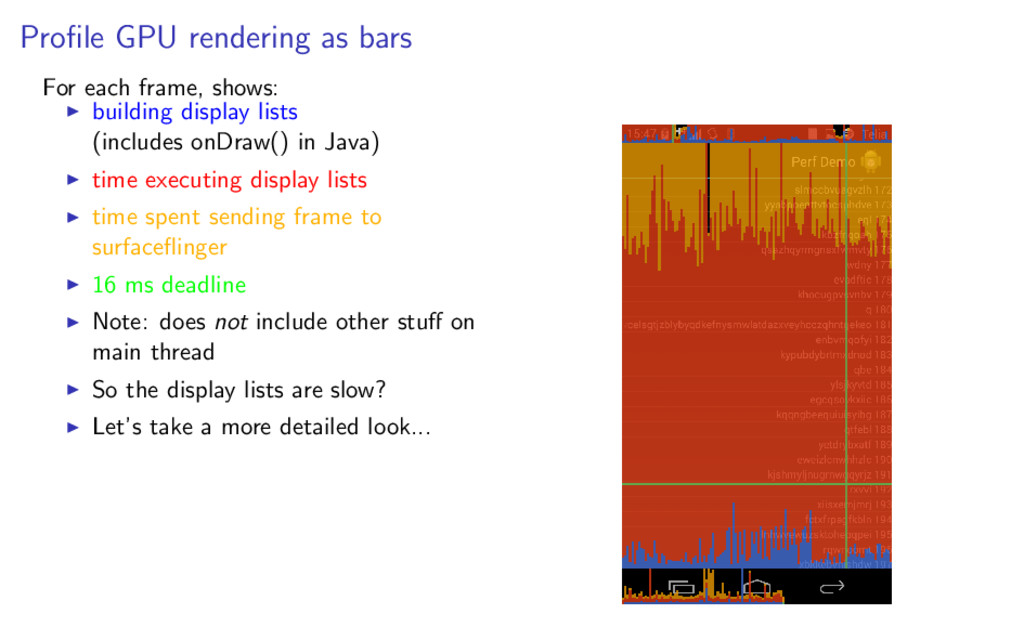
display lists (includes onDraw() in Java) time executing display lists time spent sending frame to surfaceflinger 16 ms deadline Note: does not include other stuff on main thread So the display lists are slow? Let’s take a more detailed look...
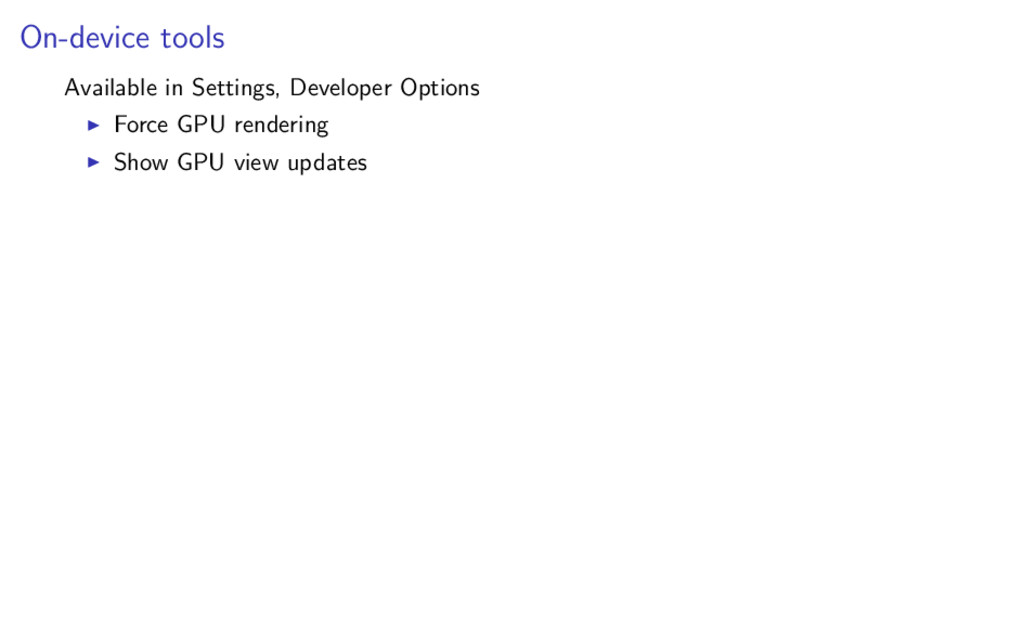
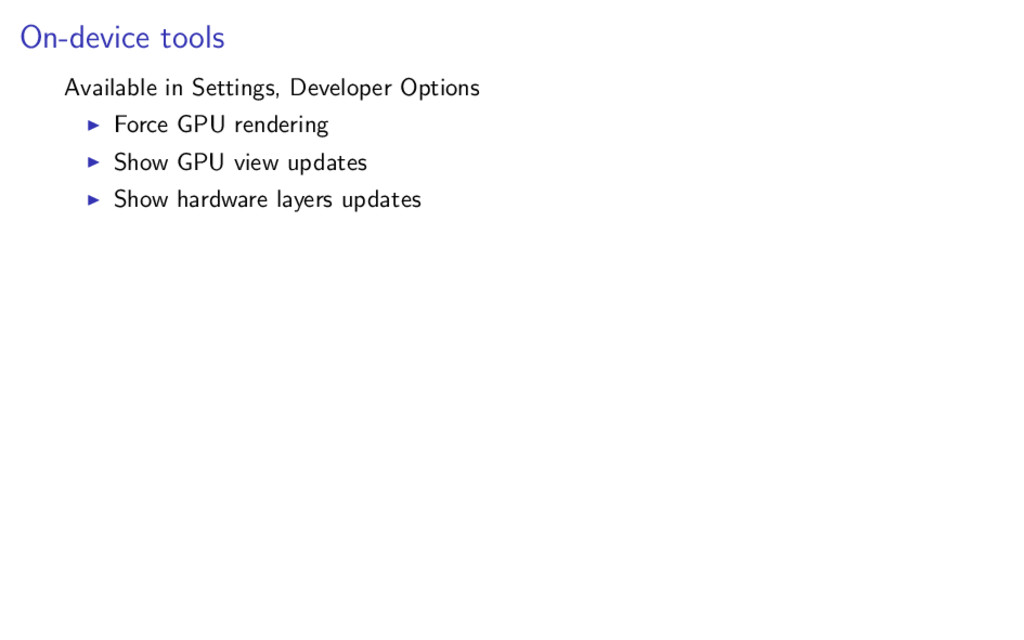
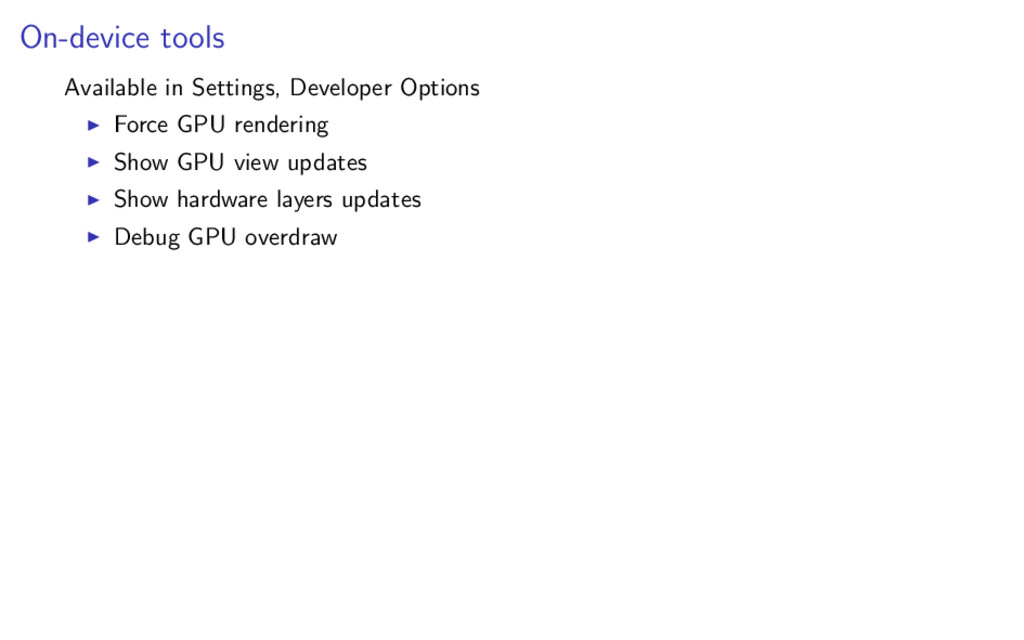
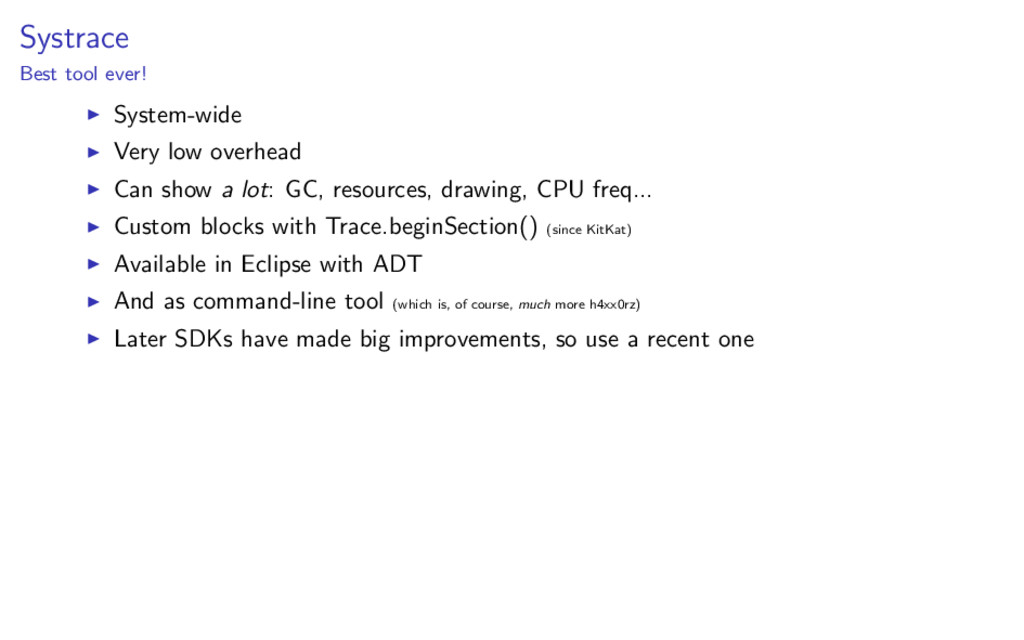
a lot: GC, resources, drawing, CPU freq... Custom blocks with Trace.beginSection() (since KitKat) Available in Eclipse with ADT And as command-line tool (which is, of course, much more h4xx0rz) Later SDKs have made big improvements, so use a recent one
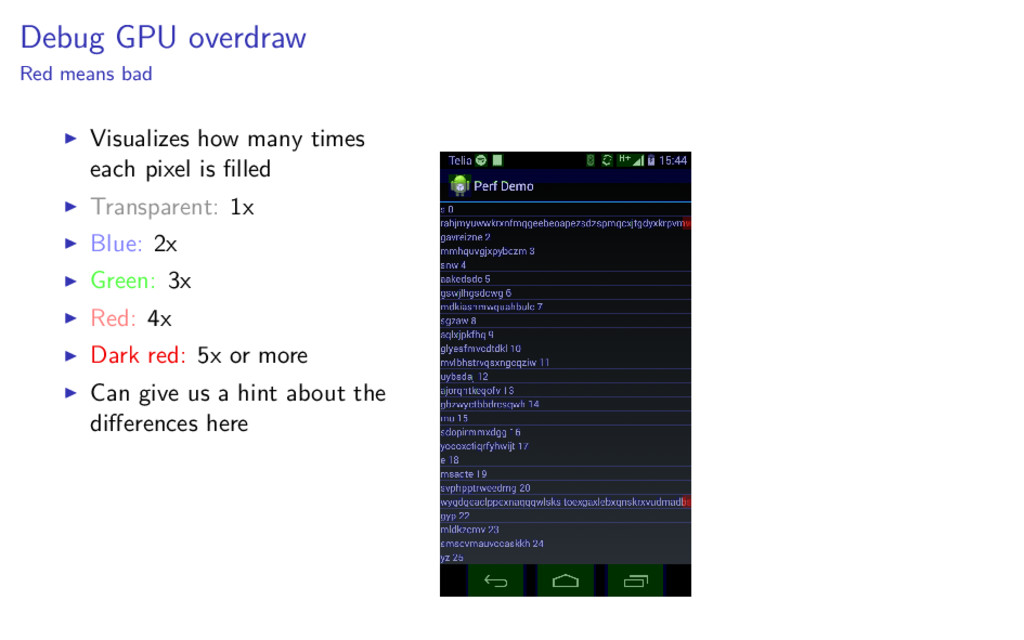
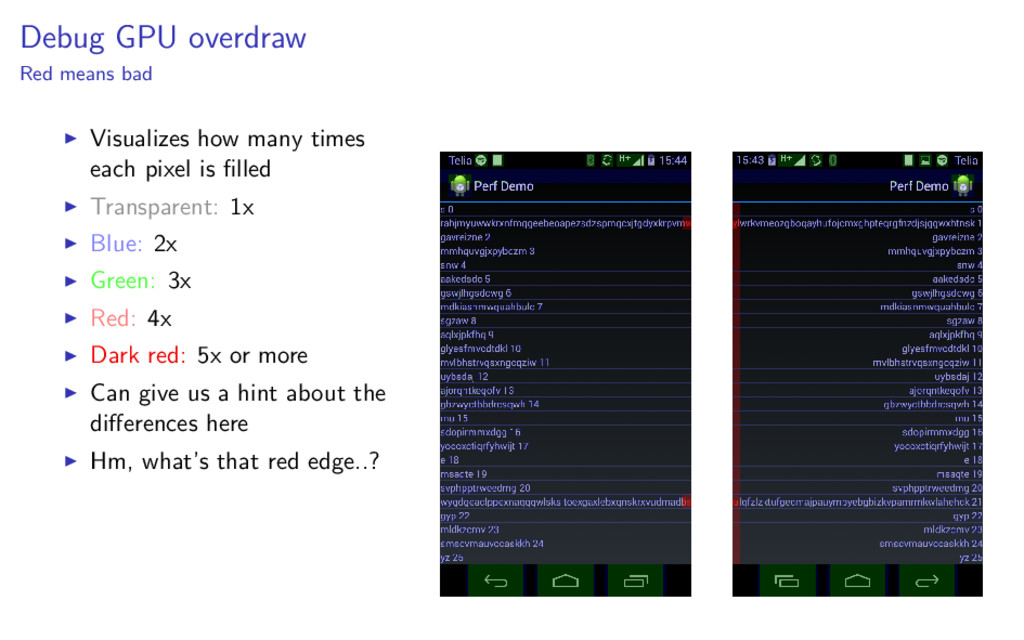
each pixel is filled Transparent: 1x Blue: 2x Green: 3x Red: 4x Dark red: 5x or more Can give us a hint about the differences here Hm, what’s that red edge..?
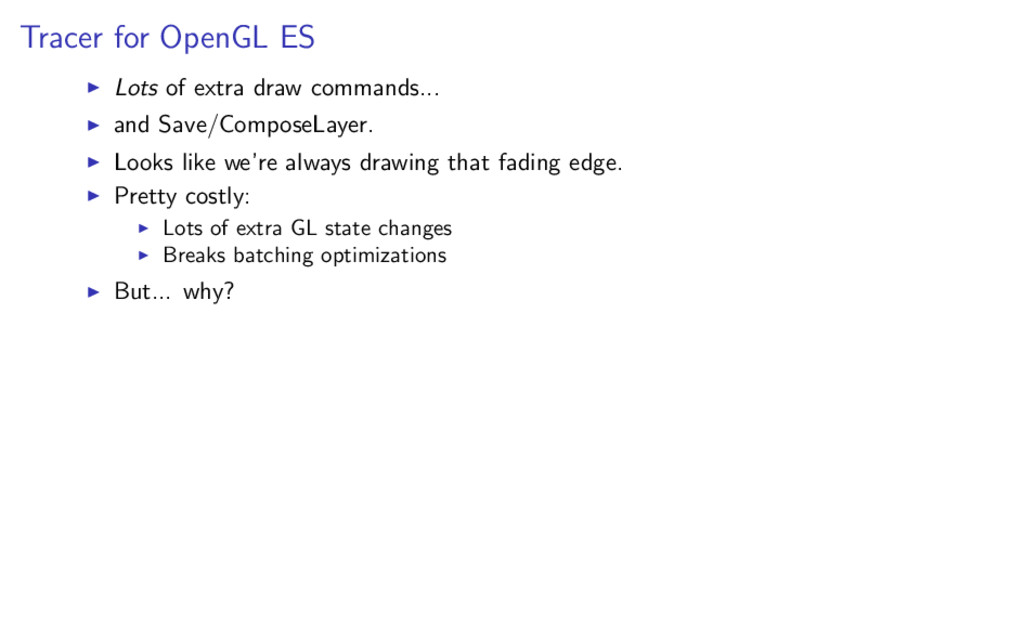
Save/ComposeLayer. Looks like we’re always drawing that fading edge. Pretty costly: Lots of extra GL state changes Breaks batching optimizations But... why?
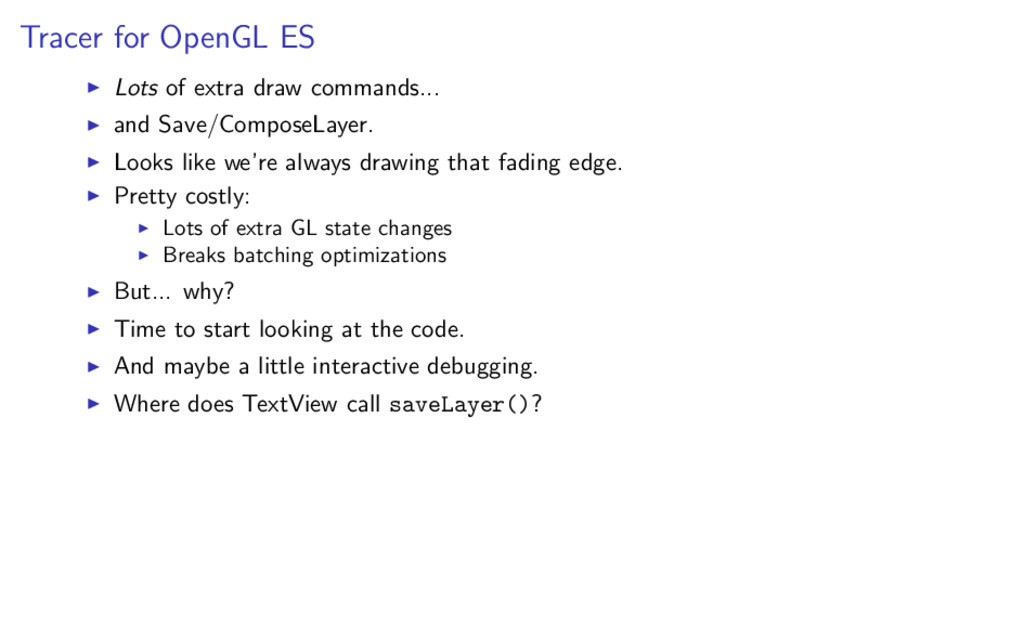
Save/ComposeLayer. Looks like we’re always drawing that fading edge. Pretty costly: Lots of extra GL state changes Breaks batching optimizations But... why? Time to start looking at the code. And maybe a little interactive debugging. Where does TextView call saveLayer()?
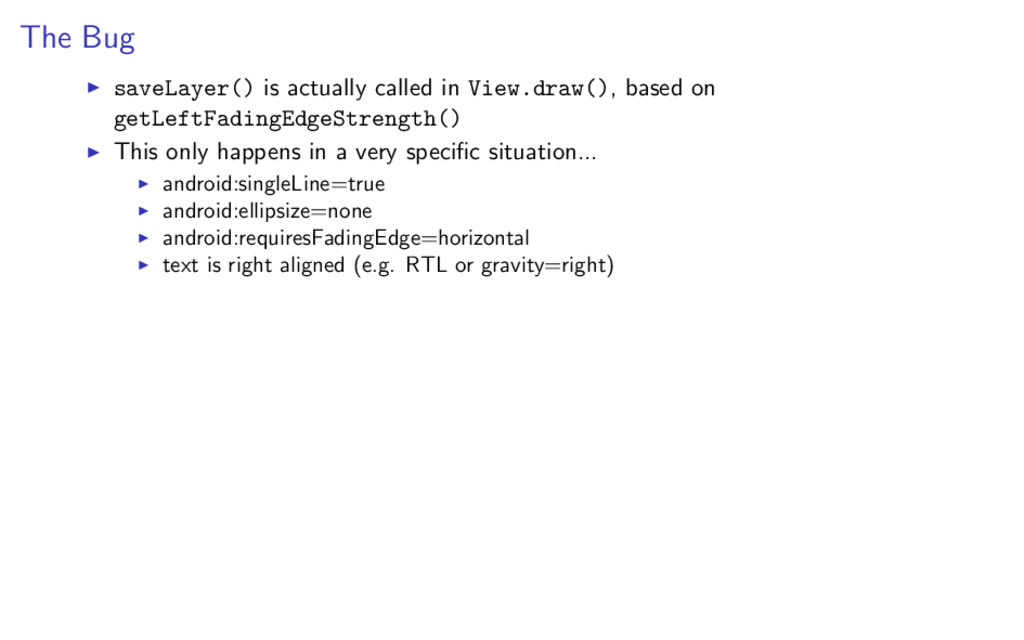
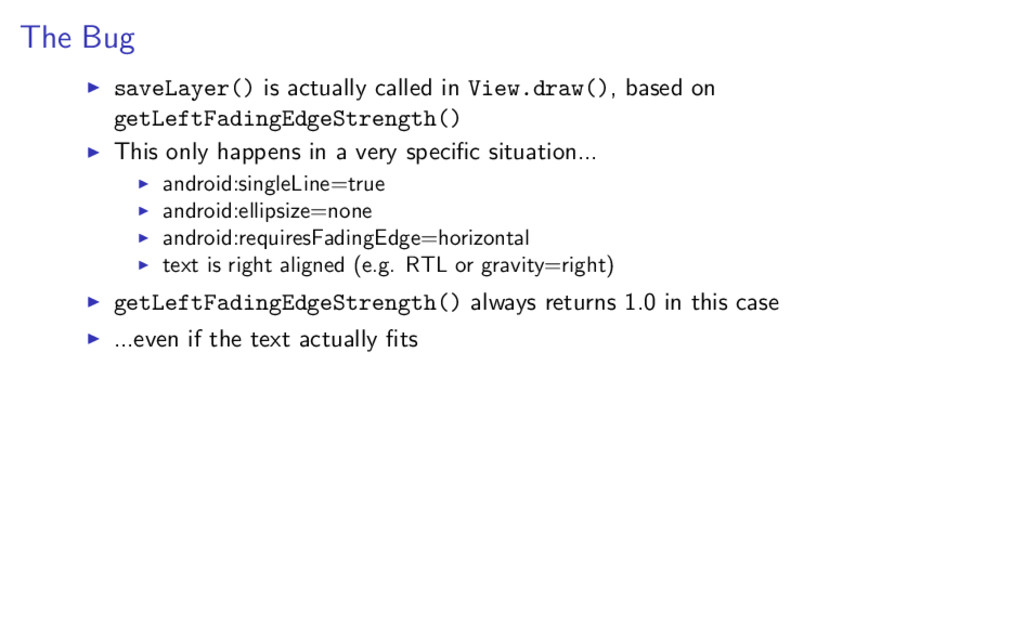
getLeftFadingEdgeStrength() This only happens in a very specific situation... android:singleLine=true android:ellipsize=none android:requiresFadingEdge=horizontal text is right aligned (e.g. RTL or gravity=right)
getLeftFadingEdgeStrength() This only happens in a very specific situation... android:singleLine=true android:ellipsize=none android:requiresFadingEdge=horizontal text is right aligned (e.g. RTL or gravity=right) getLeftFadingEdgeStrength() always returns 1.0 in this case ...even if the text actually fits
getLeftFadingEdgeStrength() This only happens in a very specific situation... android:singleLine=true android:ellipsize=none android:requiresFadingEdge=horizontal text is right aligned (e.g. RTL or gravity=right) getLeftFadingEdgeStrength() always returns 1.0 in this case ...even if the text actually fits The root problem seems to be in the text layout code ...which other people understand better than us.
getLeftFadingEdgeStrength() This only happens in a very specific situation... android:singleLine=true android:ellipsize=none android:requiresFadingEdge=horizontal text is right aligned (e.g. RTL or gravity=right) getLeftFadingEdgeStrength() always returns 1.0 in this case ...even if the text actually fits The root problem seems to be in the text layout code ...which other people understand better than us. A good thing about big companies: there’s (almost) always someone else to send the issue to. ;) Or you can try to get Google to fix it: https://code.google.com/p/android/issues/detail?id=77210
But disables JIT And has high overhead So don’t trust the numbers It’s still good for finding possible hotspots Hierarchy View Shows how your views are connected Inspect views’ contents Inspect views’ properties Profile measure, layout and draw times Remember: layout and measure times affect launch times! Doesn’t work by default on production devices ...but you can add Romain Guy’s ViewServer to your app.