Upgrade to Pro — share decks privately, control downloads, hide ads and more …

Intro to ggplot2

dpastoor
October 22, 2014

Intro to ggplot2

A brief introduction to ggplot2 and it's philosophy of 'layered' grammar of graphics

dpastoor

October 22, 2014
Tweet

More Decks by dpastoor

Other Decks in Science

Transcript

  1. Becoming a visualization! ninja with ggplot2! Devin Pastoor! Center for

    Translational Medicine! University of Maryland, School of Pharmacy!
  2. Elements of a ggplot2 plot! Element! Code! Use! data! data

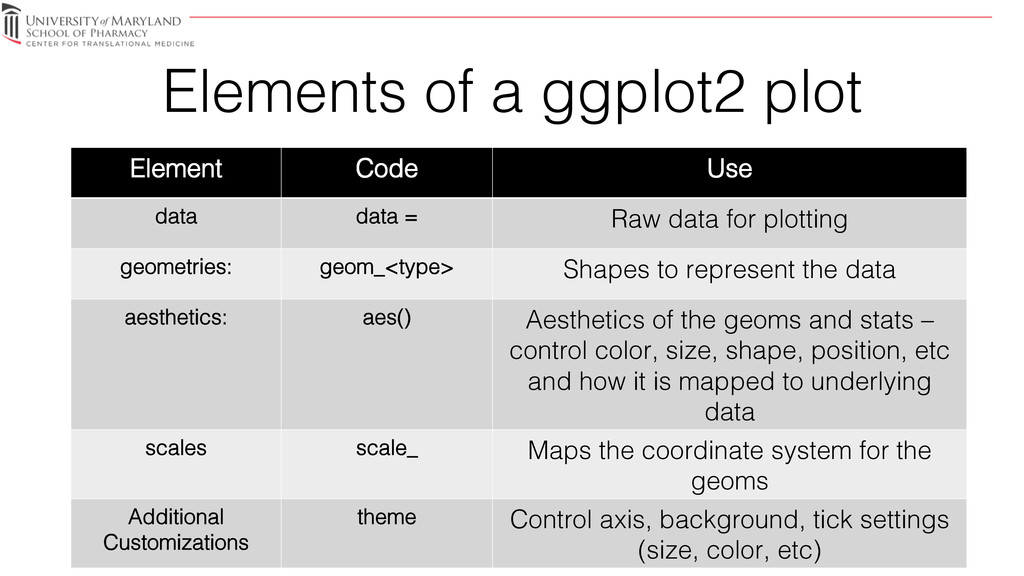
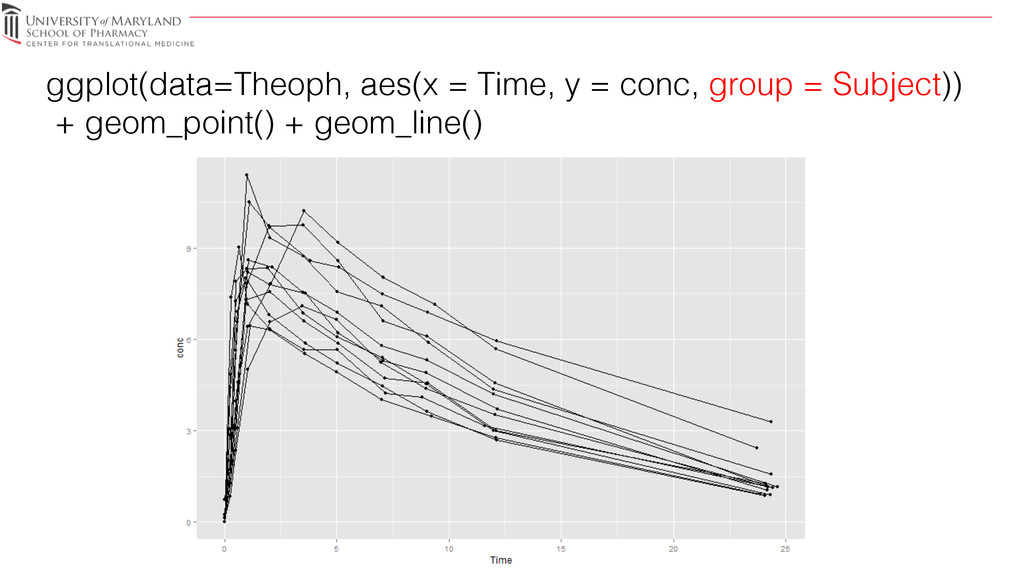
    = ! Raw data for plotting! geometries:! geom_<type>! Shapes to represent the data! aesthetics:! aes()! Aesthetics of the geoms and stats – control color, size, shape, position, etc and how it is mapped to underlying data! scales! scale_! Maps the coordinate system for the geoms! Additional Customizations! theme! Control axis, background, tick settings (size, color, etc)!
  3. ggplot(data=Theoph, aes(x = Time, y = conc))! Underlying data! Data

    columns and their associated ! ‘mappings’!
  4. ggplot(data = Theoph, aes(x = Time, y = conc, group

    = Subject)) + ! geom_point(color = 'red') + geom_line(size = 1.5)! ggplot(data = Theoph, aes(x = Time, y = conc, group = Subject)) + ! geom_line(size = 1.5) + geom_point(color = 'red') ! Order matters visually!!
  5. Objects can be saved and more layers added! conc_time +

    scale_y_log10() + ylab("Concentration")! conc_time! conc_time <- ggplot(data = Theoph, aes(x = Time, y = conc, group = Subject)) + geom_line(size = 1.5)!
  6. ggplot(data=Theoph, aes(x = Time, y = conc, group = Subject))

    + geom_line(size = 1.5) + ! theme(axis.text.x = element_text(size = 20, color = 'black'))!