Bayesian estimation of black petrel demographic parameters
from mark-recapture data. A preliminary analysis of data collected at Great Barrier Island from 1963 to 2014. The analysis includes separate resight probability for each bird.
from mark recapture data Edward Abraham Biz Bell WMIL May Preliminary analysis CC BY PresentationmadeavailableunderaCreativeCommons licence Pictureofanadultpetrel CC BY Charlie Westerinen picture of a chick CC BY Edward Abraham
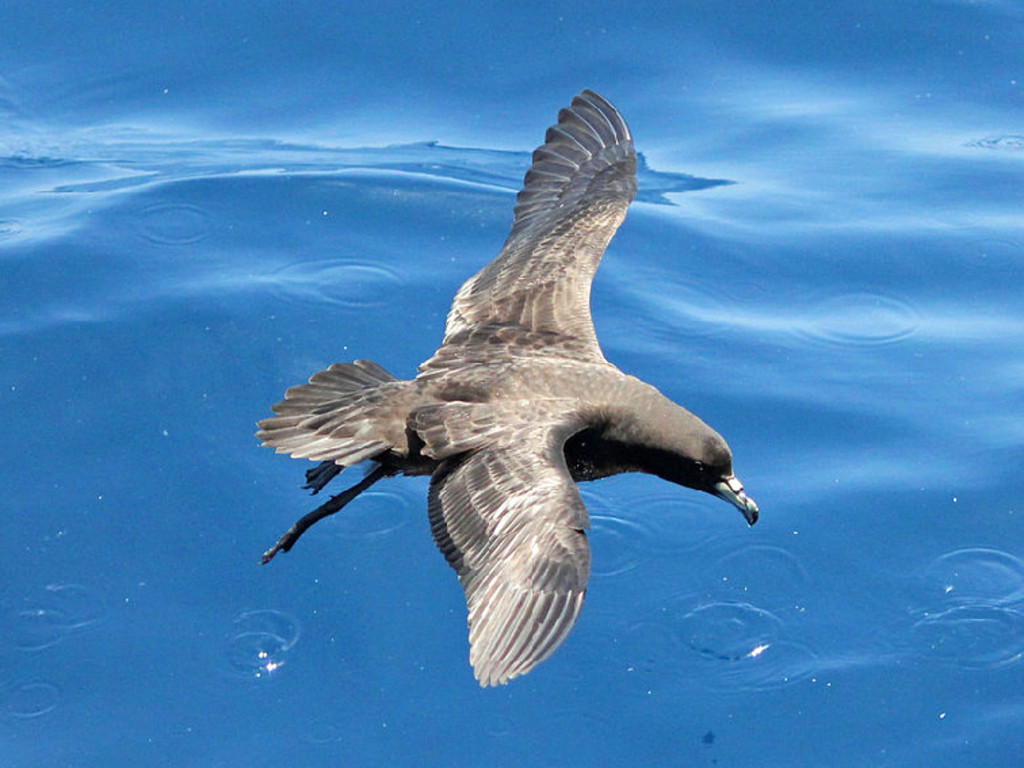
apparently declined since the late ’s Could apparent changes in the population be due to changes in the attendance of birds at the colony? Have there been changes in the survival of black petrel over this period?
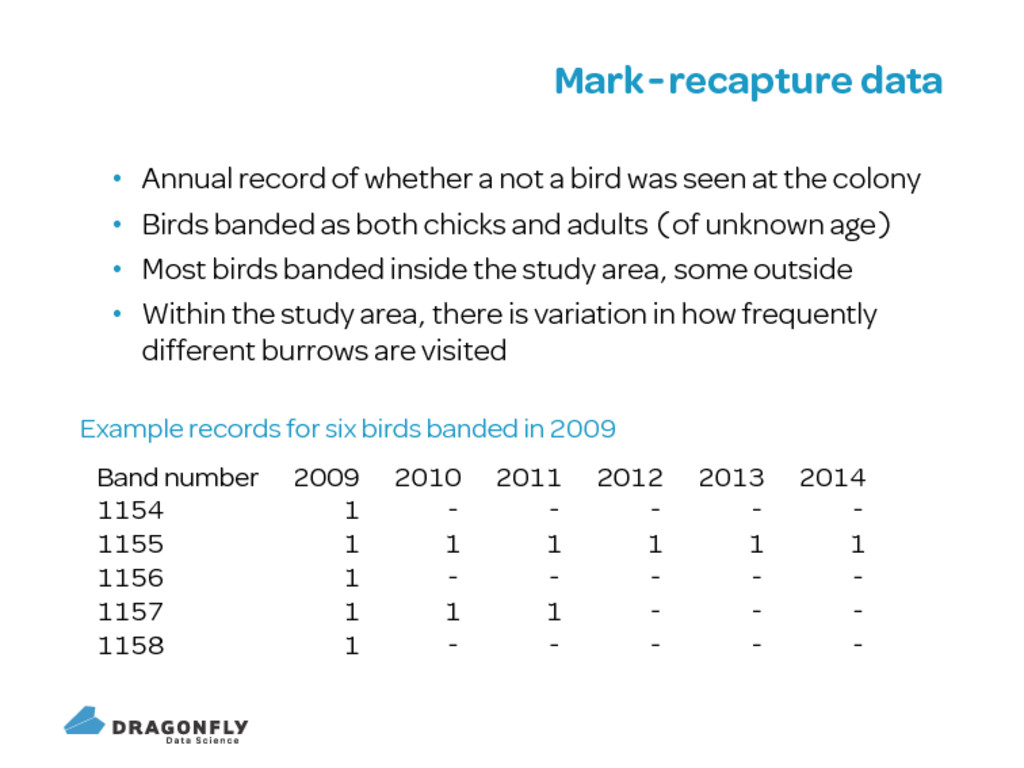
bird was seen at the colony Birds banded as both chicks and adults of unknown age Most birds banded inside the study area some outside Within the study area there is variation in how frequently different burrows are visited Example records for six birds banded in Band number
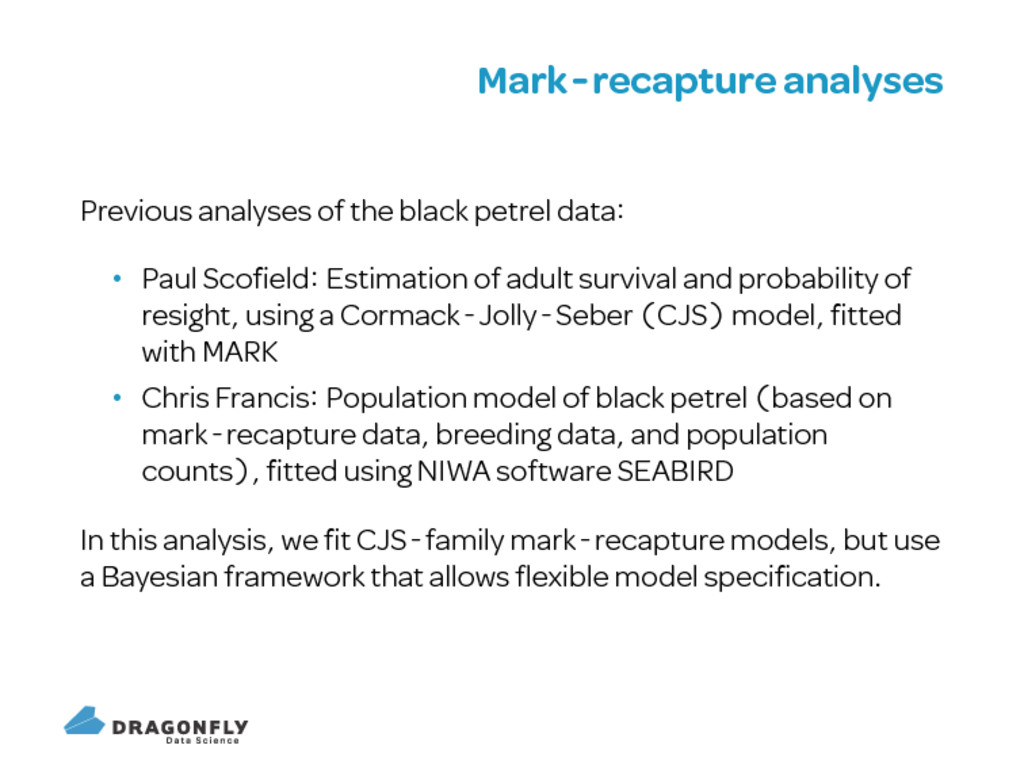
Paul Scofield Estimation of adult survival and probability of resight using a Cormack Jolly Seber CJS model fitted with MARK Chris Francis Population model of black petrel based on mark recapture data breeding data and population counts fitted using NIWA software SEABIRD In this analysis we fit CJS family mark recapture models but use a Bayesian framework that allows flexible model specification
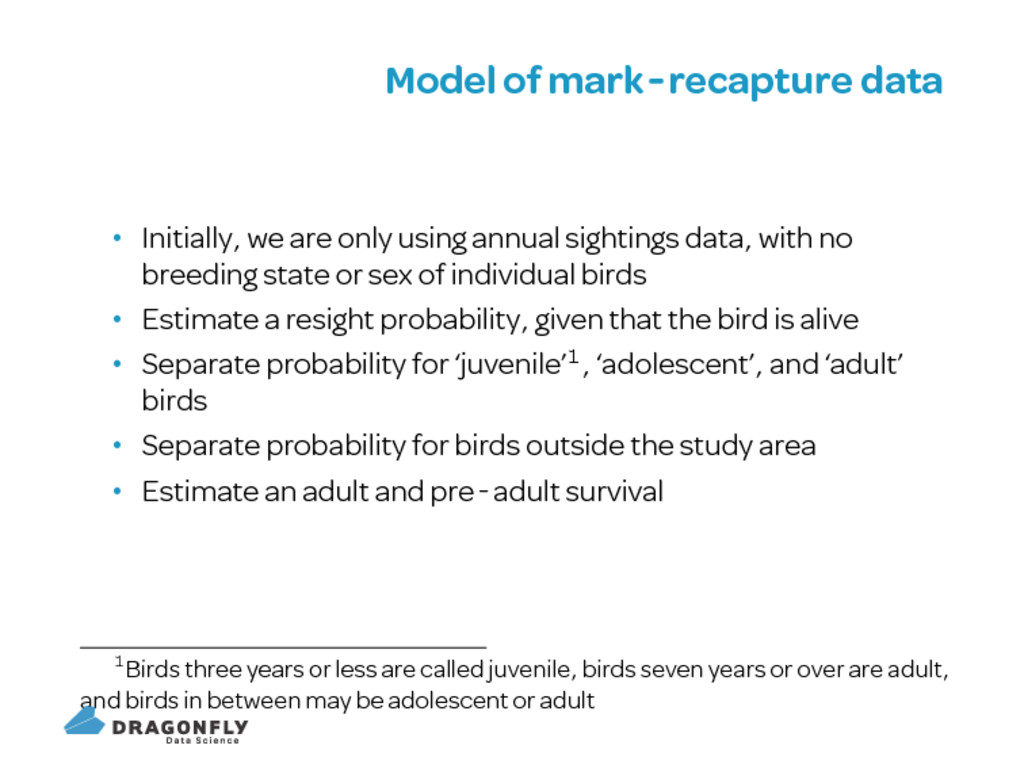
annual sightings data with no breeding state or sex of individual birds Estimate a resight probability given that the bird is alive Separate probability for ‘juvenile’ ‘adolescent’ and ‘adult’ birds Separate probability for birds outside the study area Estimate an adult and pre adult survival Birds three years or less are called juvenile birds seven years or over are adult and birds in between may be adolescent or adult
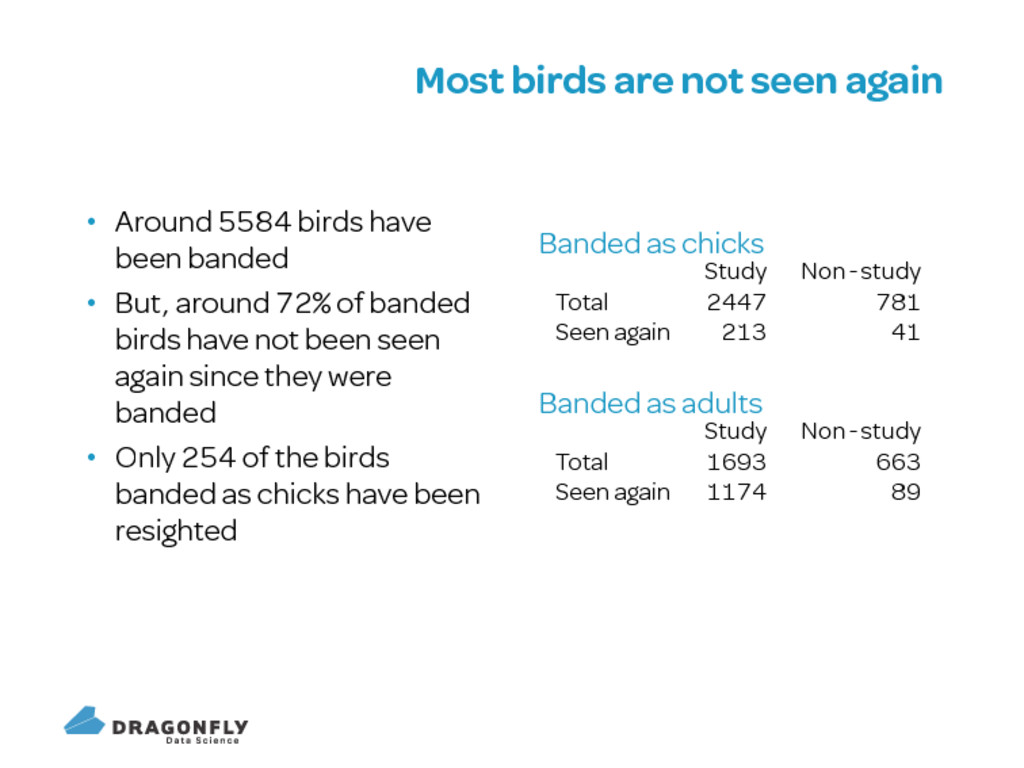
banded But around of banded birds have not been seen again since they were banded Only of the birds banded as chicks have been resighted Banded as chicks Study Non study Total Seen again Banded as adults Study Non study Total Seen again
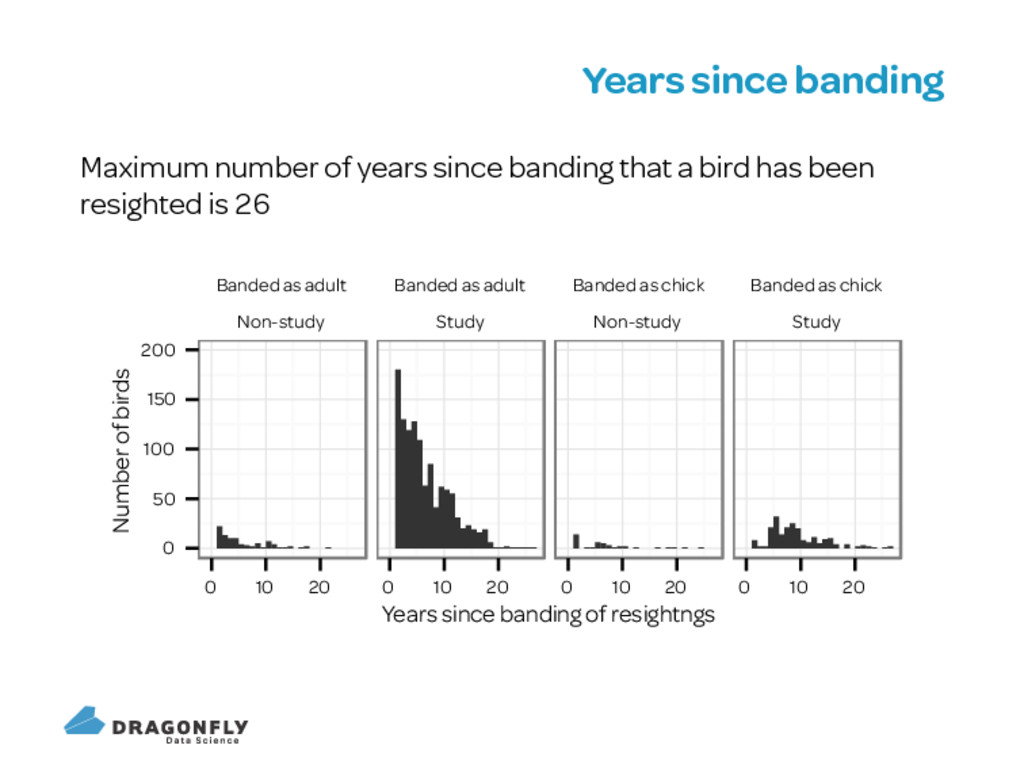
a bird has been resighted is Banded as adult Non-study Banded as adult Study Banded as chick Non-study Banded as chick Study 0 50 100 150 200 0 10 20 0 10 20 0 10 20 0 10 20 Years since banding of resightngs Number of birds
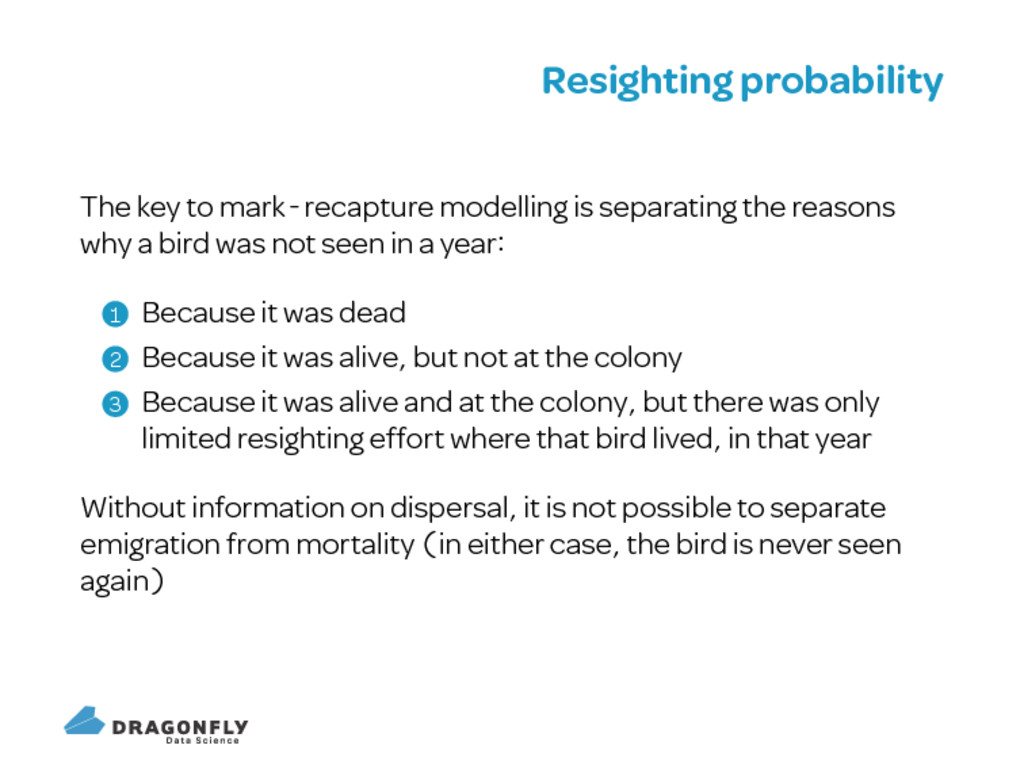
the reasons why a bird was not seen in a year Because it was dead Because it was alive but not at the colony Because it was alive and at the colony but there was only limited resighting effort where that bird lived in that year Without information on dispersal it is not possible to separate emigration from mortality in either case the bird is never seen again
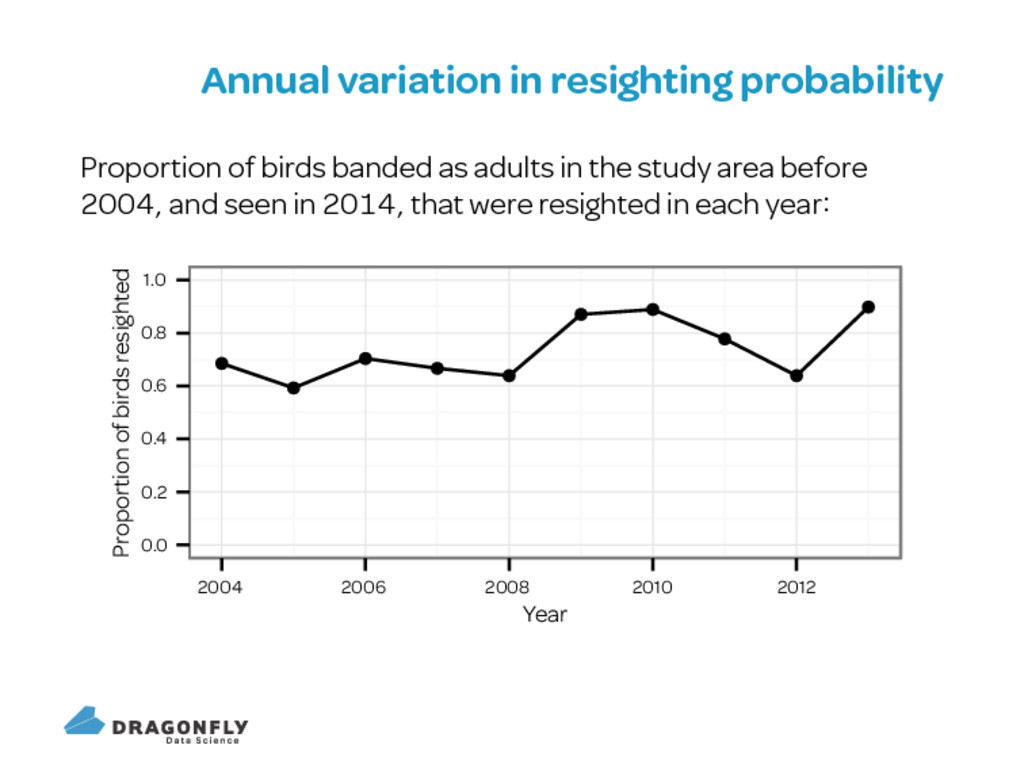
adults in the study area before and seen in that were resighted in each year 0.0 0.2 0.4 0.6 0.8 1.0 2004 2006 2008 2010 2012 Year Proportion of birds resighted
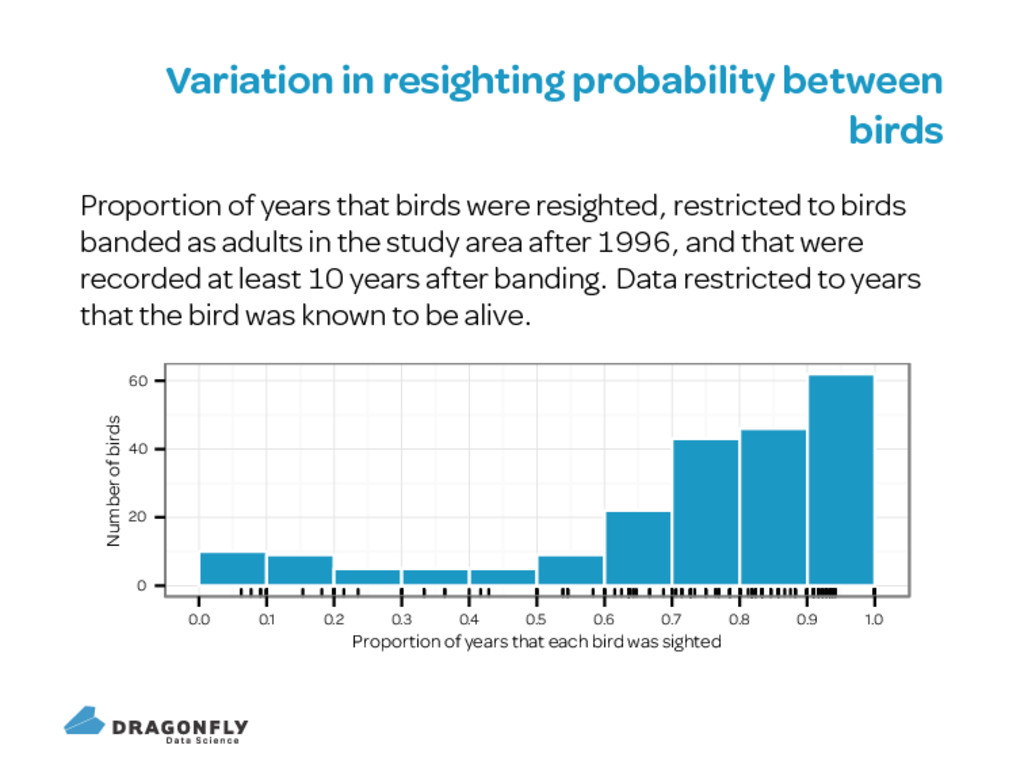
birds were resighted restricted to birds banded as adults in the study area after and that were recorded at least years after banding Data restricted to years that the bird was known to be alive 0 20 40 60 0.0 0.1 0.2 0.3 0.4 0.5 0.6 0.7 0.8 0.9 1.0 Proportion of years that each bird was sighted Number of birds
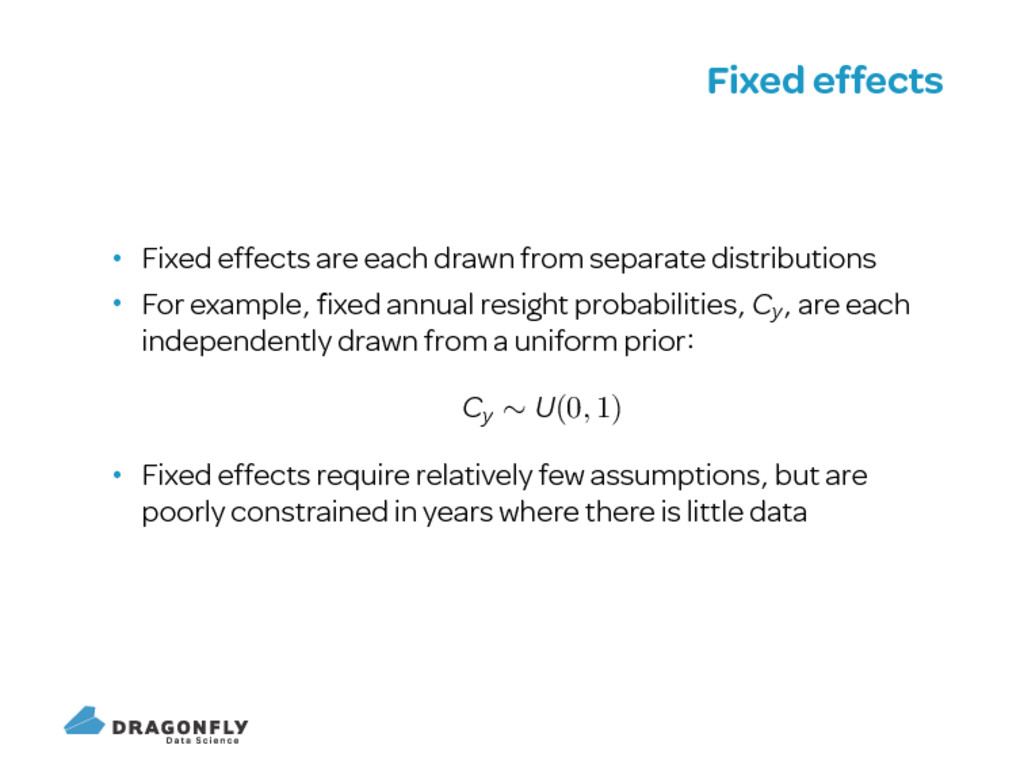
For example fixed annual resight probabilities Cy are each independently drawn from a uniform prior Cy ∼ U(0, 1) Fixed effects require relatively few assumptions but are poorly constrained in years where there is little data
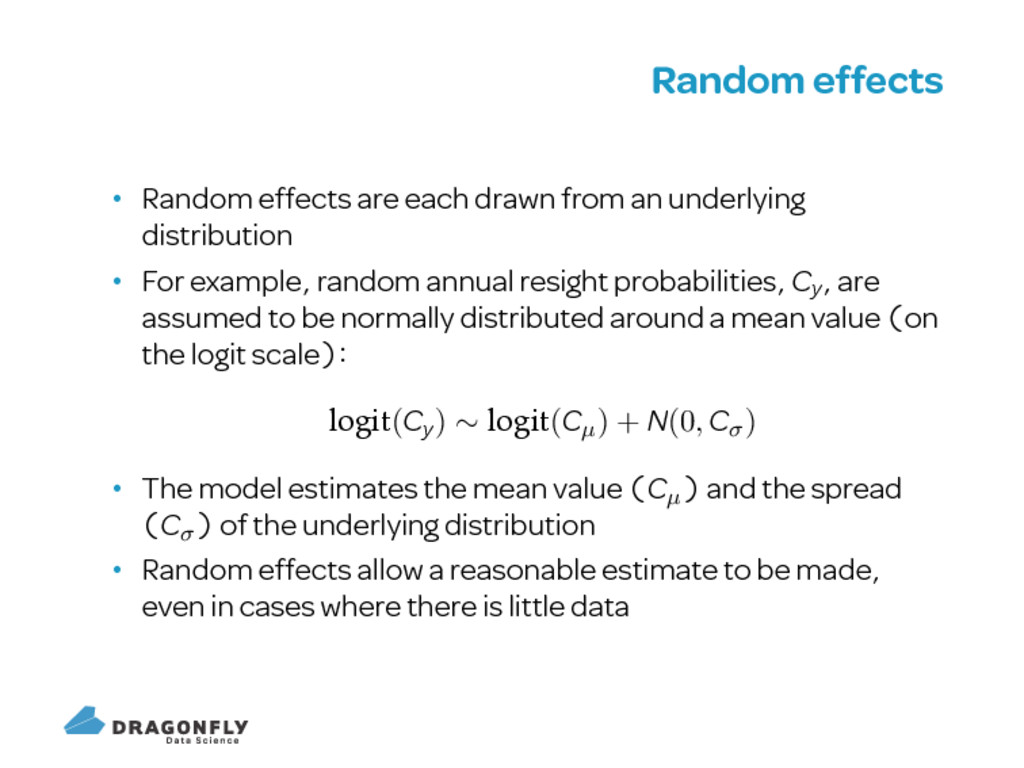
distribution For example random annual resight probabilities Cy are assumed to be normally distributed around a mean value on the logit scale logit(Cy ) ∼ logit(Cµ) + N(0, Cσ) The model estimates the mean value Cµ and the spread Cσ of the underlying distribution Random effects allow a reasonable estimate to be made even in cases where there is little data
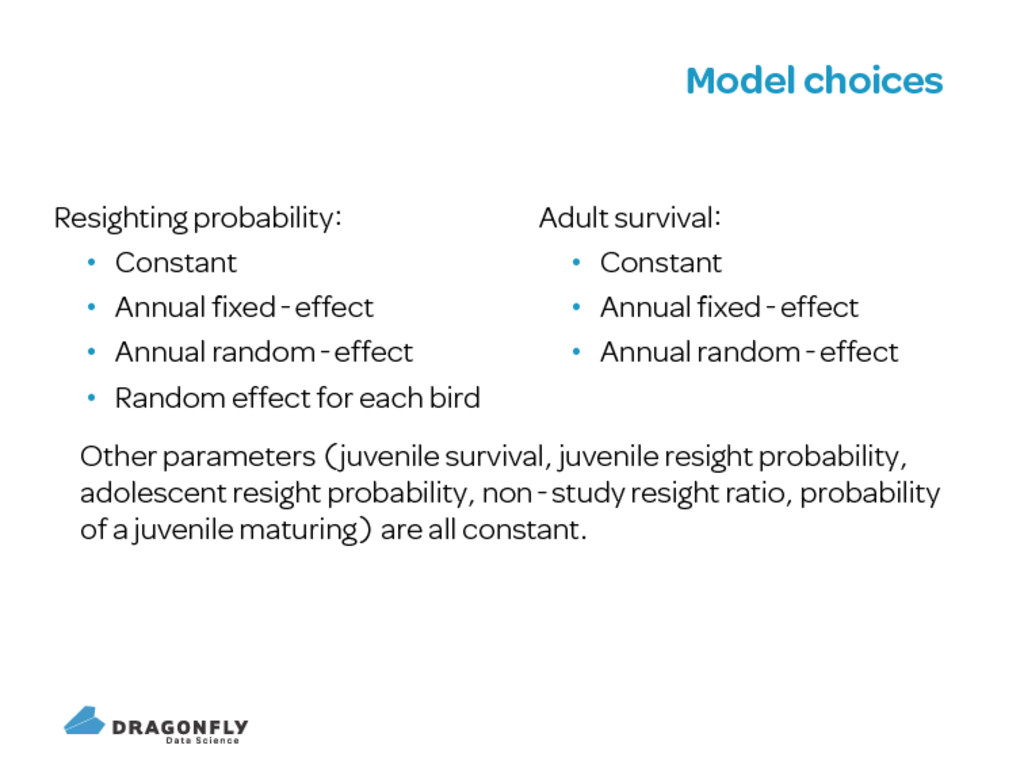
effect Random effect for each bird Adult survival Constant Annual fixed effect Annual random effect Other parameters juvenile survival juvenile resight probability adolescent resight probability non study resight ratio probability of a juvenile maturing are all constant
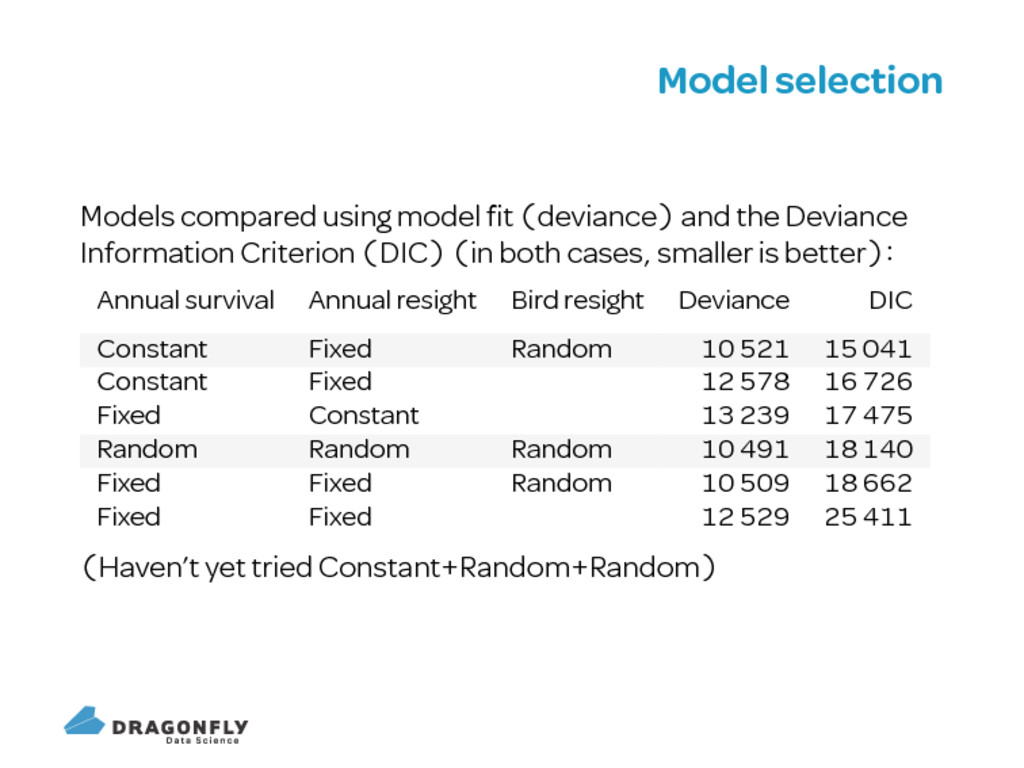
Deviance Information Criterion DIC in both cases smaller is better Annual survival Annual resight Bird resight Deviance DIC Constant Fixed Random Constant Fixed Fixed Constant Random Random Random Fixed Fixed Random Fixed Fixed Haven’t yet tried Constant Random Random
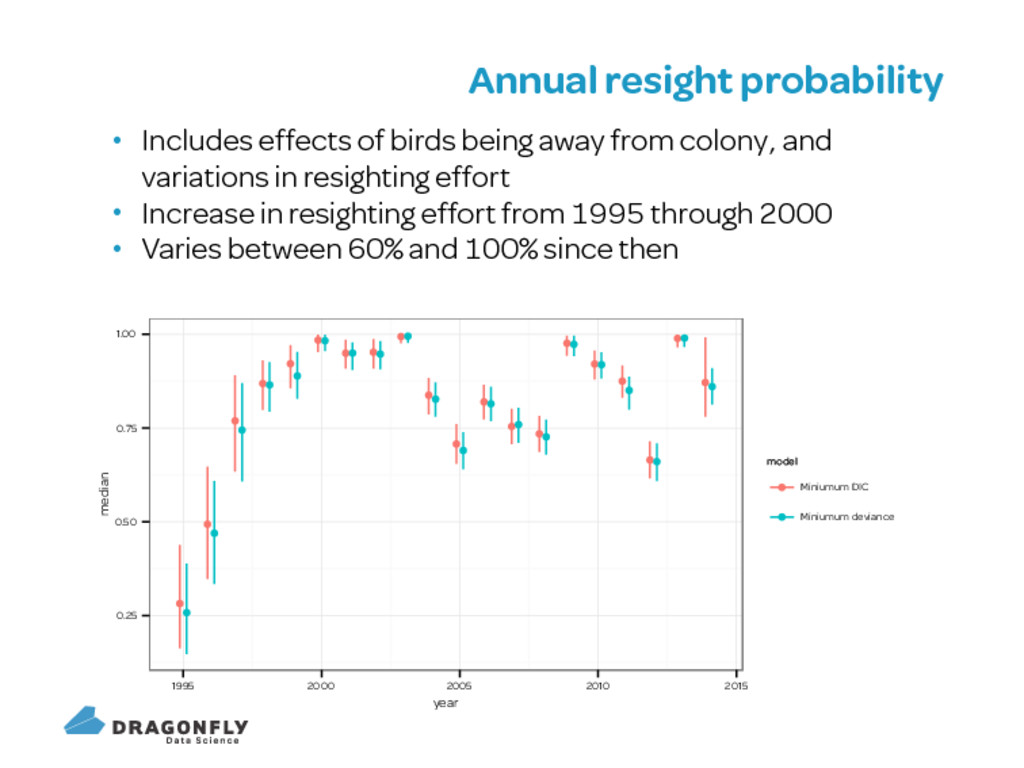
colony and variations in resighting effort Increase in resighting effort from through Varies between and since then 0.25 0.50 0.75 1.00 1995 2000 2005 2010 2015 year median model Miniumum DIC Miniumum deviance
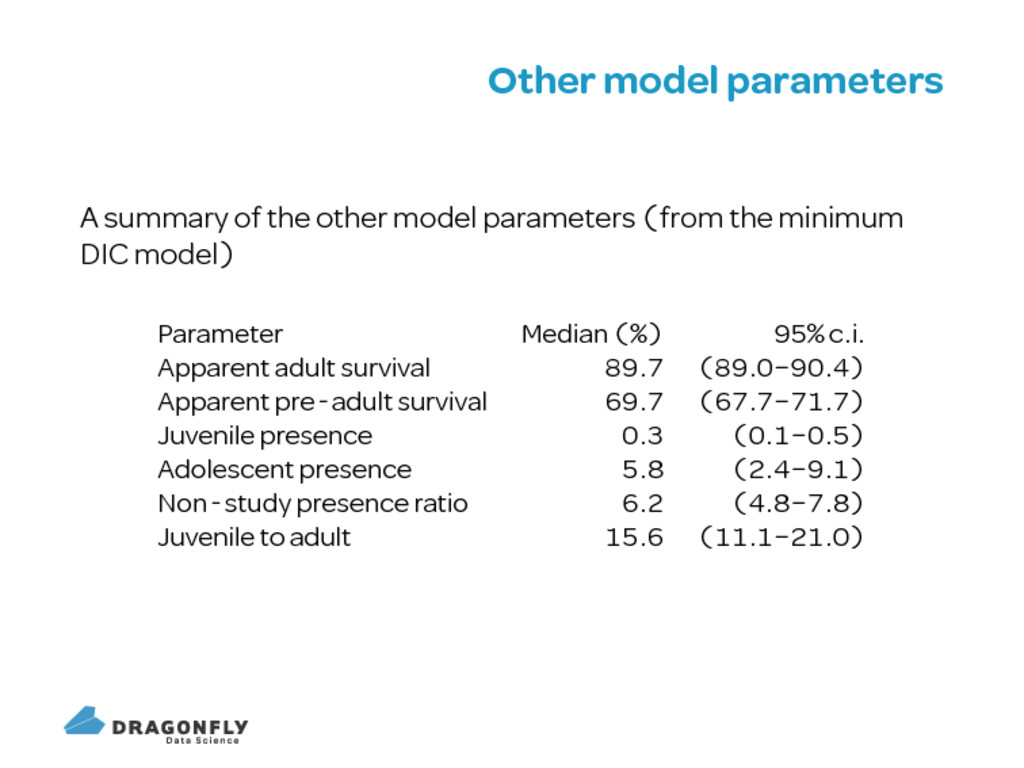
from the minimum DIC model Parameter Median c i Apparent adult survival Apparent pre adult survival Juvenile presence Adolescent presence Non study presence ratio Juvenile to adult
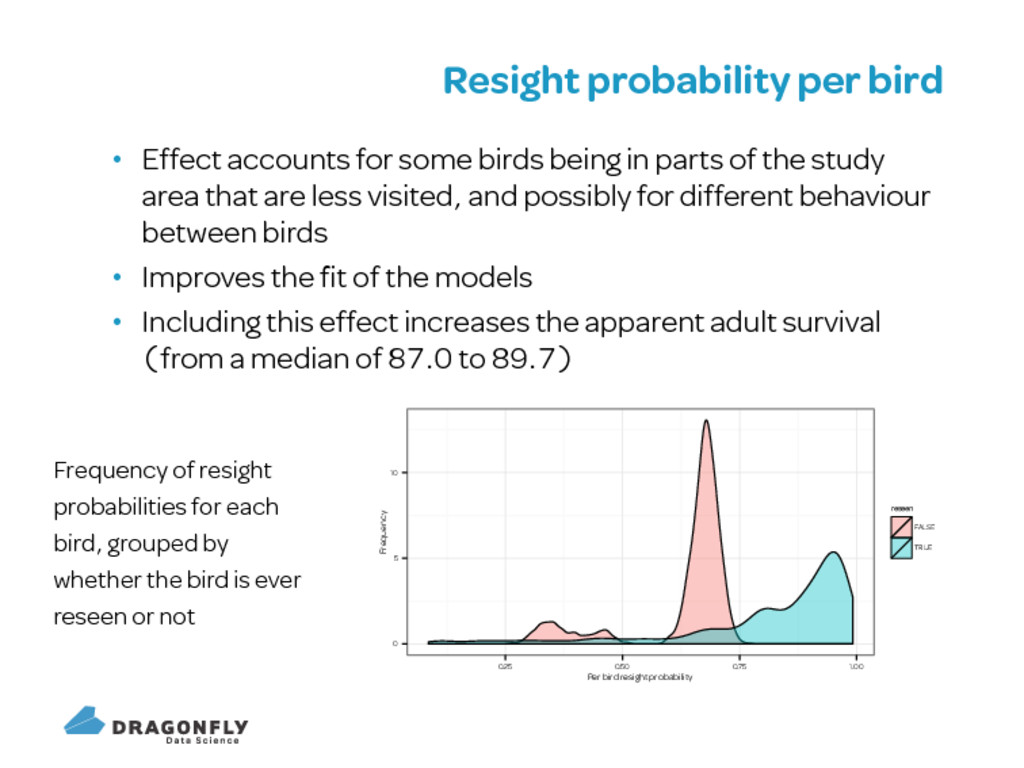
in parts of the study area that are less visited and possibly for different behaviour between birds Improves the fit of the models Including this effect increases the apparent adult survival from a median of to Frequency of resight probabilities for each bird grouped by whether the bird is ever reseen or not 0 5 10 0.25 0.50 0.75 1.00 Per bird resight probability Frequency reseen FALSE TRUE
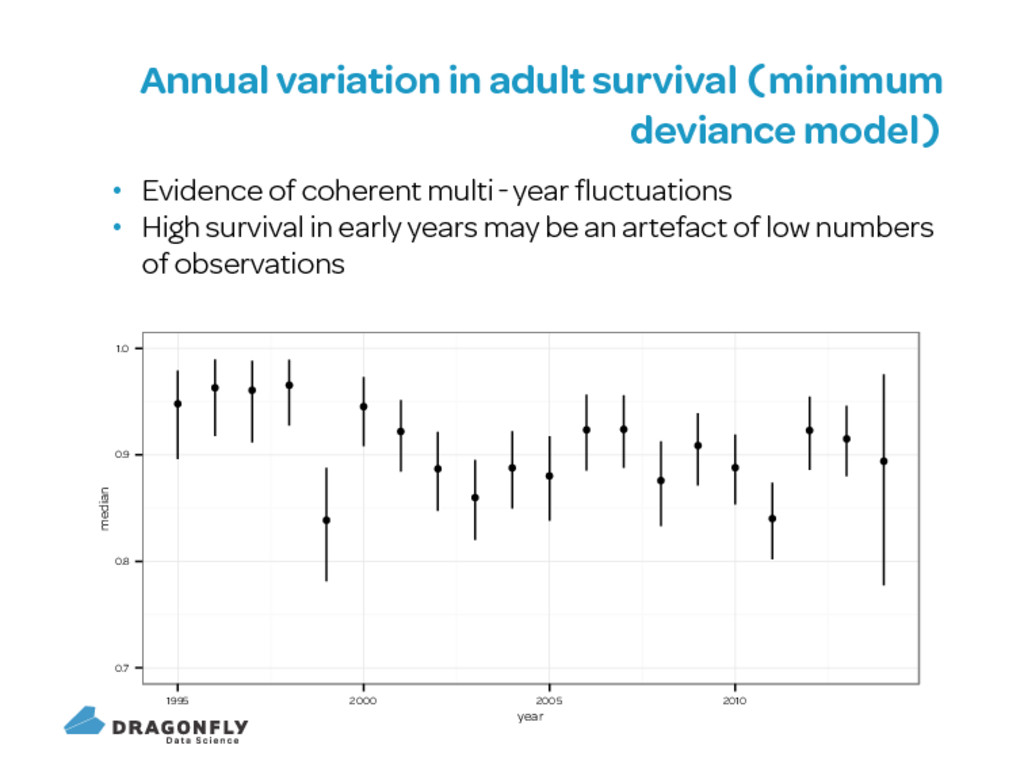
coherent multi year fluctuations High survival in early years may be an artefact of low numbers of observations 0.7 0.8 0.9 1.0 1995 2000 2005 2010 year median
measure of effort within each season ideally from a record of visits to each burrow and a record of association between birds and burrows Will also include recorded state information sex breeding etc to allow affect of state on presence and on survival to be estimated