Upgrade to Pro — share decks privately, control downloads, hide ads and more …

Overcoming Blank Canvas Syndrome with Oracle An...

Overcoming Blank Canvas Syndrome with Oracle Analytics Cloud

The Blank Canvas Syndrome is a major deterrent in the uptake of Analytics tools amongst business users who aim to make the most out of Self-Service Analytics capabilities. Everybody has read about all the usual buzzwords endlessly, but users have no starting point and are put off.

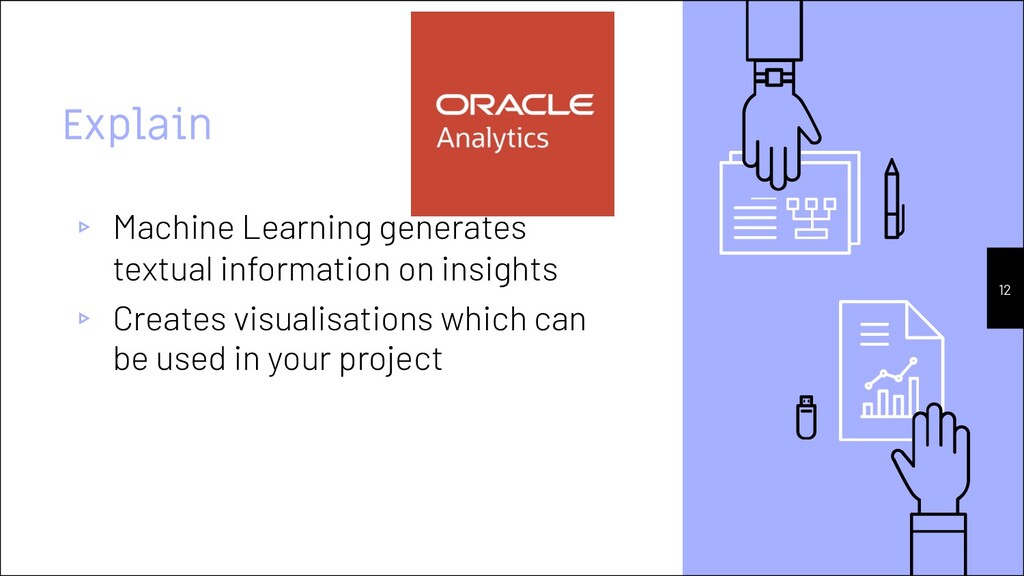
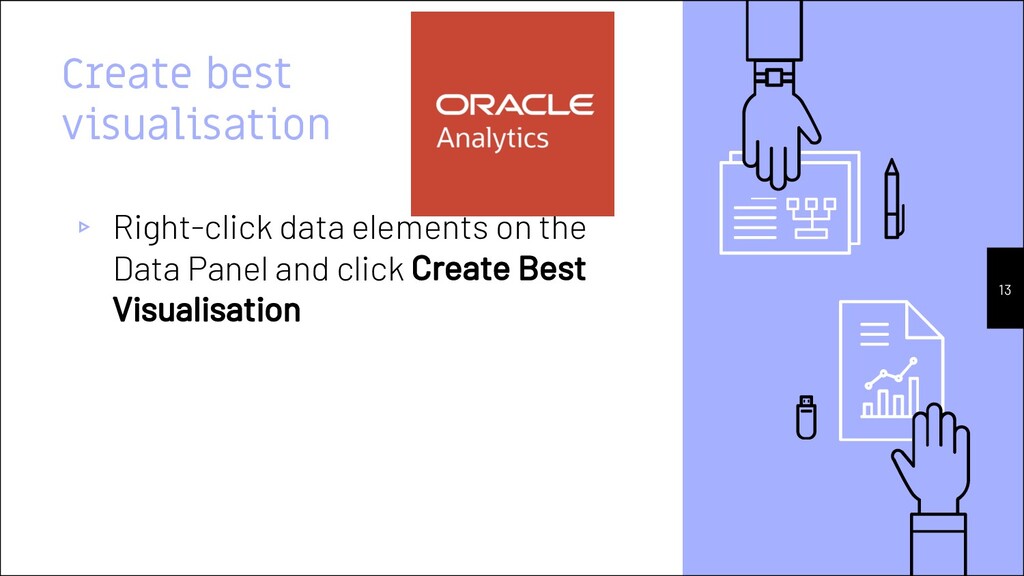
Oracle Analytics Cloud uses Machine Learning and Artificial Intelligence to take the sting out of the Blank Canvas Syndrome.

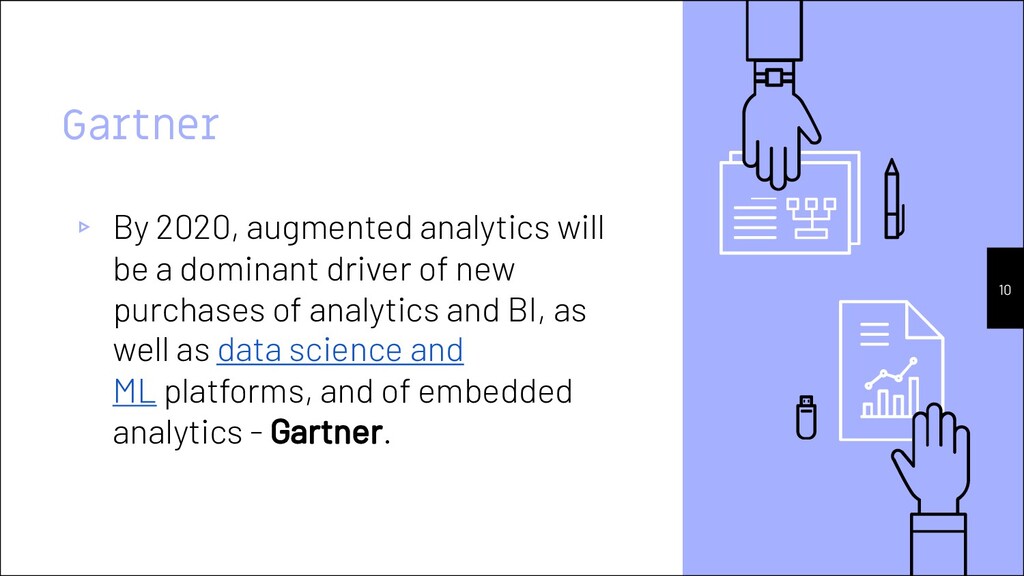
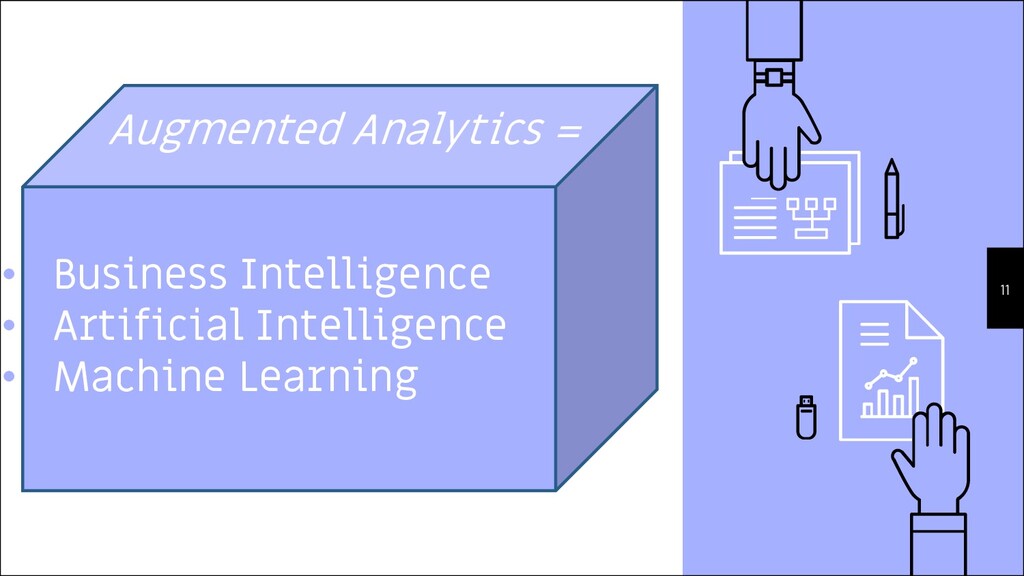
This interactive session will demonstrate how Oracle Analytics Cloud overcomes the barrier of the blank canvas syndrome. The powerful combination of Augmented Analytics and Cloud assists in empowering corporations to gain insights which ultimately increase productivity and profitability by allowing users to focus on their business while reducing strain and operational costs

Elffar Analytics

December 03, 2019
Tweet

More Decks by Elffar Analytics

Other Decks in Technology

Transcript

  1. @G_Ceresa Gianni Ceresa Managing Director of DATAlysis GmbH (Switzerland) Working

    with Business AnalyEcs, EPM tools and “data” for more than 10 years Oracle ACE Director Part-Eme blogger on gianniceresa.com Full-Eme IRC (freenode | #obihackers) resident Same group on Telegram hVp://telegram.me/obihackers ODC (ex OTN) forums addict Technology geek (or just geek in general)
  2. Copyright © 2017, Oracle and/or its affiliates. All rights reserved.

    | bit.ly/OracleACEProgram 450+ Technical Experts Helping Peers Globally Nominate yourself or someone you know: acenomina(on.oracle.com
  3. 7

  4. “ “The automation of the generation of insights using Machine

    Learning and Natural Language generation.“ 9
  5. 10 Gartner ▹ By 2020, augmented analytics will be a

    dominant driver of new purchases of analytics and BI, as well as data science and ML platforms, and of embedded analytics - Gartner.
  6. 12 Explain ▹ Machine Learning generates textual information on insights

    ▹ Creates visualisations which can be used in your project
  7. 13 Create best visualisation ▹ Right-click data elements on the

    Data Panel and click Create Best Visualisation
  8. 15 Demo Scenario ▹ Given a dataset in an ATP

    database ▹ Additional mapping data available in Excel ▹ What do I do?
  9. Oracle Analytics & ML ▹ Citizen Data Scientists can easily

    consume ML models ▹ Enables collaboration with Data Scientists 17
  10. Oracle Analytics ▹ Works well with monolithic Datasets ▹ Product

    positioned at Citizen Data Science ▹ Multiple datasets reduces features that can be used in a project ▹ Multi Facts and unconfirmed dimensions ▹ Sharing Project with DB connection 18