Share
Embed
Image processing with scikit-image and Dash
Emmanuelle Gouillart
July 10, 2019
Transcript
45 slides
-
Image processing with scikit-image and Dash Emmanuelle Gouillart plotly and
scikit-image team @EGouillart -
What is scikit-image? An open-source (BSD) generic image processing library
for the Python language (and NumPy data arrays) -
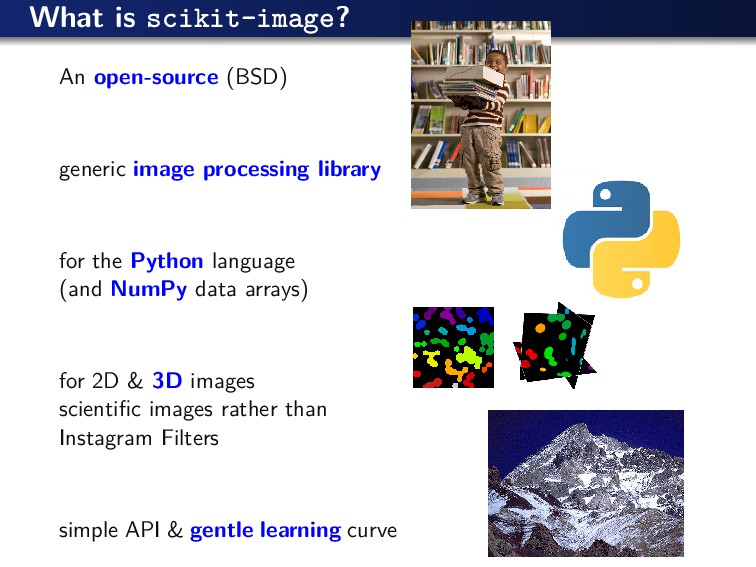
What is scikit-image? An open-source (BSD) generic image processing library
for the Python language (and NumPy data arrays) for 2D & 3D images scientific images rather than Instagram Filters simple API & gentle learning curve -
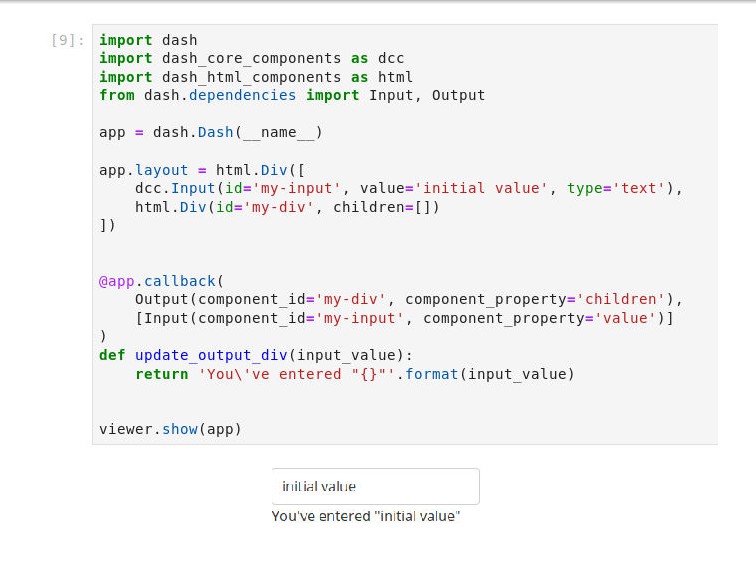
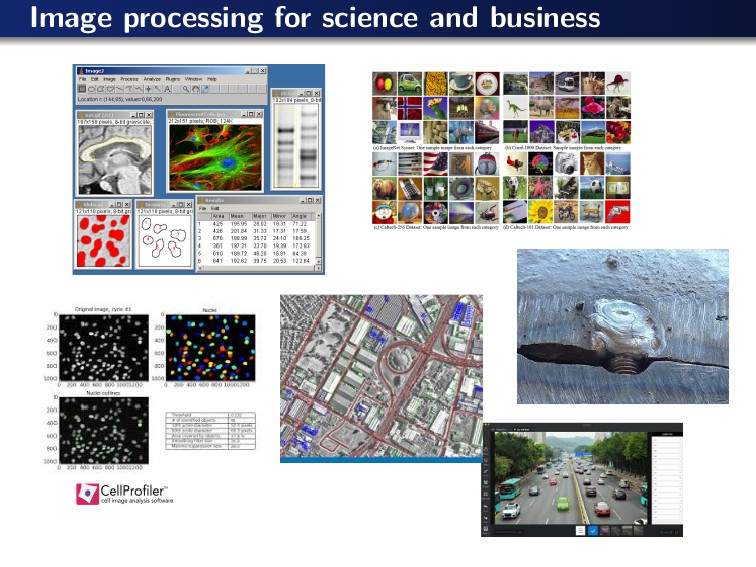
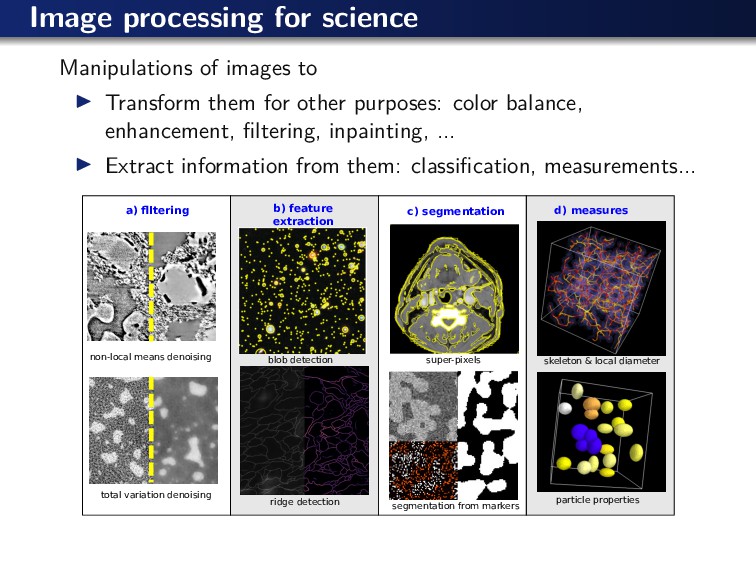
Image processing for science Manipulations of images to Transform them
for other purposes: color balance, enhancement, filtering, inpainting, ... Extract information from them: classification, measurements... a) flltering b) feature extraction c) segmentation d) measures non-local means denoising total variation denoising blob detection super-pixels skeleton & local diameter particle properties segmentation from markers ridge detection -
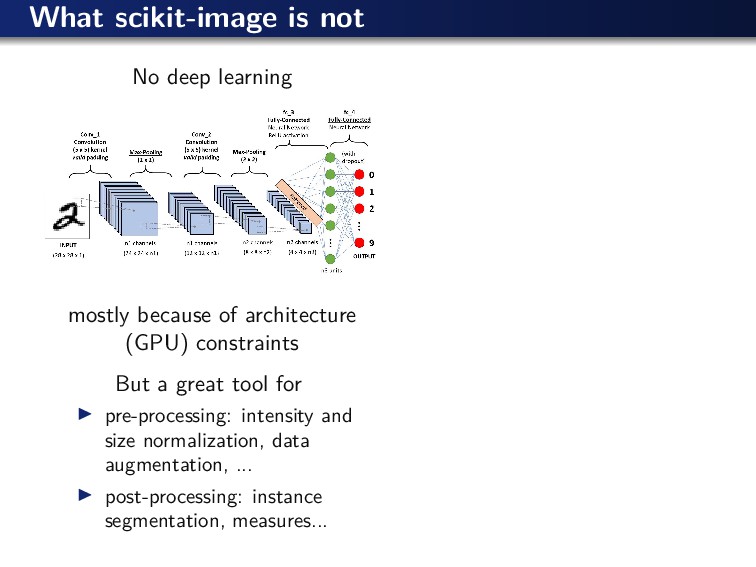
What scikit-image is not No deep learning mostly because of
architecture (GPU) constraints But a great tool for pre-processing: intensity and size normalization, data augmentation, ... post-processing: instance segmentation, measures... -
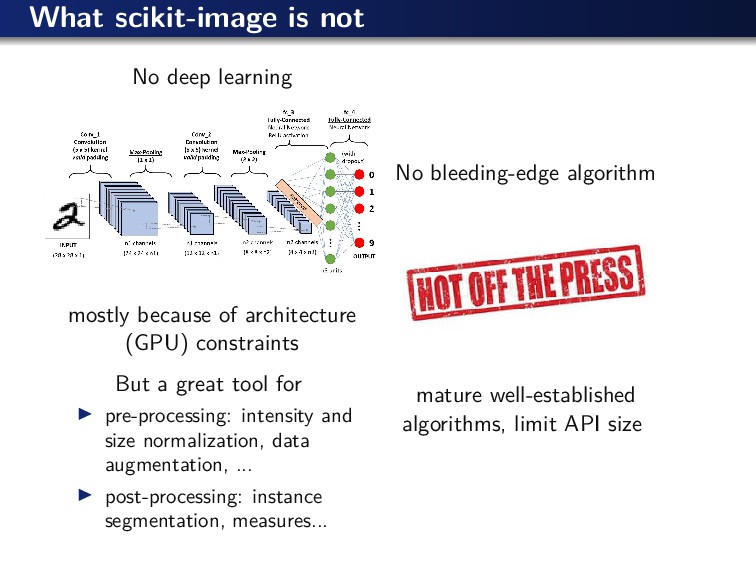
What scikit-image is not No deep learning mostly because of
architecture (GPU) constraints But a great tool for pre-processing: intensity and size normalization, data augmentation, ... post-processing: instance segmentation, measures... No bleeding-edge algorithm mature well-established algorithms, limit API size -
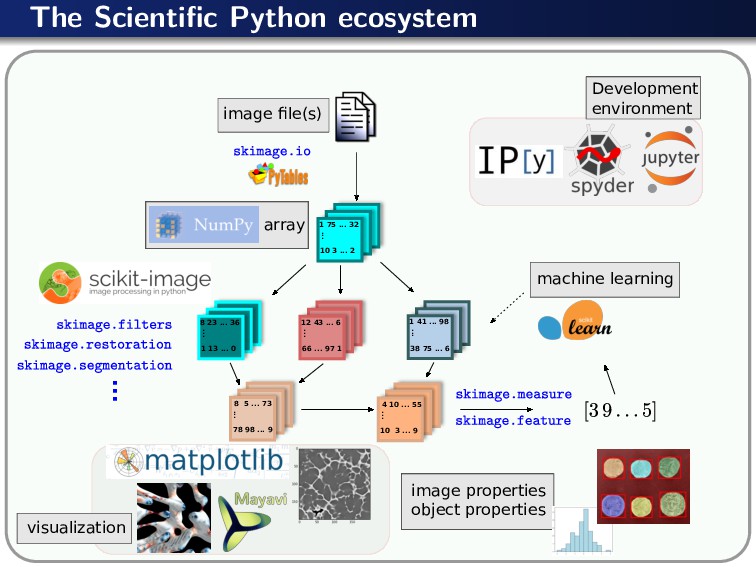
The Scientific Python ecosystem 1 75 ... 32 ... 10
3 ... 2 8 23 ... 36 ... 1 13 ... 0 12 43 ... 6 ... 66 ... 97 1 8 5 ... 73 ... 78 98 ... 9 4 10 ... 55 ... 10 3 ... 9 1 41 ... 98 ... 38 75 ... 6 ... visualization Development environment machine learning image properties object properties image file(s) array -
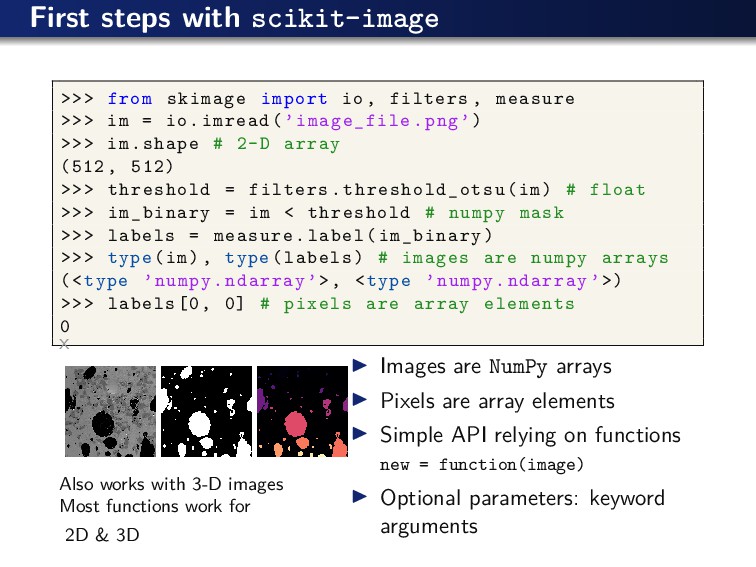
First steps with scikit-image >>> from skimage import io ,
filters , measure >>> im = io.imread(’image_file.png’) >>> im.shape # 2-D array (512 , 512) >>> threshold = filters. threshold_otsu (im) # float >>> im_binary = im < threshold # numpy mask >>> labels = measure.label(im_binary) >>> type(im), type(labels) # images are numpy arrays (<type ’numpy.ndarray ’>, <type ’numpy.ndarray ’>) >>> labels [0, 0] # pixels are array elements 0 x Also works with 3-D images Most functions work for 2D & 3D Images are NumPy arrays Pixels are array elements Simple API relying on functions new = function(image) Optional parameters: keyword arguments -
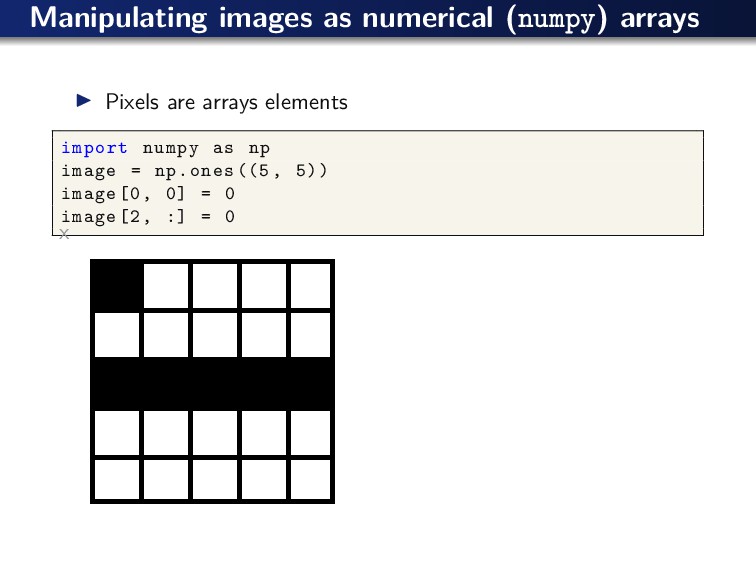
Manipulating images as numerical (numpy) arrays Pixels are arrays elements
import numpy as np image = np.ones ((5, 5)) image [0, 0] = 0 image [2, :] = 0 x -
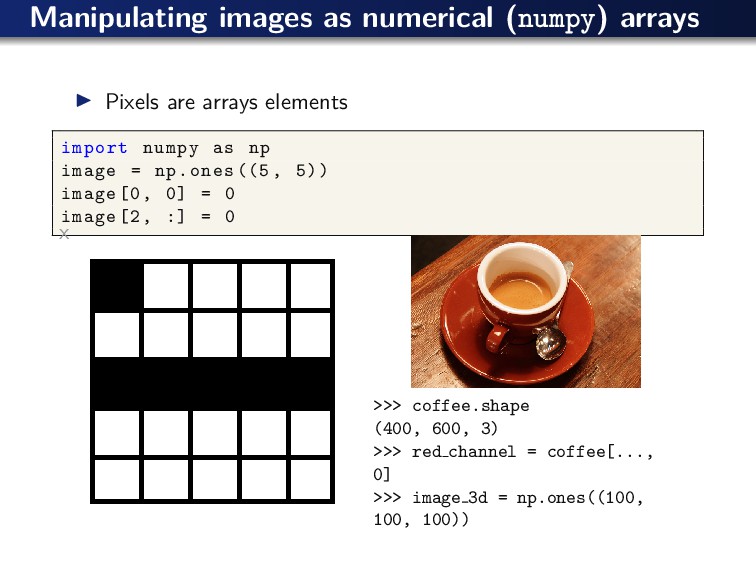
Manipulating images as numerical (numpy) arrays Pixels are arrays elements
import numpy as np image = np.ones ((5, 5)) image [0, 0] = 0 image [2, :] = 0 x >>> coffee.shape (400, 600, 3) >>> red channel = coffee[..., 0] >>> image 3d = np.ones((100, 100, 100)) -
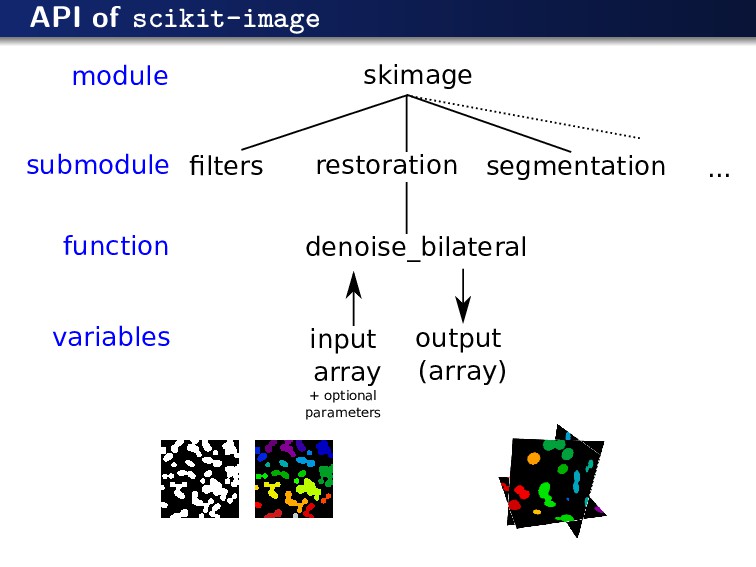
API of scikit-image skimage filters restoration segmentation ... denoise_bilateral input
array + optional parameters output (array) submodule module function variables -
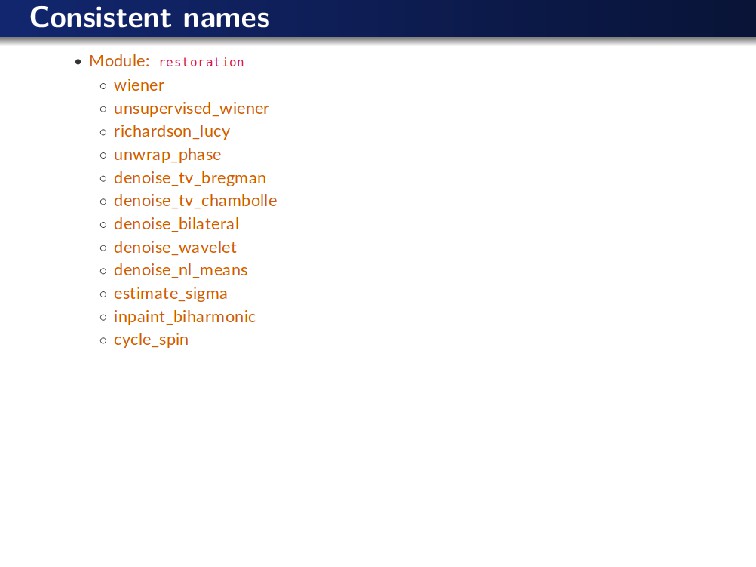
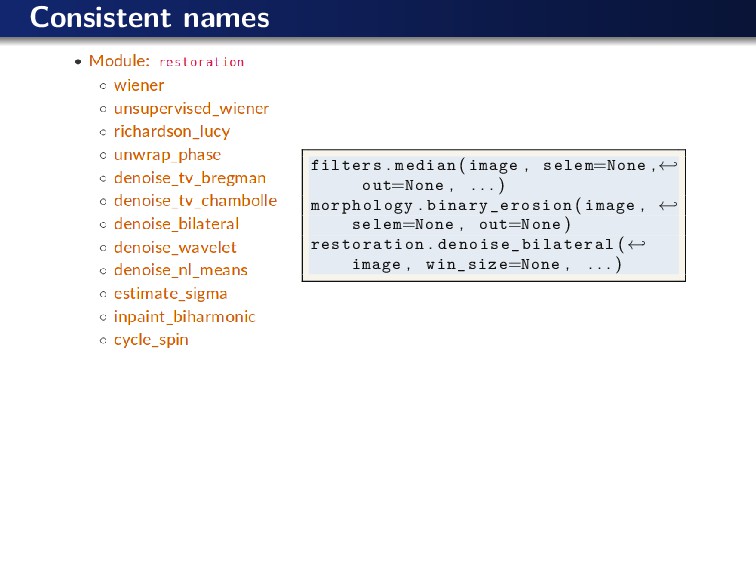
Consistent names filters . median ( image , selem=None ,
← out=None , . . . ) morphology . binary_erosion ( image , ← selem=None , out=None ) restoration . denoise_bilateral (← image , win_size=None , . . . ) -
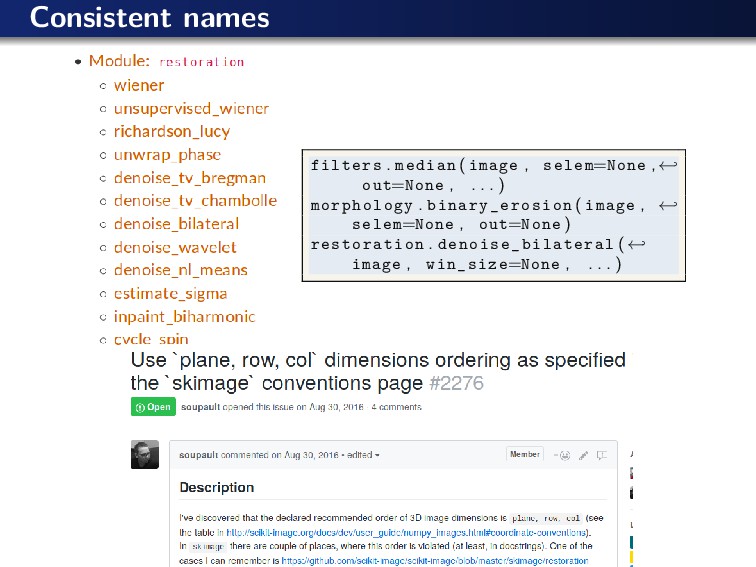
Consistent names filters . median ( image , selem=None ,
← out=None , . . . ) morphology . binary_erosion ( image , ← selem=None , out=None ) restoration . denoise_bilateral (← image , win_size=None , . . . ) -
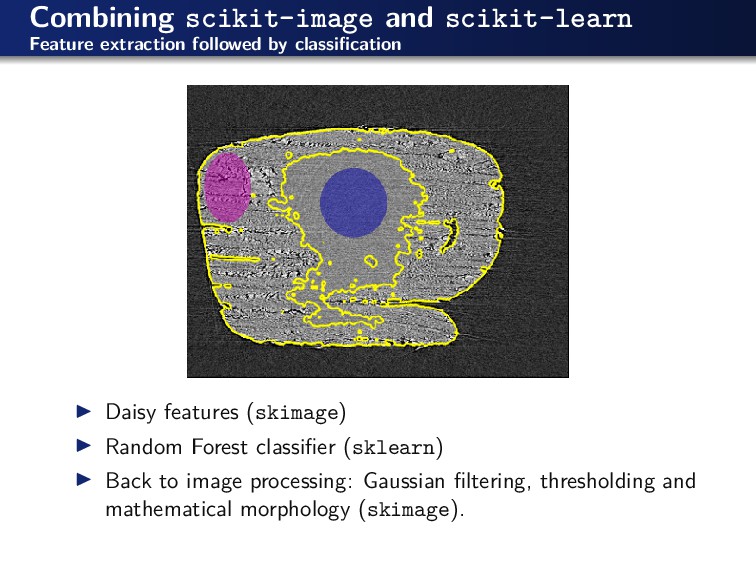
Combining scikit-image and scikit-learn Feature extraction followed by classification Daisy
features (skimage) Random Forest classifier (sklearn) Back to image processing: Gaussian filtering, thresholding and mathematical morphology (skimage). -
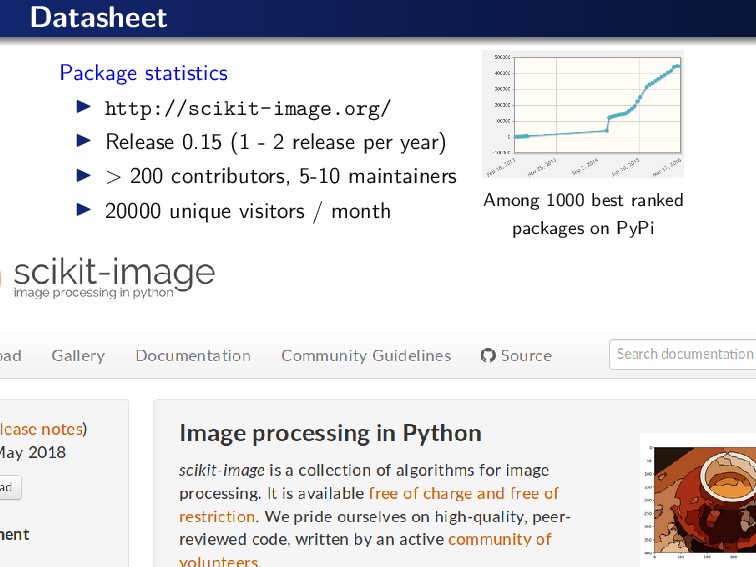
Datasheet Package statistics http://scikit-image.org/ Release 0.15 (1 - 2 release
per year) > 200 contributors, 5-10 maintainers 20000 unique visitors / month Among 1000 best ranked packages on PyPi -
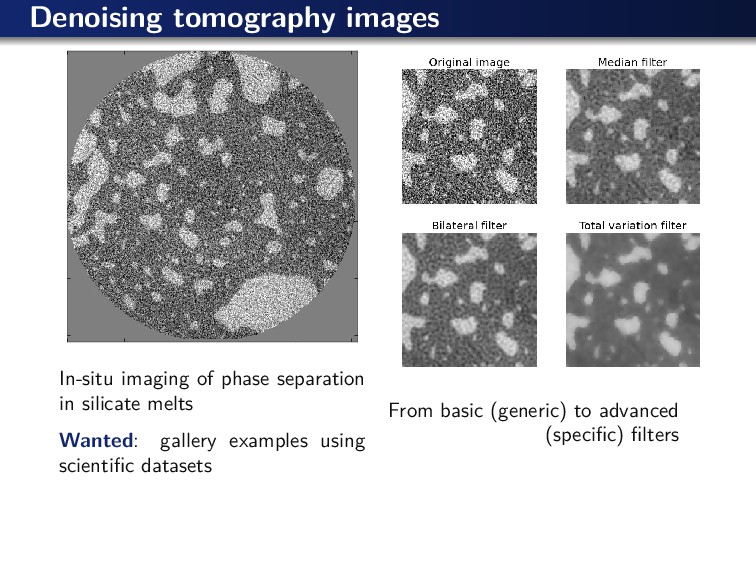
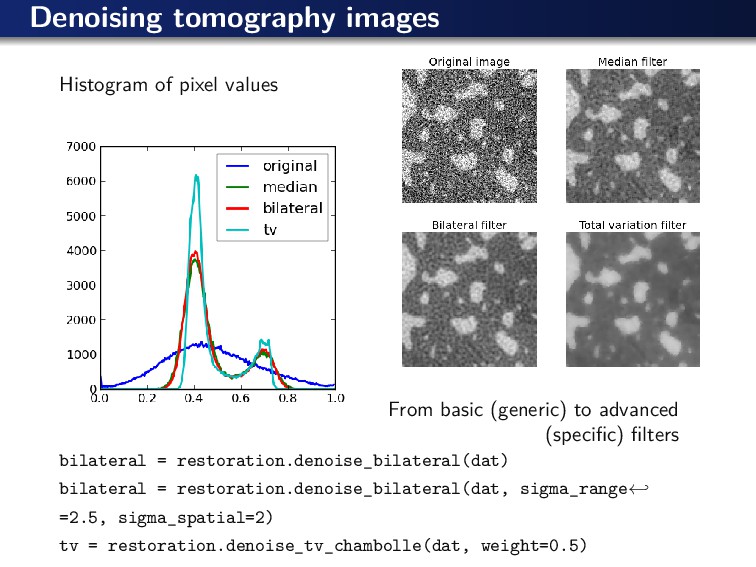
Denoising tomography images In-situ imaging of phase separation in silicate
melts Wanted: gallery examples using scientific datasets From basic (generic) to advanced (specific) filters -
Denoising tomography images Histogram of pixel values From basic (generic)
to advanced (specific) filters bilateral = restoration.denoise_bilateral(dat) bilateral = restoration.denoise_bilateral(dat, sigma_range← =2.5, sigma_spatial=2) tv = restoration.denoise_tv_chambolle(dat, weight=0.5) -
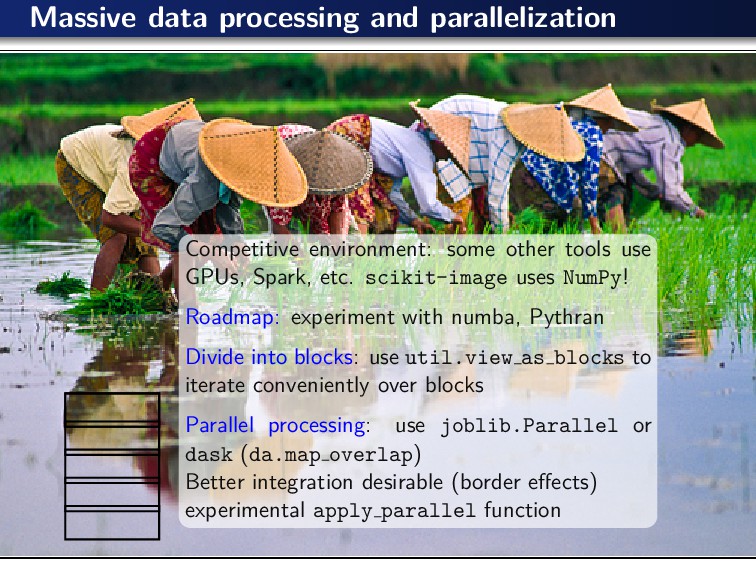
Massive data processing and parallelization Competitive environment: some other tools
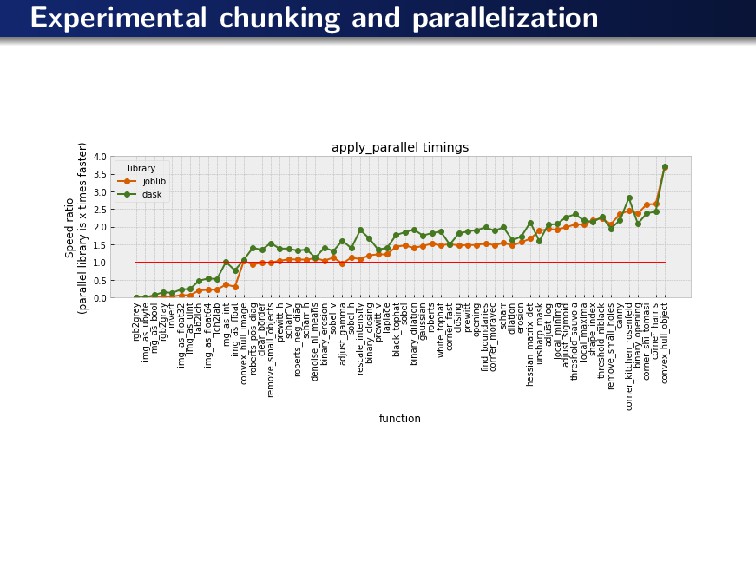
use GPUs, Spark, etc. scikit-image uses NumPy! Roadmap: experiment with numba, Pythran Divide into blocks: use util.view as blocks to iterate conveniently over blocks Parallel processing: use joblib.Parallel or dask (da.map overlap) Better integration desirable (border effects) experimental apply parallel function -
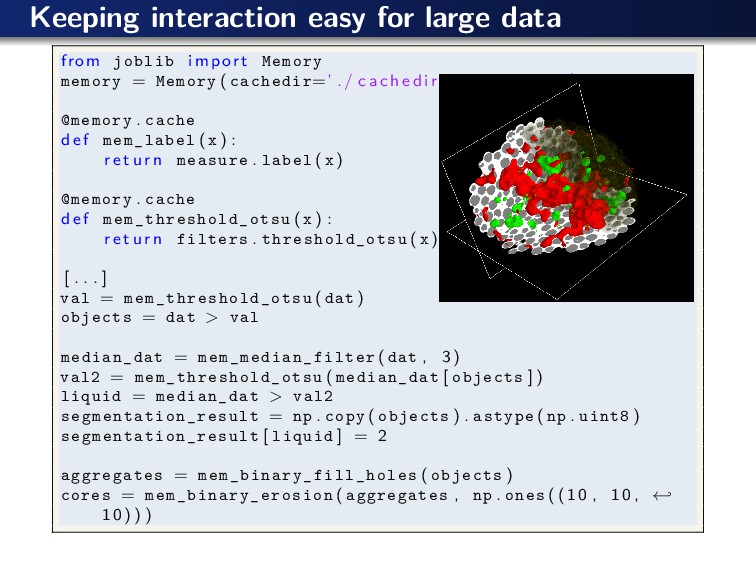
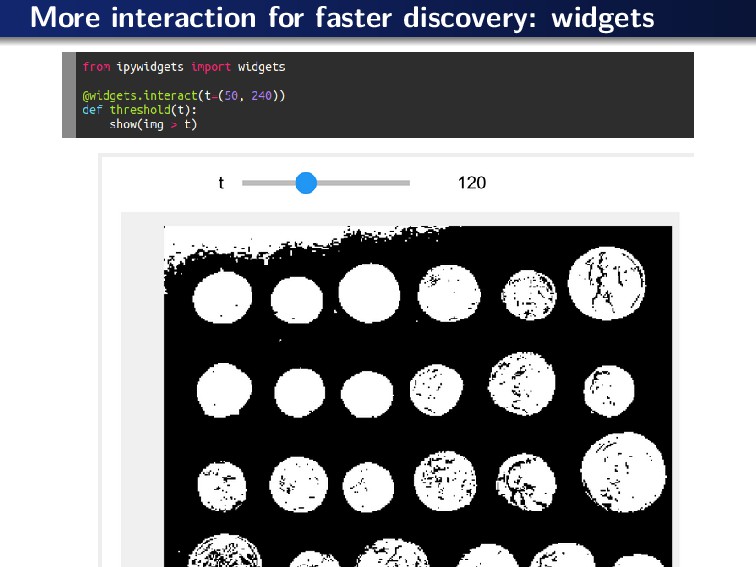
Keeping interaction easy for large data from joblib import Memory
memory = Memory ( cachedir=’ . / c a c h e d i r ’ , verbose=0) @memory . cache def mem_label ( x ) : r e t u r n measure . label ( x ) @memory . cache def mem_threshold_otsu ( x ) : r e t u r n filters . threshold_otsu ( x ) [ . . . ] val = mem_threshold_otsu ( dat ) objects = dat > val median_dat = mem_median_filter ( dat , 3) val2 = mem_threshold_otsu ( median_dat [ objects ] ) liquid = median_dat > val2 segmentation_result = np . copy ( objects ) . astype ( np . uint8 ) segmentation_result [ liquid ] = 2 aggregates = mem_binary_fill_holes ( objects ) cores = mem_binary_erosion ( aggregates , np . ones ((10 , 10 , ← 10) ) ) -
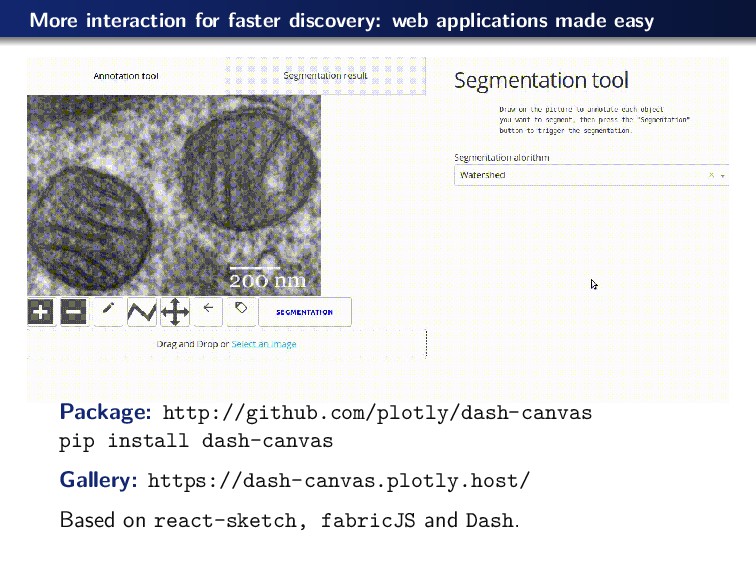
More interaction for faster discovery: web applications made easy Package:
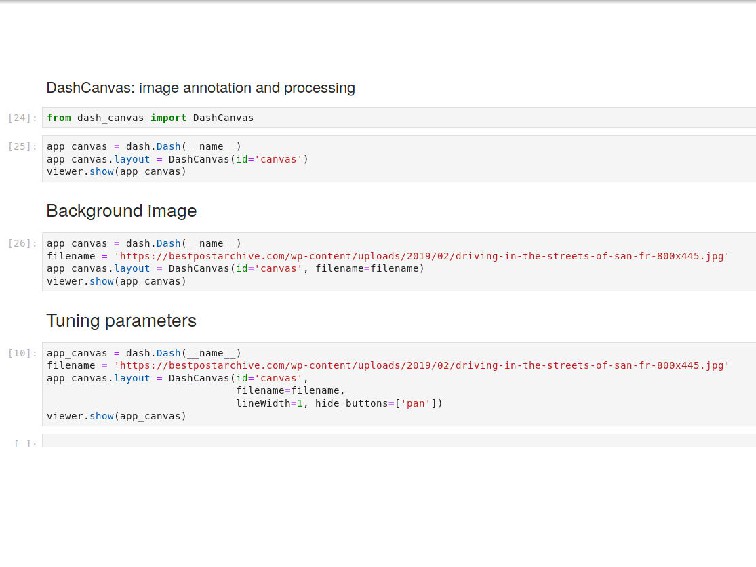
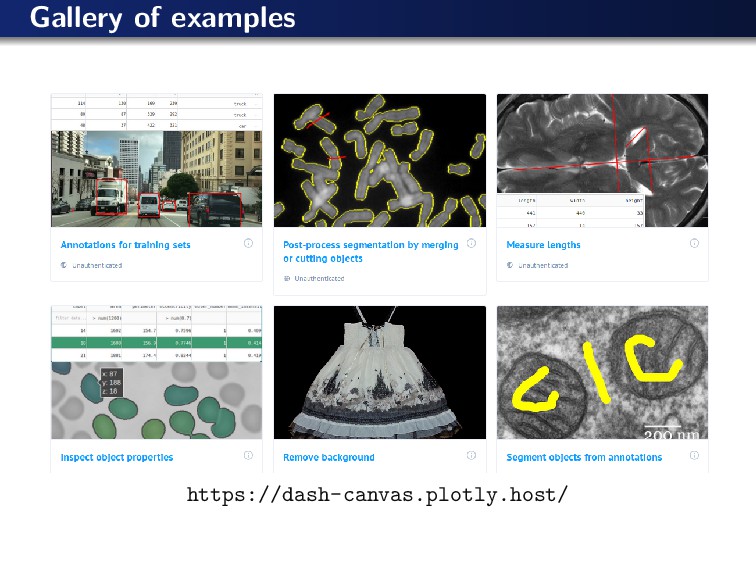
http://github.com/plotly/dash-canvas pip install dash-canvas Gallery: https://dash-canvas.plotly.host/ Based on react-sketch, fabricJS and Dash. -
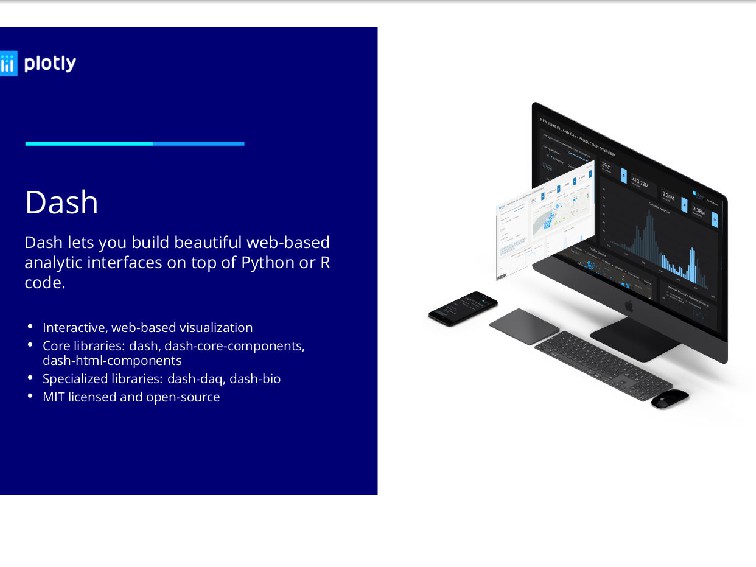
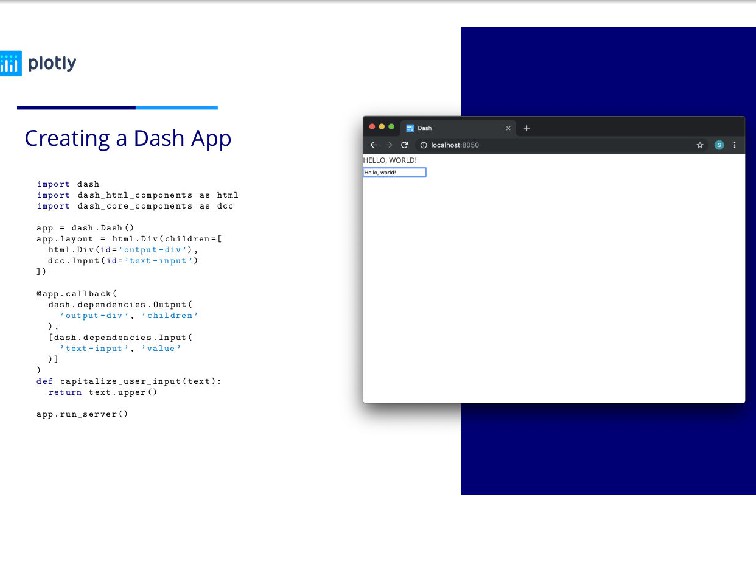
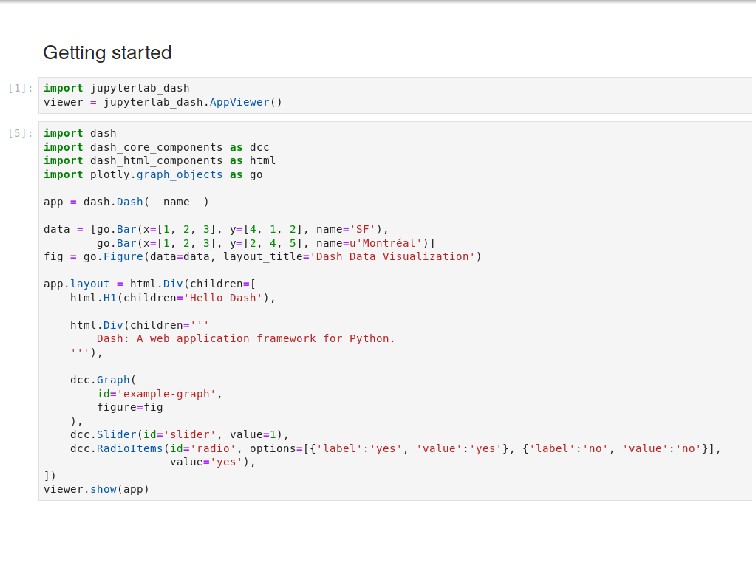
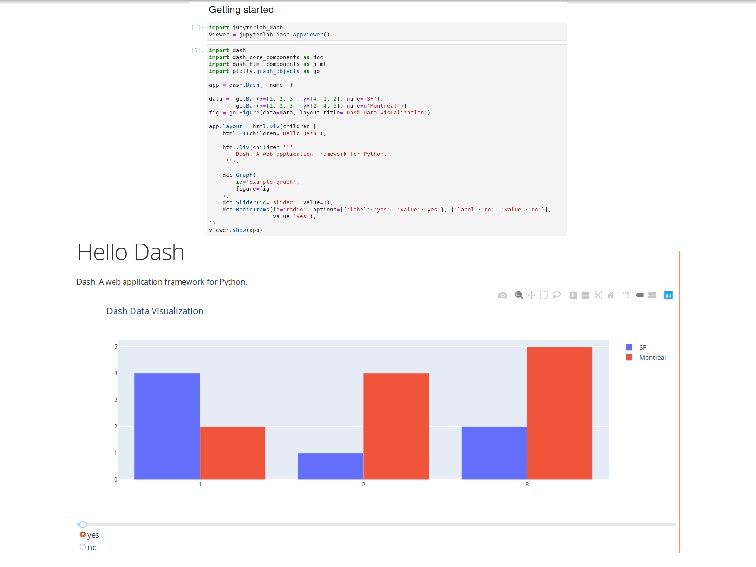
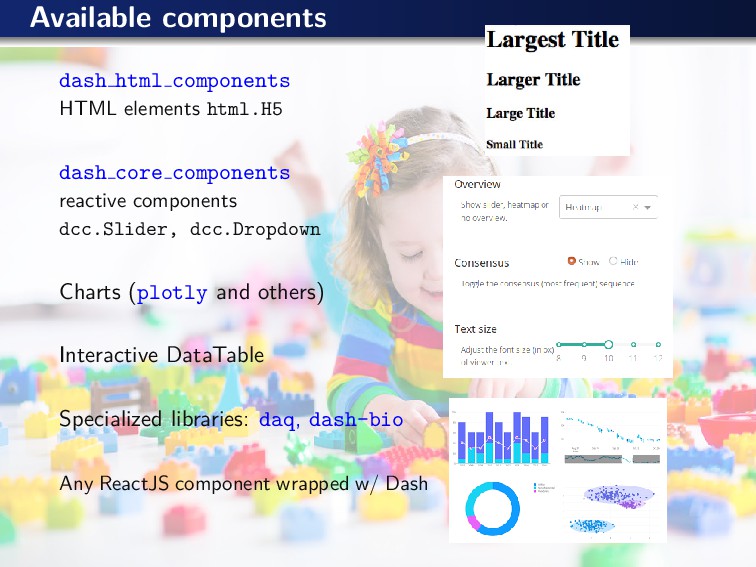
Available components dash html components HTML elements html.H5 dash core
components reactive components dcc.Slider, dcc.Dropdown Charts (plotly and others) Interactive DataTable Specialized libraries: daq, dash-bio Any ReactJS component wrapped w/ Dash -
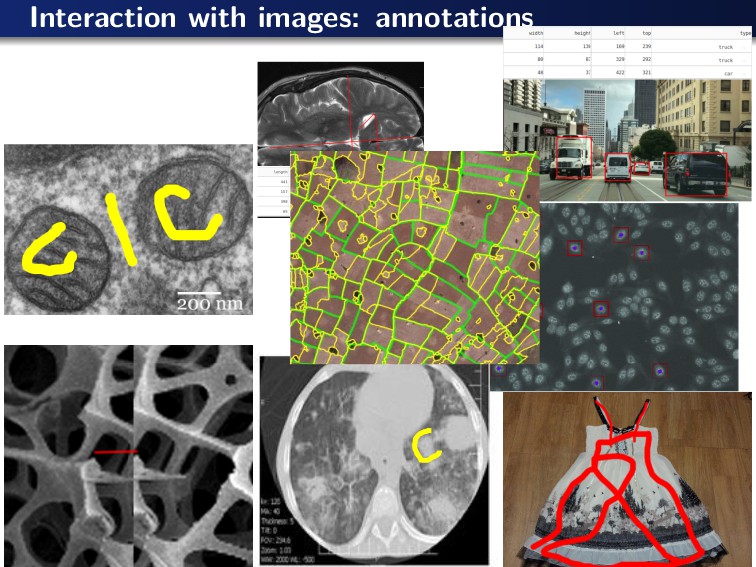
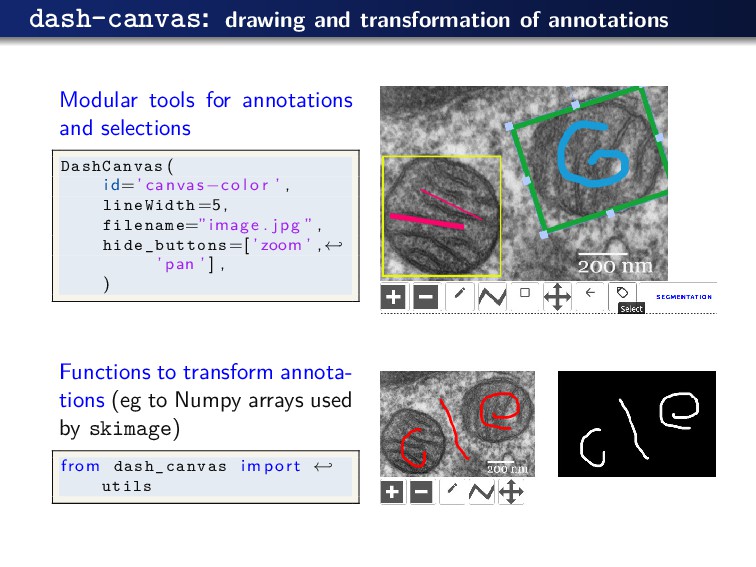
dash-canvas: drawing and transformation of annotations Modular tools for annotations
and selections DashCanvas ( i d=’ canvas−c o l o r ’ , lineWidth=5, filename=” image . jpg ” , hide_buttons=[ ’ zoom ’ ,← ’ pan ’ ] , ) Functions to transform annota- tions (eg to Numpy arrays used by skimage) from dash_canvas import ← utils -
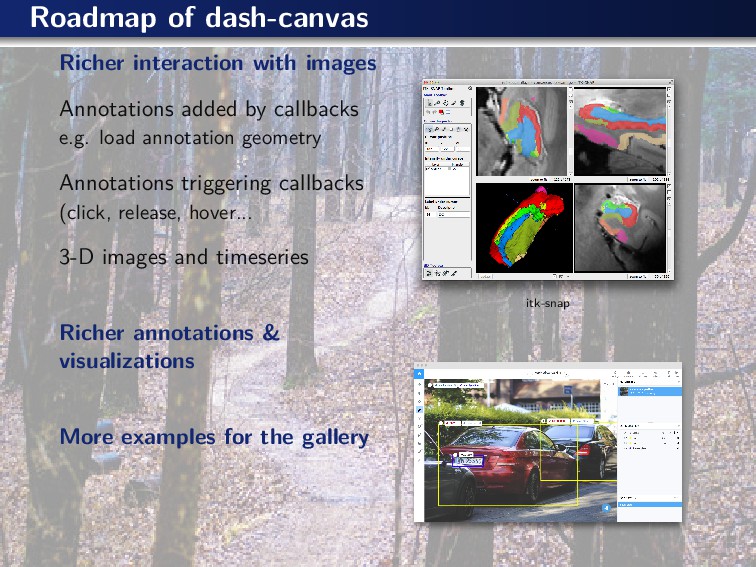
Roadmap of dash-canvas Richer interaction with images Annotations added by
callbacks e.g. load annotation geometry Annotations triggering callbacks (click, release, hover... 3-D images and timeseries Richer annotations & visualizations More examples for the gallery itk-snap -
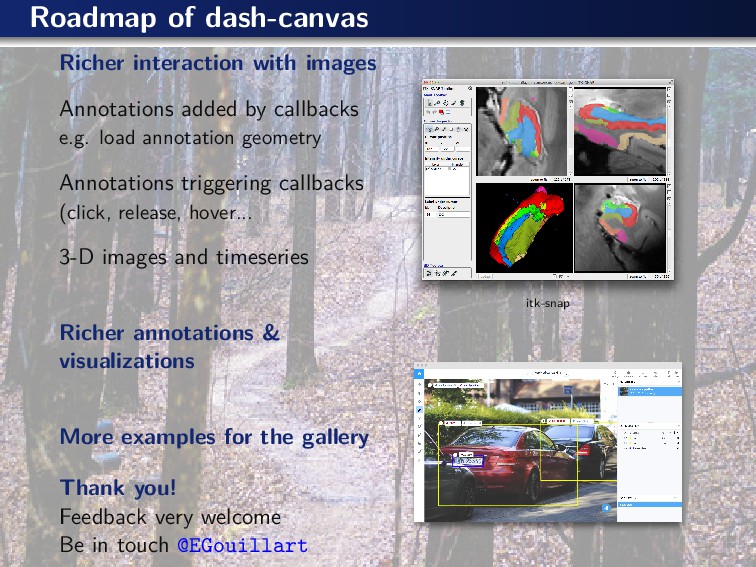
Roadmap of dash-canvas Richer interaction with images Annotations added by
callbacks e.g. load annotation geometry Annotations triggering callbacks (click, release, hover... 3-D images and timeseries Richer annotations & visualizations More examples for the gallery Thank you! Feedback very welcome Be in touch @EGouillart itk-snap