Upgrade to Pro
— share decks privately, control downloads, hide ads and more …
Speaker Deck
Features
Speaker Deck
PRO
Sign in
Sign up for free
Search
Search
Andrew Frazer
Search
Energy Now Expo 2013
February 21, 2013
57
0
Share
Embed
Copy iframe code
Copy JS code
Copy link
Start on current slide
Andrew Frazer
Is hydropower responsible for depleted fish stocks?
Energy Now Expo 2013
February 21, 2013
More Decks by Energy Now Expo 2013
See All by Energy Now Expo 2013
David Papworth
energynowexpo
0
54
John Newton
energynowexpo
1
83
Gary Burgess
energynowexpo
0
65
James Hoare
energynowexpo
0
100
Jonathan Scurlock
energynowexpo
0
79
Mike Cave
energynowexpo
0
57
Richard Jones
energynowexpo
0
76
Rob Meadley
energynowexpo
0
74
Robert Goss
energynowexpo
0
61
Featured
See All Featured
Stop Working from a Prison Cell
hatefulcrawdad
274
21k
We Have a Design System, Now What?
morganepeng
55
8.2k
Why You Should Never Use an ORM
jnunemaker
PRO
61
9.9k
Effective software design: The role of men in debugging patriarchy in IT @ Voxxed Days AMS
baasie
0
410
We Are The Robots
honzajavorek
0
250
Balancing Empowerment & Direction
lara
6
1.2k
The Power of CSS Pseudo Elements
geoffreycrofte
82
6.3k
DevOps and Value Stream Thinking: Enabling flow, efficiency and business value
helenjbeal
1
240
Pawsitive SEO: Lessons from My Dog (and Many Mistakes) on Thriving as a Consultant in the Age of AI
davidcarrasco
0
160
Impact Scores and Hybrid Strategies: The future of link building
tamaranovitovic
0
310
Code Reviewing Like a Champion
maltzj
528
40k
Music & Morning Musume
bryan
47
7.2k
Transcript
Andrew Frazer, Harperstown Power
None
None
None
None
None
None
None
None
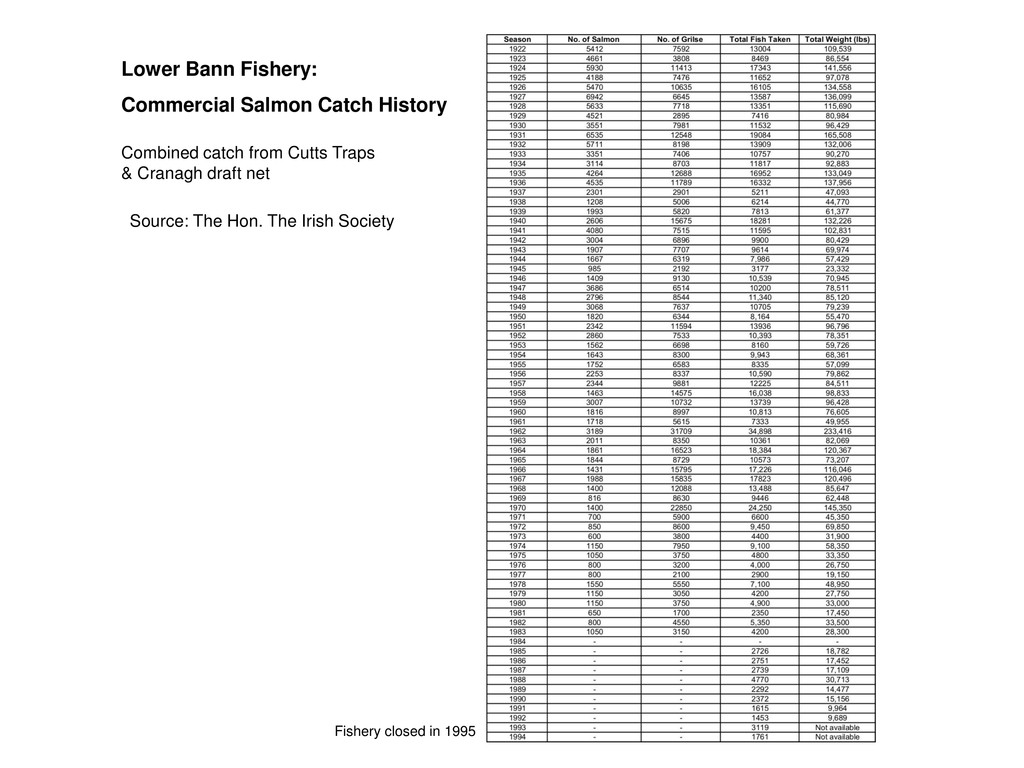
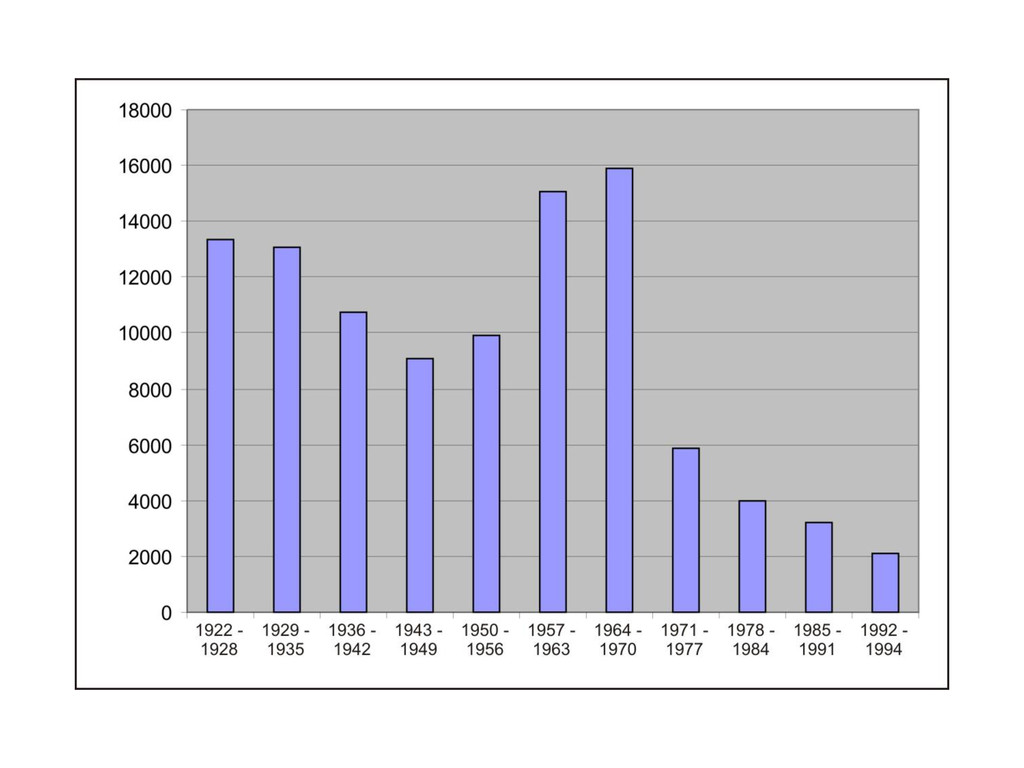
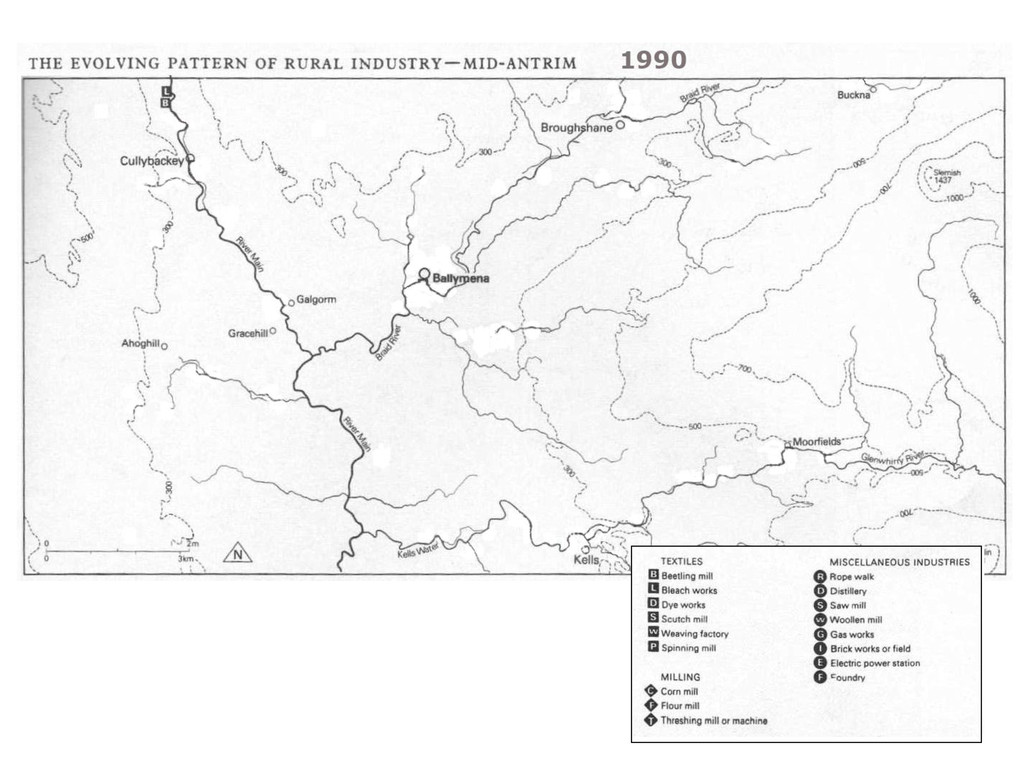
Lower Bann Fishery: Commercial Salmon Catch History Combined catch from
Cutts Traps & Cranagh draft net Source: The Hon. The Irish Society Fishery closed in 1995
None
None
None
None
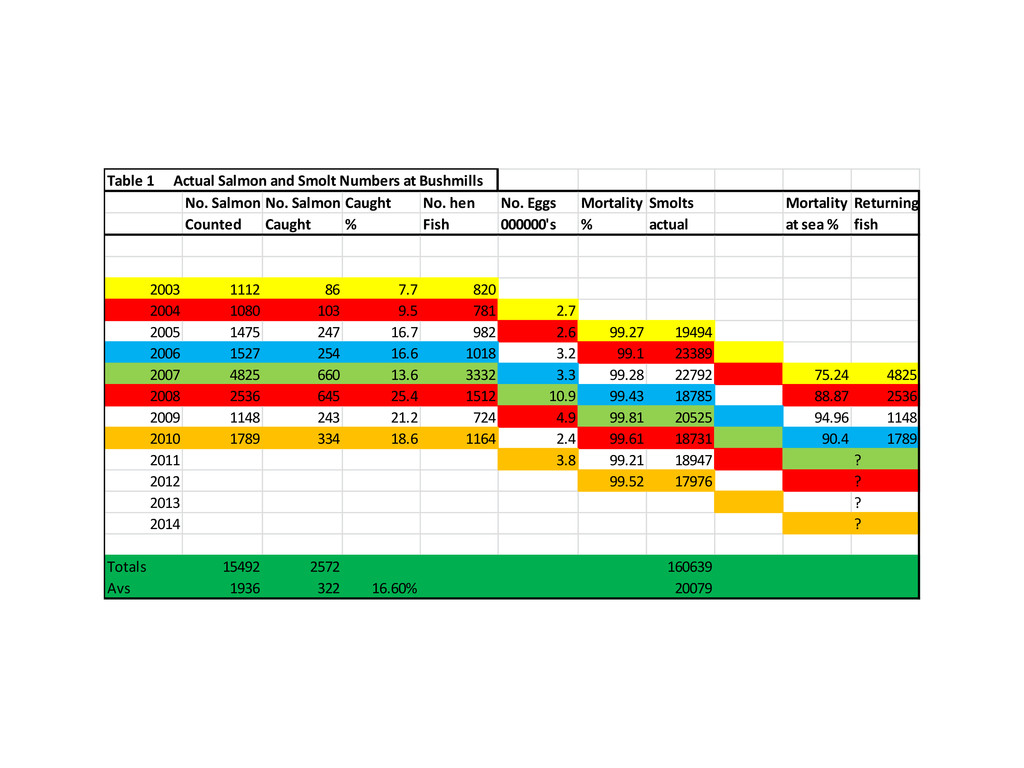
Table 1 Actual Salmon and Smolt Numbers at Bushmills No.
Salmon No. Salmon Caught No. hen No. Eggs Mortality Smolts Mortality Returning Counted Caught % Fish 000000's % actual at sea % fish 2003 1112 86 7.7 820 2004 1080 103 9.5 781 2.7 2005 1475 247 16.7 982 2.6 99.27 19494 2006 1527 254 16.6 1018 3.2 99.1 23389 2007 4825 660 13.6 3332 3.3 99.28 22792 75.24 4825 2008 2536 645 25.4 1512 10.9 99.43 18785 88.87 2536 2009 1148 243 21.2 724 4.9 99.81 20525 94.96 1148 2010 1789 334 18.6 1164 2.4 99.61 18731 90.4 1789 2011 3.8 99.21 18947 ? 2012 99.52 17976 ? 2013 ? 2014 ? Totals 15492 2572 160639 Avs 1936 322 16.60% 20079
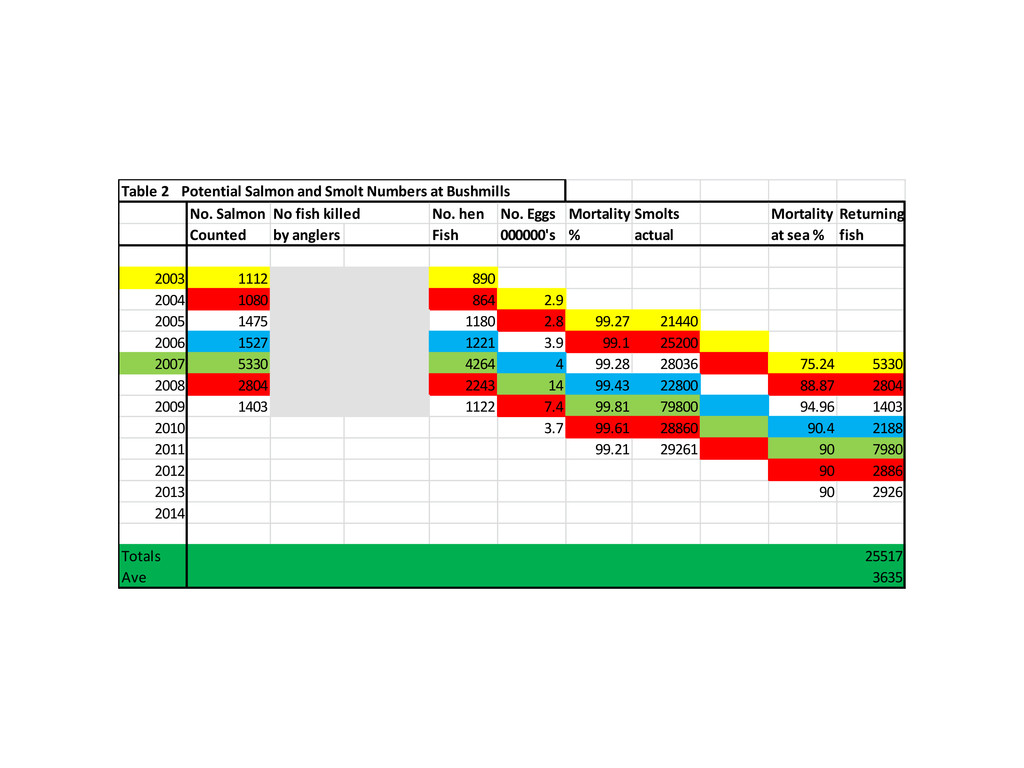
Table 2 Potential Salmon and Smolt Numbers at Bushmills No.
Salmon No fish killed No. hen No. Eggs Mortality Smolts Mortality Returning Counted by anglers Fish 000000's % actual at sea % fish 2003 1112 890 2004 1080 864 2.9 2005 1475 1180 2.8 99.27 21440 2006 1527 1221 3.9 99.1 25200 2007 5330 4264 4 99.28 28036 75.24 5330 2008 2804 2243 14 99.43 22800 88.87 2804 2009 1403 1122 7.4 99.81 79800 94.96 1403 2010 3.7 99.61 28860 90.4 2188 2011 99.21 29261 90 7980 2012 90 2886 2013 90 2926 2014 Totals 25517 Ave 3635
None
None