Upgrade to Pro — share decks privately, control downloads, hide ads and more …

Performance Testing and Optimization with Laravel and Lumen

Performance Testing and Optimization with Laravel and Lumen

Presented at the Laravel Chicago meetup on June 21, 2016: http://www.meetup.com/laravel-chicago/events/231546514/

Automated web app testing is not very rare anymore - there are many resources for writing unit tests as well as functional/acceptance tests, as seen in May's meetup. Code should be tested with every deployment to ensure functionality is working as expected.

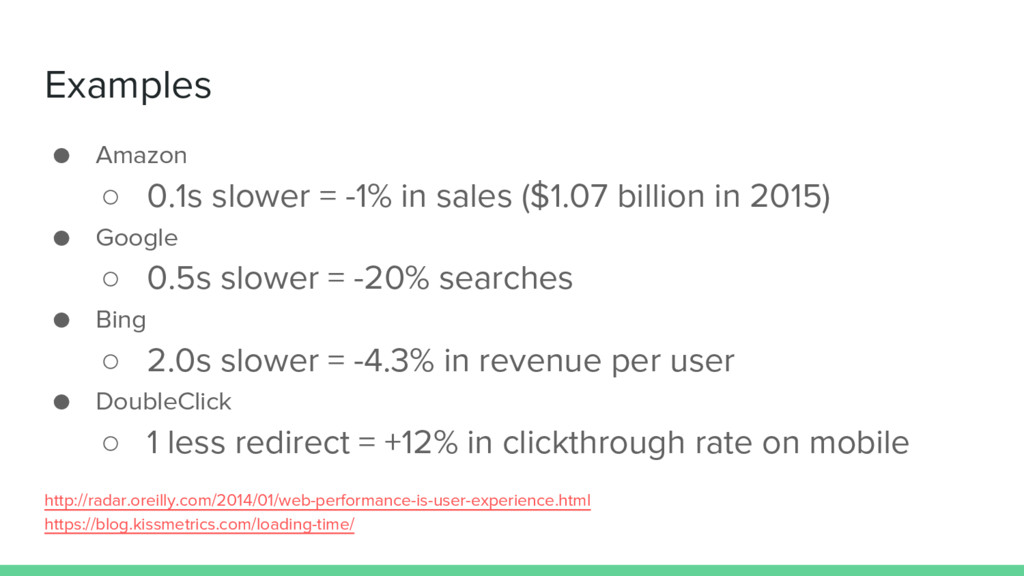
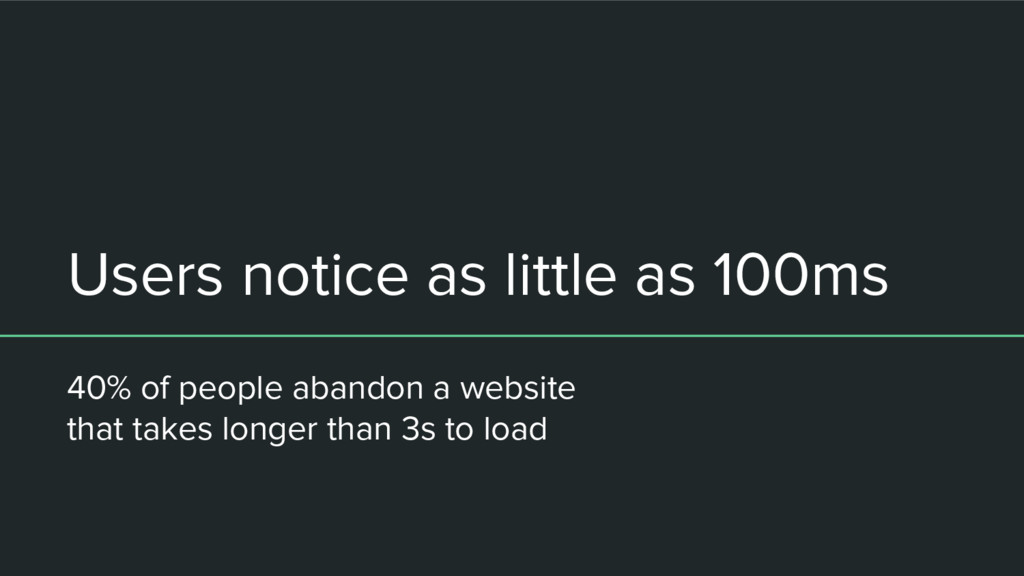
However, users expect more than a functional website. They expect a well-designed site that is also as fast as possible. Generally performance testing and optimization have been reactive rather than proactive, but now performance considered a user experience requirement. Like any other kind of testing, proactive performance testing and optimization can catch many significant issues before they become an issue.

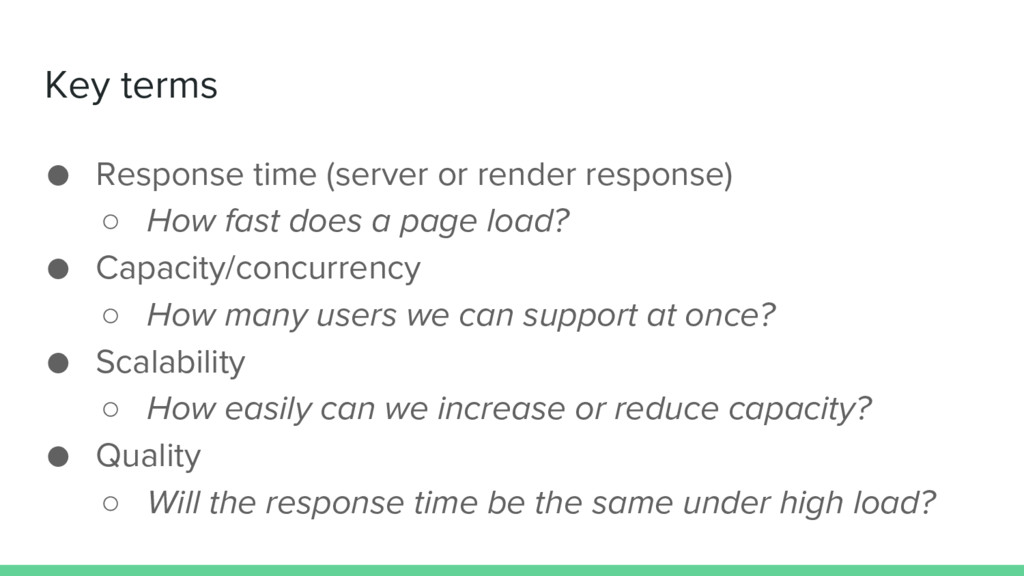
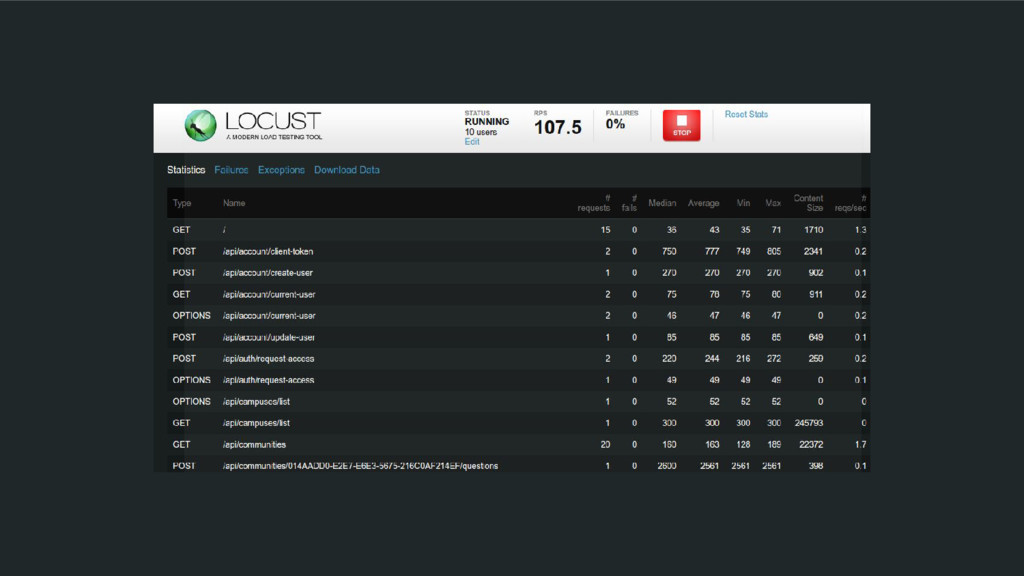
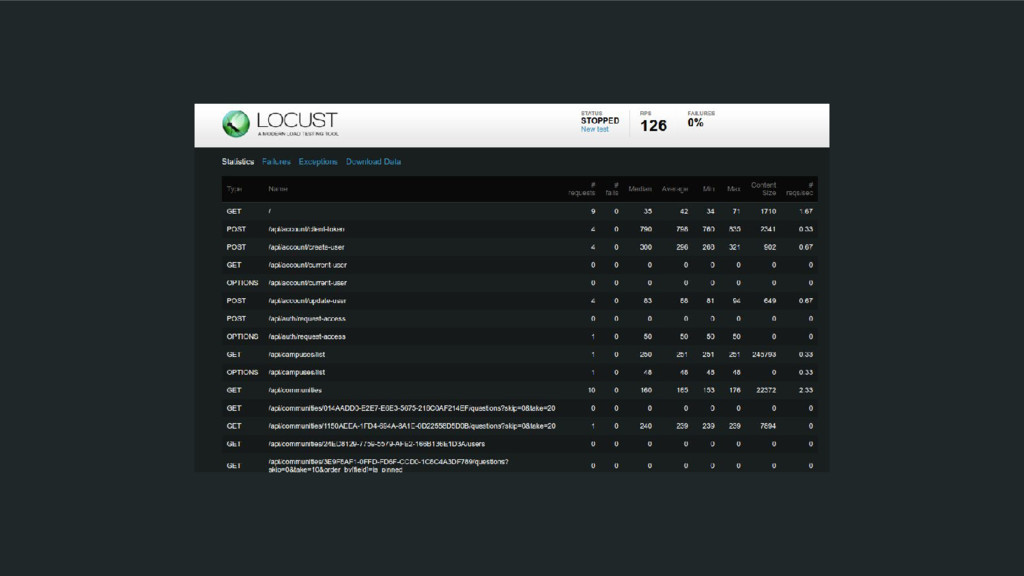
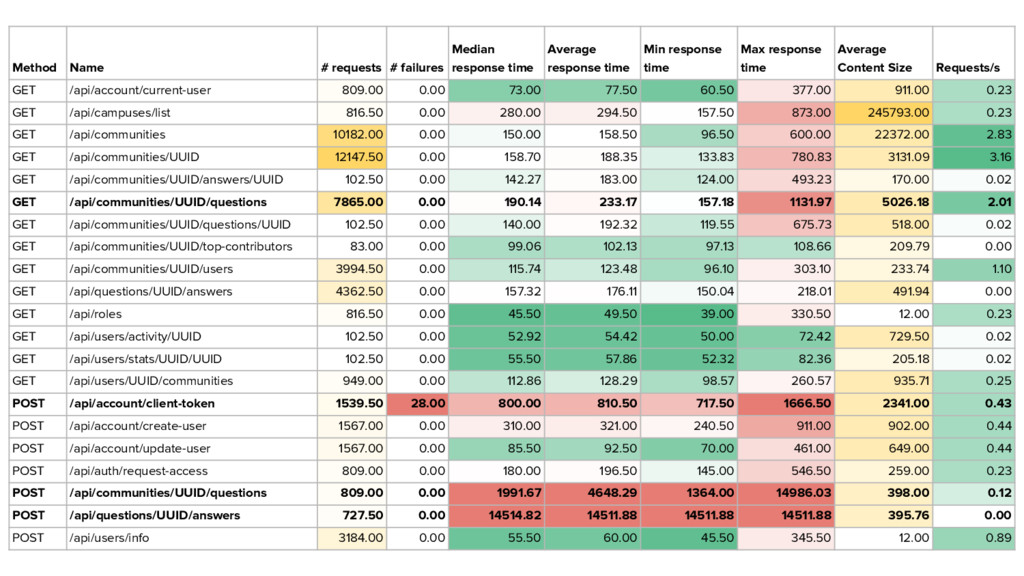
Even with PHP 7's massive speed improvements, applications can still be slow. We'll discuss in-depth how to test the performance of your Laravel/Lumen applications, as well as how you can take the results of the test and make changes to optimize your application. You'll see how to stress test your application, how to evaluate the results, and what performance improvements to make to achieve better results.

----

Eric Tendian is a backend engineer at Packback, an educational technology company with a backend of microservices in Lumen and Laravel. Recently he developed and ran multiple load tests of Packback's microservices, then optimized some of those services resulting in a 10x speed boost on the slowest endpoints.

Eric Tendian

June 21, 2016
Tweet

More Decks by Eric Tendian

Other Decks in Programming

Transcript

  1. Hi! I’m Eric Tendian Software Engineer at Packback A lot

    of backend dev, some DevOps Senior at Illinois Institute of Technology GitHub @EricTendian I tweet @EricTendian (mostly tweets from the police scanner)
  2. Agenda 1. How important is performance these days? 2. Challenges

    to performance testing 3. A sample performance optimization project, from start to finish a. The question b. Planning a load test c. Setting up the load test d. Running the load test e. Analyzing the results f. Researching and testing optimizations g. Repeating steps d-f until satisfied 4. Load testing script code sample 5. Questions?
  3. Examples • Amazon ◦ 0.1s slower = -1% in sales

    ($1.07 billion in 2015) • Google ◦ 0.5s slower = -20% searches • Bing ◦ 2.0s slower = -4.3% in revenue per user • DoubleClick ◦ 1 less redirect = +12% in clickthrough rate on mobile http://radar.oreilly.com/2014/01/web-performance-is-user-experience.html https://blog.kissmetrics.com/loading-time/
  4. Users notice as little as 100ms 40% of people abandon

    a website that takes longer than 3s to load
  5. Key terms • Response time (server or render response) ◦

    How fast does a page load? • Capacity/concurrency ◦ How many users we can support at once? • Scalability ◦ How easily can we increase or reduce capacity? • Quality ◦ Will the response time be the same under high load?
  6. Testing types • Load testing Expected load, set duration •

    Stress testing Finding the maximum load, variable duration • Soak testing Expected load, extended duration • Spike testing Large amount of load, short duration - quick changes • Profiling Very granular performance analysis, often used for optimization
  7. Step 1: Plan the test A. Determine common user actions

    a. Login b. User signup c. Viewing user profile page d. Viewing feed of questions (page 1, page n) e. Viewing a question thread f. Posting a new question, answer B. Find out how often those actions occur with Google Analytics data with advanced filtering (see subsequent screenshot)
  8. Projected load for Summer ‘16, totals Based on projected student

    count: • Highest daily: 14,000 pageviews • Highest hourly: 1,400 pageviews ◦ APIs should be able to handle 2,800 requests per hour • Highest weekly: 50,000 pageviews • Highest monthly: 184,000 pageviews • Load test should send at least 3,000 requests per hour
  9. Projected load for Summer ‘16 per user action Action Requests

    per hour As a % of highest hourly traffic Login 140 10 User signup 320 20% of the semester’s users sign up in one hour Viewing user profile page 140 10 Viewing question list 420 30 Viewing single question 490 35 Posting a new question 70 5 Posting a new answer 140 10 Leaderboard 14 1
  10. Step 1: Plan the test C. Research load testing tools

    and choose one a. Services i. Redline13 - can upload custom tests (PHP, JS, JMeter) - $ ii. Blazemeter - most advanced - $$$ iii. Flood.io - supports JMeter - $$ iv. Loader.io - can integrate into deployment - $$ b. Open Source tools i. Apache JMeter - complex ii. Goad (Go-based) - somewhat complex, experimental iii. Gatling (Scala-based, has a domain-specific language) iv. Locust (Python-based) - easy to use, simple yet extensible c. Chose Locust (easy to learn even without Python knowledge)
  11. Step 2: Setup the test A. Setup load testing environment,

    should replicate production a. Frontend app b. Backend - relevant microservices: Users API and Questions API B. Record frontend API calls during each user action a. Used Chrome DevTools - Network tab (see next screenshot) C. Configure the test tool to replicate these API calls a. Write the script D. Determine appropriate frequency of requests for each API call, based on data from Google Analytics
  12. Step 3: Run the test A. Determine number of users

    to simulate, or number of requests per second a. # of requests per hour -> # of requests per second -> # of users to generate that load B. Run a short test to verify everything works (10mins) C. Run multiple long tests (1hr) - we did 2 D. From each test, record data a. response times b. any failures E. Reset database after testing to a known state
  13. Step 4: Review test results A. Load testing tools generate

    reports, get those a. CSV (our tool did this) b. HTML report with graphs (fancy ones) B. Analyze the data a. Find the normal distribution of response times b. Average the data generated from multiple trials C. Identify slow endpoints to optimize
  14. Method Name # requests # failures Median response time Average

    response time Min response time Max response time Average Content Size Requests/s GET /api/account/current-user 809.00 0.00 73.00 77.50 60.50 377.00 911.00 0.23 GET /api/campuses/list 816.50 0.00 280.00 294.50 157.50 873.00 245793.00 0.23 GET /api/communities 10182.00 0.00 150.00 158.50 96.50 600.00 22372.00 2.83 GET /api/communities/UUID 12147.50 0.00 158.70 188.35 133.83 780.83 3131.09 3.16 GET /api/communities/UUID/answers/UUID 102.50 0.00 142.27 183.00 124.00 493.23 170.00 0.02 GET /api/communities/UUID/questions 7865.00 0.00 190.14 233.17 157.18 1131.97 5026.18 2.01 GET /api/communities/UUID/questions/UUID 102.50 0.00 140.00 192.32 119.55 675.73 518.00 0.02 GET /api/communities/UUID/top-contributors 83.00 0.00 99.06 102.13 97.13 108.66 209.79 0.00 GET /api/communities/UUID/users 3994.50 0.00 115.74 123.48 96.10 303.10 233.74 1.10 GET /api/questions/UUID/answers 4362.50 0.00 157.32 176.11 150.04 218.01 491.94 0.00 GET /api/roles 816.50 0.00 45.50 49.50 39.00 330.50 12.00 0.23 GET /api/users/activity/UUID 102.50 0.00 52.92 54.42 50.00 72.42 729.50 0.02 GET /api/users/stats/UUID/UUID 102.50 0.00 55.50 57.86 52.32 82.36 205.18 0.02 GET /api/users/UUID/communities 949.00 0.00 112.86 128.29 98.57 260.57 935.71 0.25 POST /api/account/client-token 1539.50 28.00 800.00 810.50 717.50 1666.50 2341.00 0.43 POST /api/account/create-user 1567.00 0.00 310.00 321.00 240.50 911.00 902.00 0.44 POST /api/account/update-user 1567.00 0.00 85.50 92.50 70.00 461.00 649.00 0.44 POST /api/auth/request-access 809.00 0.00 180.00 196.50 145.00 546.50 259.00 0.23 POST /api/communities/UUID/questions 809.00 0.00 1991.67 4648.29 1364.00 14986.03 398.00 0.12 POST /api/questions/UUID/answers 727.50 0.00 14514.82 14511.88 14511.88 14511.88 395.76 0.00 POST /api/users/info 3184.00 0.00 55.50 60.00 45.50 345.50 12.00 0.89
  15. Method Name # requests 50% 66% 75% 80% 90% 95%

    98% 99% 100% GET /api/account/current-user 789 72.00 74.00 76.00 77.00 81.00 90.00 120.00 210.00 421.00 GET /api/campuses/list 763 280.00 290.00 290.00 300.00 320.00 340.00 370.00 420.00 559.00 GET /api/communities 9814 160.00 160.00 170.00 170.00 180.00 200.00 260.00 320.00 525.00 GET /api/communities/UUID 11664 167.19 184.29 202.84 212.53 236.57 306.00 683.91 796.25 794.76 GET /api/communities/UUID/answers/UUID 85 164.55 176.36 210.91 215.45 290.91 428.18 428.18 428.18 423.45 GET /api/communities/UUID/questions 7538 196.71 221.50 247.63 261.85 291.50 385.49 983.41 1143.64 1141.49 GET /api/communities/UUID/questions/UUID 85 159.09 165.45 211.82 217.27 242.73 666.36 666.36 666.36 672.09 GET /api/communities/UUID/top-contributors 71 110.05 110.05 111.89 111.89 111.89 111.89 111.89 111.89 112.13 GET /api/communities/UUID/users 3885 121.85 129.07 133.15 137.22 150.37 177.96 235.93 309.26 309.06 GET /api/questions/UUID/answers 4099 181.45 182.27 219.89 224.24 226.65 226.65 226.65 226.65 226.16 GET /api/roles 763 45.00 47.00 48.00 48.00 51.00 54.00 84.00 160.00 340.00 GET /api/users/activity/UUID 85 53.50 53.83 54.67 54.83 55.50 57.50 57.67 58.67 58.67 GET /api/users/stats/UUID/UUID 85 55.91 57.00 62.45 63.00 66.55 80.73 80.73 80.73 80.64 GET /api/users/UUID/communities 874 137.14 140.00 162.86 168.57 188.57 204.29 212.86 231.43 247.86 POST /api/account/client-token 1506 840.00 910.00 930.00 940.00 960.00 990.00 1000.00 1100.00 1799.00 POST /api/account/create-user 1506 310.00 330.00 340.00 350.00 390.00 460.00 530.00 590.00 1061.00 POST /api/account/update-user 1506 85.00 88.00 90.00 92.00 100.00 120.00 210.00 270.00 434.00 POST /api/auth/request-access 789 180.00 190.00 200.00 210.00 240.00 290.00 350.00 420.00 656.00 POST /api/communities/UUID/questions 789 2433.33 5314.81 9329.63 11405.56 16088.89 18575.93 18631.48 18631.48 18671.81 POST /api/questions/UUID/answers 629 12116.22 12116.22 12116.22 12116.22 12116.22 12116.22 12116.22 12116.22 12112.10 POST /api/users/info 3072 55.00 58.00 59.00 61.00 65.00 82.00 97.00 140.00 308.00
  16. Step 5: Optimize! Re-test as needed • Make use of

    Laravel’s easy caching facade ◦ Use in-memory cache stores like Redis or Memcached • Put long-running, response-insensitive tasks in a queue ◦ Parallelize long tasks by breaking them up and running multiple queue workers • Optimize SQL queries - use eager loading whenever possible ◦ Check MySQL slow query log ◦ Turn on MySQL general log to see all the queries being made • Add indexes to migrations for columns used in WHERE, ORDER BY • Record external API calls with Wireshark ◦ How long does each take? Unusual network traffic?
  17. Step 5: Optimize! Re-test as needed • Use xdebug to

    profile specific API calls ◦ xdebug.profiler_enable_trigger=1 - http://URL?XDEBUG_PROFILE=1 ◦ https://xdebug.org/docs/profiler ◦ View xdebug output with kcachegrind • Optimize nginx, php-fpm, php configs ◦ Check out PPM (PHP Process Manager) - no more bootstrapping on every request • General system optimization ◦ SSD over HDD - check iowait % ◦ Disable transparent huge pages (what solved most of our issues) ◦ Using Forge? Turn off services you don’t need
  18. What we improved • Posting a question ◦ Before: Average

    response time of 4.6 seconds ◦ After: Average response time of 0.7 seconds - ∇3.9 • Posting an answer ◦ Before: Average response time of 14.5 seconds ◦ After: Average response time of 1.3 seconds - ∇13.2 • Viewing list of questions ◦ Before: Average response time of 0.23 seconds, max response of 1.1 seconds ◦ After: Average response time of 0.17 seconds (∇0.06), max response of 0.22 seconds (∇0.88) • Getting a “client token” from Braintree, for submitting payment info ◦ Before: Average response time of 0.81 seconds ◦ After: Average response time of 0.77 seconds (∇0.04) - cannot change 3rd party API call
  19. Continuing to monitor performance • New Relic for monitoring overall

    API performance ◦ In Laravel, it will break down requests and show individual transactions ◦ ◦ ◦